![]()
Since 1985, on the first day of my "Sociology/Anthropology of Death and Dying" course I have surveyed my students' death-related attitudes. One instrument that I have consistently used is Edwin Shneidman's "You & Death" questionnaire, that first appeared in the August 1970 issue of Psychology Today. No generalization is meant to be derived from the results presented below. The respondents are generally upper- middle class undergraduates in a small liberal arts college, 19 to 22 years of age, Anglo, and largely from Texas and the Midwest. Many who take this course do so because it satisfies the university's requirement that students must pass a course in the role of values. The course attracts a fair share of pre med majors, and a fairly equal share of those from the humanities and social sciences.
With these qualifications in mind, these students can be understood as cultural barometers for those of their generation, social class, and geographic local (the geographic distribution of students has not changed much over the twelve years of this study).
To begin with, let's first see what trends in orientations toward
death are occurring and then see how these attitudes, fears and outlooks
coalesce. Survey years are collapsed 1985-88 (n=148), 1990-94 (n=155), 1995-98
(n=136), and 2000-2004 (n=150).
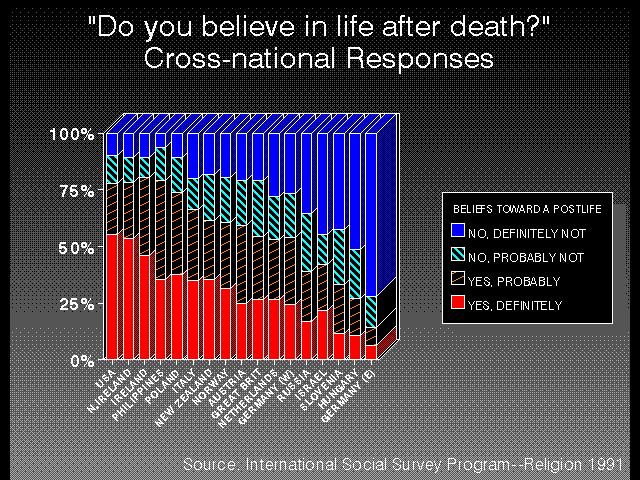
To what extent do you believe in a life after death? Strongly believe
in it; tend to believe in it; uncertain; tend to doubt it; convinced it
does not exist.
| 1985-1990 | 1991-1995 | 1996-2000 | 2002-2007 | TOTAL | |
| STR BELIEVE | 30% | 30% | 35% | 34% | 217 (32%) |
| SOME BELIEF | 29% | 27% | 21% | 27% | 177 (26%) |
| UNCERT | 22% | 27% | 27% | 22% | 165 (24%) |
| DOUBT, NO | 19% | 16% | 17% | 17% | 117 (17%) |
| TOTAL | 100% | 100% | 100% | 100% | 676 |
There's no significant change here: about three out of ten Trinity students strongly believe that there is an afterlife and nearly six out of ten hold at least some expectation. Less than two out of ten either tend to doubt it or believe death is, indeed, the end. This proportion of believers is significantly less than the American population at large.
Not surprisingly, religiosity has a profound role in shaping students' understandings of death. Consider how it shapes responses to the following:
What does death mean to you?
| RELIGIOSITY: | THE END | NEW BEGIN | OVERSOUL | SLEEP | SPIRIT SURVIVES |
DK | OTHER | TOTAL (n) |
| VERY | 1% | 46% | 2% | 2% | 35% | 7% | 7% | 100% (98) |
| SOMEWHAT | 7% | 22% | 11% | 3% | 41% | 11% | 3% | 100%(227) |
| SLIGHTLY | 22% | 9% | 7% | 10% | 33% | 19% | 1% | 100%(183) |
| NOT AT ALL | 43% | 3% | 7% | 5% | 15% | 25% | 2% | 100%(129) |
| ANTI-RELIG | 62% | 6% | 9% | 9% | 3% | 12% | 0% | 10%(34) |
| TOTAL | 20% | 18% | 8% | 5% | 31% | 16% | 2% | 671 |
What is your belief about the causes of most deaths?
Since only six students mentioned the first option, we combine it with the second and find:
| RELIGIOSITY | PERSONAL COMPLICITY |
JUST HAPPENS | OTHER | TOTAL (n) |
| VERY | 57% | 37% | 6% | 97 |
| SOMEWHAT | 49% | 48% | 3% | 227 |
| SLIGHTLY | 45% | 52% | 3% | 183 |
| NOT AT ALL | 45% | 53% | 2% | 129 |
| ANTI-RELIG | 15% | 79% | 6% | 34 |
| TOTAL | 47% | 50% | 3% | 670 |
As can be seen, the greater individuals' religiosity the greater their attribution of personal complicity in the cause of death.
To what extent are you interested in having your image survive after your own death through your children, books, good works, etc.? Very interested; moderately interested; not very interested; totally uninterested.
| 1985-1990 | 1991-1995 | 1996-2000 | 2002-2007 | TOTAL | |
| VERY INTER | 34% | 41% | 45% | 41% | 271 (40%) |
| MOD INTER | 25% | 32% | 22% | 27% | 180 (27%) |
| SOME, NONE | 41% | 27% | 33% | 33% | 226 (33%) |
| TOTAL | 100% | 100% | 100% | 100% | 677 |
Interest in some form of symbolic
immortality
has increased by one-third between the first and third time periods, from 34 percent
to 45 percent of Trinity students saying that they are "very interested" in the
preservation of their memory. In 2002, four months following the terrorist
attacks on the U.S., the lowest point was observed at 26%. Interest peaked
in 2004 with 56% expressing high interest and declined thereafter.
There have been some interesting differences between the sexes in
the percentages reporting being "very interested" in symbolic
immortality. In total, males (44%) are six percentage points more likely
than females (38%) to report high interest. In the 1985-88 period this percentage difference was
22 percentage points (47% v. 25%), however, in the 1995-99 period the correlation
flip-flopped as females (47%) became more likely than males (39%) to express great interest.
Consider the following table wherein we examine the relationship between
interest in immortality and responses to the question "How often do
you think about your own death--very frequently (at least once a day--5%
of sample), frequently (25%), occasionally (53%), rarely (13%), very rarely
or never (3%)?
| FREQUENCY OF DEATH THOUGHTS |
% "VERY INTERESTED" IN HAVING IMAGE SURVIVE |
||
| MALE | FEMALE | TOTAL | |
| FREQUENTLY+ | 68% | 42% | 48% |
| OCCASIONALLY | 40 | 39 | 39 |
| RARELY OR LESS | 29 | 29 | 30 |
| TOTAL | 44% | 38% | 40% |
Observe in the TOTAL column how interest in symbolic immortality increases with frequency of death thoughts. For both sexes, those who think frequently or very frequently about death are 60% more likely to be "very interested" in being remembered than those who think about it rarely at best. But observe how the greatest frequency of death thoughts translates into greater interest in symbolic immortality more for males than for females.
And what triggers the frequency of death thoughts? Examine the table below where frequency of thoughts are correlated with responses to the question "How often have you been in a situation in which you seriously thought you might die--many times (3% of sample), several times (19%), once or twice (56%), or never (23%)?"
| FREQUENCY OF SITUATIONS WHERE THOUGHT COULD DIE |
% THINKING OF DEATH FREQUENTLY+ |
||
| MALE | FEMALE | TOTAL | |
| SEVERAL+ | 41% | 43% | 42% |
| ONCE/TWICE | 23 | 26 | 25 |
| NEVER | 25 | 16 | 19 |
| TOTAL | 29% | 26% | 27% |
If it were possible would you want to know the exact date on which you are going to die?
| 1985-90 | 1991-95 | 1996-00 | 2002-07 | TOTAL | |
| YES | 12% | 16% | 23% | 13% | 105 (16%) |
| NO | 88% | 84% | 77% | 87% | 5672 (84%) |
| TOTAL | 100% | 100% | 100% | 100% | 672 |
Those wanting to know precisely when they will die nearly doubled, from 12 percent in the 1985-90 period to 23 by the late 1990s. (In 2002, the first post-911 survey, this desire to know dropped precipitously to 7%, jumped to 18% in 2003 and thereafter averaged 14%.) In total, males (19.3%) were slightly more likely than females (14.0%) to want to know. How differently might lives be lived if that ultimate of deadlines is known? At a minimum, one would sure know how to pace expenditures of retirement savings.
How important do you believe mourning and grief rituals (such as wakes and funerals) are for the survivors? Extremely important; somewhat important; undecided or don't know; not very important; not important at all.
|
% EXTREMELY IMPORTANT |
|||||
| 1985-1990 | 1991-1995 | 1996-2000 | 2002-2007 | TOTAL | |
| MALES | 29% | 52% | 55% | 60% | 212 (48%) |
| FEMALES | 43% | 59% | 44% | 35% | 460 (56%) |
| TOTAL | 39% | 58% | 55% | 64% | 54% |
One of the most impressive trends over the history of this course is the dramatic increase of those believing mourning rituals are "extremely important," from 33% in the 1985-86 classes to 56% in the 1993-94 classes to 70% in the 2005-2007 classes. What factors account for this change? Public exposure to Joseph Campbell's ideas on myth and ritual? Weakening death denials? Successful publicity from the National Funeral Directors Association?
How do you feel about "lying in state" in an open casket at your funeral? Approve; don't care one way or the other; disapprove; strongly disapprove.
|
% DISAPPROVING |
|||||
| 1985-1990 | 1991-1995 | 1996-2000 | 2002-2007 | TOTAL | |
| MALE | 57% | 40% | 23% | 40% | (41%) |
| FEMALE | 55% | 51% | 42% | 47% | (49%) |
| TOTAL | 56% | 47% | 34% | 46% | 47% |
In light of the growing sense of importance of mourning ritual we saw above, this impressive decline and then rebound in the percentage of students disapproving of personally being displayed in an open casket is interesting, with the greater change occurring among males. As discussed elsewhere," the embalmed body is the cornerstone of the modern funeral industry.
Assuming that there has been an increase in the amount of concern with death in the U.S. in the last 25 or 50 years, to what principally do you attribute this change? When students were asked which of the following most influenced their current death orientations to their own deaths, we see over time:
| 1985-88 | 1990-94 | 1995-99 | 2000-04 | TOTAL | |
| WARS | 6% | 7% | 5% | 18% | 53 (9%) |
| VIOLENCE | 10% | 9% | 6% | 6% | 44 (8%) |
| POLLUTION | 6% | 8% | 2% | 3% | 29 (5%) |
| NUKES | 17% | 3% | 2% | 3% | 36 (6%) |
| PHILOSOPHY | 21% | 25% | 21% | 17% | 120 (21%) |
| HEALTH CHANGES | 9% | 17% | 20% | 24% | 101 (18%) |
| TV | 8% | 11% | 27% | 15% | 88 (15%) |
| POVERTY | 1% | 2% | 2% | 3% | 12 (2%) |
| OTHER | 20% | 18% | 15% | 12% | 92 (16%) |
| TOTAL | 100% | 100% | 100% | 100% | 575 |
Here we can see the rapid dissipation of nuclear war concerns with the ending of the Cold War. Over the four time periods, there was a sharp jump in television attributions and changes in personal health. In 2002, not surprisingly in the wake of 9-11, war had jumped to 29% (up from 3% in the 1999-2000 period) while television and philosophy dropped to 12%.
If you have any comments on, questions, or responses to this page, please submit below and include your name and e-mail address.
![]()
