More Than 700 Illustrations of Critical
Thinking
How to Mislead With Statistics: Let
Me Illustrate the Ways
Bob Jensen
at Trinity University
Concept Knowledge and Critical Thinking Should Be a Major
Mission of Education ---
http://faculty.trinity.edu/rjensen/assess.htm#ConceptKnowledge
Bob Jensen's threads on Data Visualization ---
http://faculty.trinity.edu/rjensen/352wpvisual/000datavisualization.htm
Animated Visualization of the United States’ Exploding Population Growth
Over 200 Years (1790 – 2010) ---
A Visualization of the United States’ Exploding Population Growth Over 200 Years
(1790 – 2010)
USA Debt Clock
--- http://www.usdebtclock.org/ ubl
In September 2017 the USA National Debt exceeded $20 trillion for the first time
---
http://www.statedatalab.org/news/detail/national-debt-surpasses-20-trillion-for-the-first-time-in-us-history
Human Population Over Time on Earth ---
https://www.youtube.com/watch?v=PUwmA3Q0_OE
What are the most important statistical ideas of the past 50 years? ---
https://marginalrevolution.com/marginalrevolution/2021/02/what-are-the-most-important-statistical-ideas-of-the-past-50-years.html
Table of Contents (some modules are listed in more than one
category)
Statistical Fallacies
Big Deal Issues Important for Students to Debate
(including research replication and analysis bias)
Misleading Distortions (including cherry
picking and outliers and
denominator effects in proportions, intensity issues, misuse of the word
"proved," lack of robustness, and faked data)
Incomplete Analysis (including
failure to report variances and skewness (kutosis), black swans, and
unwarranted extrapolations)
Associating Cause With Correlation
Misleading Definitions and Assumptions
(including misleading survey questions and false assumptions of stationarity, robustness,
externalities, and misleading extrapolations)
Small, Large or Otherwise Misleading Samples
(including sampling bias, non-stationarity, misleading statistical inference
for large samples)
Missing Variables and Data
Misleading Rankings
Misleading With Wikipedia
**How to Mislead With Statistics
Statistical Fallacies ---
https://www.geckoboard.com/best-practice/statistical-fallacies/
**How to Mislead With Statistics
We think linearly, in terms of cause and effect, but the fact is that we live
in a complex system – a system with many interacting agents, whose collective
behaviour is usually hard to predict ---
https://aeon.co/essays/complex-systems-science-allows-us-to-see-new-paths-forward
How to Try Not to Mislead With Statistics
And The Award For Worst Career After An Oscar Win Goes To ---
http://fivethirtyeight.com/features/and-the-award-for-worst-career-after-an-oscar-win-goes-to/
Jensen Comment
This is an interesting article from the standpoint of going to considerable
lengths to avoid misleading statistics.
The Data Detective: Ten Easy Rules to Make Sense of Statistics ---
https://marginalrevolution.com/marginalrevolution/2021/01/the-data-detective-ten-easy-rules-to-make-sense-of-statistics.html
Also see
https://www.amazon.com/Data-Detective-Rules-Sense-Statistics/dp/0593084594/ref=sr_1_2?crid=28EG2H6C3ODWZ&dchild=1&keywords=tim+harford&qid=1610924306&s=books&sprefix=Tim+Har%2Caps%2C191&sr=1-2
**How to Mislead With Statistics
Paradoxes of Probability & Statistical Strangeness
https://scitechdaily.com/paradoxes-of-probability-statistical-strangeness/?fbclid=IwAR3JlsjucUeAQg8LeYTFvSoGJcFWpovSvr3gnB4CM99Ekihr-_FTuXlTQOo
Thank you Jagdish Gangolly for the heads up
Simpson's Paradox
Base Rate Fallacy
Will Rogers Paradox
Berkson's Paradox
Multiple Comparisons Fallacy
Which economic methods are
in practice statistically more honest than others?
https://marginalrevolution.com/marginalrevolution/2020/09/which-economic-methods-are-in-practice-statistically-more-honest-than-others.html
… our
results suggest that the [instrumental variables] and, to a lesser extent,
[difference-in-difference] research bodies have substantially more p-hacking
and/or selective publication than those based on [randomized controlled
trials] and [regression-discontinuity]…
How to Be a Statistical
Detective: You Do Not Have to Be a Statistics Expert ---
https://onlinelibrary.wiley.com/doi/abs/10.1002/pmrj.12305
Jensen Comment
Although you don't have to be a statistics expert, you do have to know something
about definitions and underlying assumptions. One of the most important thing to
be aware of is the concept of "robustness" ---
https://en.wikipedia.org/wiki/Robust_statistics
Robustness often deals with the relevance of a finding in terms of its
underlying assumptions. Robust findings usually allow for rather generous
violations of underlying assumptions. For example, capital markets studies in
finance often assume markets are efficient in terms of impounding events
instantly into price changes. Markets are almost never perfectly efficient, but
some capital markets studies are more robust than others in terms of how the
findings hold up in terms of market inefficiencies.
Another statistical assumption
that is often violated in randomness. For example, does every member of a
statistical population have an equal chance of being selected in a sample. The
classical example of violations of randomness is in opinion polling where
something prevents random selection. When teaching sampling a common example is
the political polling by by telephone in the days when a lot of voters did not
have telephones ---
https://en.wikipedia.org/wiki/Opinion_poll
Another thing to be keenly
aware of is how outliers might impact findings. For example outliers can impact
both reporting of means and medians, but medians are often less sensitive to a
small number of outliers. Modes are not sensitive to outliers, but they have
severe problems as measures of central tendency such as when distributions are
bimodal.
The main problem I find in
reporting statistical findings is failure to report distributional outcomes such
as when means are reported without graphical displays of the distributions of
outcomes. For example, when reporting average (mean or median) salaries of
college graduates the distributions are often very skewed by having a rather
large number of graduates who choose not earn any salary or a very low part-time
salary because of becoming new parents or choosing to take some time off from
working after graduation. Also some people fall into abnormally high salaries
after graduating such as graduates who become instant CEOs in a family business.
Over 500 Examples of Critical Thinking and Illustrations of How to Mislead
With Statistics ---
See below
Statistical Fallacies ---
https://www.geckoboard.com/best-practice/statistical-fallacies/
Tim Harford: How to Make the World Add Up
Ten Rules for Thinking Differently About Numbers
https://www.amazon.com/How-Make-World-Add-Up/dp/1408712237/ref=sr_1_1?dchild=1&keywords=how+to+make+the+world+add+up&qid=1600435042&sr=8-1/marginalrevol-20
The Argumentation Toolkit (evidence in science) ---
www.argumentationtoolkit.org
Masked by Trust: Bias in
Library Discovery ---
https://works.bepress.com/mreidsma/5/
The
rise of Google and its integration into nearly every aspect of our lives has
pushed libraries to adopt similar "Google-like" search tools, called
discovery systems. Because these tools are provided by libraries and search
scholarly materials rather than the open web, we often assume they are more
"accurate" or "reliable" than their general-purpose peers like Google or
Bing. But discovery systems are still software written by people with
prejudices and biases, library software vendors are subject to strong
commercial pressures that are often hidden behind diffuse
collection-development contracts and layers of administration, and they
struggle to integrate content from thousands of different vendors and their
collective disregard for consistent metadata.
Library discovery systems struggle with accuracy, relevance, and human
biases, and these shortcomings have the potential to shape the academic
research and worldviews of the students and faculty who rely on them. While
human bias, commercial interests, and problematic metadata have long
affected researchers' access to information, algorithms in library discovery
systems increase the scale of the negative effects on users, while libraries
continue to promote their "objective" and "neutral" search tools.
Bob Jensen's threads on bias in
academe ---
http://faculty.trinity.edu/rjensen/HigherEdControversies2.htm#PoliticalCorrectness
Over 700 examples of how to
mislead with statistics ---
Scroll Down
**How to Mislead With
Statistics
The Consumer Price Index Is Not Economic Reality ---
https://www.bloomberg.com/opinion/articles/2021-04-13/consumer-price-index-cpi-history-is-surprisingly-political
**How to Mislead Without Evidence
Michael Bloomberg's Claim About 'Children'
Killed by 'Gun Violence' Is Off by 73% ---
https://reason.com/2020/02/02/michael-bloombergs-claim-about-children-killed-by-gun-violence-is-off-by-73/
It appears that Bloomberg's claim is an outright lie.
**How to Mislead With Statistics:
'Big 4' salaries, revealed: How much Deloitte, KPMG, EY, and PwC
accountants and consultants make, from entry level to executive roles ---
https://www.businessinsider.com/salary-of-consultants-accountants-big-4-deloitte-kpmg-ey-pwc-2020-7?nr_email_referer=1&utm_source=Sailthru&utm_medium=email&utm_content=Business_Insider_select&pt=385758&ct=Sailthru_BI_Newsletters&mt=8&utm_campaign=Insider%20Select%202021-01-06&utm_term=INSIDER%20SELECT%20-%20ENGAGED%2C%20ACTIVE%2C%20PASSIVE%2C%20DISENGAGED%2C%20NEW
-
In 2019, the so called
"Big Four" accounting firms — PricewaterhouseCoopers (PwC), KPMG,
Ernst & Young (EY), and Deloitte — employed well
over a million people.
-
These firms are known
for paying employees six-figure salaries right out of business
school.
-
To figure out how much
accountants and consultants make at these firms, Business Insider
analyzed the US
Office of Foreign Labor Certification's 2020 disclosure data for
permanent and temporary foreign workers.
-
For example, some
analysts and auditors made more than $120,000 at Ernst & Young (EY),
principals were given up to $950,000 in compensation at KPMG, and
managers at PwC made $123,019 or more.
The so called "Big
Four" accounting firms — PricewaterhouseCoopers (PwC), KPMG, Ernst & Young (EY),
and Deloitte — are known for paying their staff high salaries.
In 2019, the four firms combined employed well
over a million people worldwide. New
hires typically earn six-figure salaries from the get-go. An entry-level
consultant who just graduated from business school can make more
than $200,000 a year at the four firms when
you include base salary, bonuses, and relocation expenses.
The Big Four firms are planning to hire in 2021. A
spokeswoman at PwC previously told Insider that the firm typically brings in
13,000 entry-level and experienced employees on a yearly basis, and its
hiring volume for interns and full-time workers will be similar this year.
Deloitte and EY are both planning to expand
their workforces in India.
Insider analyzed the US
Office of Foreign Labor Certification's 2020 disclosure data for
permanent and temporary foreign workers to find out what PwC, KPMG, EY, and
Deloitte paid employees for jobs ranging from entry-level to executive
roles. The salary data analyzed were based across the US.
We looked through entries specifically for
roles related to management consulting and accounting. Performance bonuses,
signing bonuses, and compensation other than base salaries are not reflected
in this data.
Here's how much PwC, KPMG, EY, and Deloitte
paid their hires last year.
Deloitte is organized
into three main service areas that offer
different salaries. These areas include the human capital division, the
strategy and operations division, and the technology division. Deloitte had
the greatest
number of employees, topping
312,028 in 2019, according
to research platform Statista.
It also applied for the greatest number of
visas compared to other leading consultancies. The company applied for 7,444
visas in the last half of 2019 and the first half of 2020. Deloitte did not
immediately respond to a request for comment on the salary data.
Deloitte delayed many of its full-time hires' start
dates, shortened internship programs for students, and laid off 5,000
US workers and 200
people in Canada in response to the
coronavirus pandemic.
Here are the salary ranges for consulting and
accounting roles:
-
Analyst: $58,261
to $116,500 (includes analysts specialized in business, human capital,
project delivery, and solutions)
-
Consultant:
$91,000 to $122,100
-
Senior consultant: $81,167
to $118,384
-
Manager: $107,640
to $160,480
-
Senior manager: $187,253
-
Consulting managing
director: $191,300
-
Audit and assurance
assistant: $58,822
-
Tax consultant: $47,570
to $55,195
-
Tax senior
manager: $124,909
Continued in article
Jensen Comment
Averages almost always are misleading without knowing standard deviations and
skewness. The most misleading part of this is differences in cost of
living. A $125,000 salary does not go far in San Francisco, London, or anywhere
in Switzerland. It goes quite a ways in Des Moines, San Antonio, and
Tallahassee.
My advice to my graduate students about to go to work full time was to almost
ignore starting salaries and look at the more important aspects of the first
job, including training, type of experiences, direct contact with clients, etc.
Especially important was and still is the type of training and experience. One
of my best graduating students in the specialty of accounting for financial
derivatives and hedging activities went with the Big Four that promised to let
him work mostly for a client in Houston having billions or dollars in derivative
contracts. In short time that student became a genuine expert on FAS 133 and
IFRS 39 to a point that in about six years he took on a new job as a financial
executive with Microsoft. Guess why Microsoft needed him?
One of my students who spoke Russian went with a firm that would send him to
Moscow. By doing so he was offered a partnership in a Big Four firm in what I
consider to almost be record time relative to his classmates that went with the
Big Four in the USA.
Sometimes my students complained that auditing and tax graduates are offered
less from the large accounting firms relative new graduates in engineering. I
consoled them by saying that accounting can often be a faster track to the
executive suite, especially the executive suite in finance and accounting.
Corporations often hire very few, if any, new (entry-level) graduates in
accounting. But they make very good deals with accountants who have become
specialized (think derivatives accounting, insurance accounting, lease
accounting, SEC accounting, etc.) after a few years of working for large
accounting firms.
There's also another aspect of high paying jobs to consider. Consultants in
the Big Four often start at higher salaries, but they are constantly living
under pressures to obtain new clients. Audit and tax clients, on the other hand,
tend to be the same clients year after year. For example, KPMG audited GE for
over 100 years before finally losing GE as an audit client. In comparison, KPMG
consultants had to keep competing for new consulting contracts year after year.
It can be very tedious writing consulting proposals year after year after year.
Another thing to contemplate when offered what seems like a huge starting
salary. The thing to ask is how much of that salary is based upon commissions
that create a lot of tensions on the job, especially when there is stiff
competition coming from other consulting firms writing proposals.
**How to Mislead With
Statistics
Evanston bookstore owner
suing Amazon over alleged price-fixing scheme that makes it impossible for other
retailers to compete ---
https://chicago.suntimes.com/business/2021/3/29/22357482/evanston-bookstore-owner-suing-amazon-price-fixing-scheme-compete
An Evanston bookstore owner wants to take on Amazon.
Nina Barrett, owner of Bookends and Beginnings, signed on as the named
plaintiff in a class-action lawsuit filed last week that accuses Amazon of
orchestrating a price-fixing scheme with the nation’s leading book
publishers that makes it impossible for other retailers to beat their
prices.
According to the suit, contracts that Amazon has with the nation’s “Big
Five” publishers — Penguin Random House, HarperCollins, Hachette, Macmillan
and Simon & Schuster — block the
publishers from giving other retailers better prices.
“I, along with most independent bookstore owners in America, feel incredibly
frustrated because we’ve seen that the playing field is not level,” Barrett
told the Sun-Times. “We have to talk to our customers all the time about why
we can’t match Amazon’s pricing.”
Continued in article
How to Mislead With Statistics
Evanston bookstore owner
suing Amazon over alleged price-fixing scheme that makes it impossible for other
retailers to compete ---
https://chicago.suntimes.com/business/2021/3/29/22357482/evanston-bookstore-owner-suing-amazon-price-fixing-scheme-compete
An Evanston bookstore owner wants to take on Amazon.
Nina Barrett, owner of Bookends and Beginnings, signed on as the named
plaintiff in a class-action lawsuit filed last week that accuses Amazon of
orchestrating a price-fixing scheme with the nation’s leading book
publishers that makes it impossible for other retailers to beat their
prices.
According to the suit, contracts that Amazon has with the nation’s “Big
Five” publishers — Penguin Random House, HarperCollins, Hachette, Macmillan
and Simon & Schuster — block the
publishers from giving other retailers better prices.
“I, along with most independent bookstore owners in America, feel incredibly
frustrated because we’ve seen that the playing field is not level,” Barrett
told the Sun-Times. “We have to talk to our customers all the time about why
we can’t match Amazon’s pricing.”
Continued in article
Jensen Comment
Giving bookstores lower purchase prices than online vendors (think Amazon)
forces publishers to share in the cost of bookstore services that most book
buyers don't want to pay for in higher prices for books in local bookstores.
These include the typical "middle man" services of wholesalers that many product
lines have been eliminating in this era of technology.
My neighbor in San Antonio
for years had a wholesaling company that had exclusive rights for distributing
some name brands (think Heinz) to all San Antonio area retailers. This gave him
and his family a very comfortable living for many years, but one has to think
that in modern times Heinz could probably sell their brands directly to San
Antonio retailers at lower prices. My point is that this is somewhat analogous
to how Amazon can sell books worldwide online with lower profit margins per book
in what accountants call cost-profit-volume (CPV) analysis.
There's no doubt that local
bookstores provide services that Amazon online cannot provide. For one thing,
there's entertainment and serendipity advantages of customer browsing in
bookstores. I love physical, especially in my favorite multi-story bookstore in
Denver that has comfortable chairs among their book shelves. The problem is that
these days not enough customers are willing to pay extra for the browsing
services. The typical customer might browse in a bookstore, find books to
purchase, and then go home and place an order with Amazon at lower prices.
There's also value when
bookstore vendors have wide knowledge of related books. A customer might rave
over a recent book she or he read and then ask a bookstore vendor: "Are their
similar books to this marvelous book?"
Some bookstores may provide
tea, wine, and treats to browsers.
It's a little like the
transition from full service (check the tire pressure, check the oil, and wash
the windshield) gasoline stations of my youth to no service (my current local
self service station having zero attendants) gasoline station in Franconia, NH
in my retirement. If given a choice, most drivers prefer not to pay extra for
fuel accompanied by full services.
If publishers sold books to
Amazon for higher prices than to bookstores it would be a little like refiners
selling fuel for less to full service filling stations. Customers would end up
paying higher prices for fuel whether they buy from full service or self-service
filling stations. The bottom line
is that retail customers would be paying for services that most (not all) do not
want to pay for when having no choice but to pay the higher prices.
In other words, Amazon would have to charge more to recover the higher price
Amazon pays for books. Bookstores would not charge less than Amazon, because of
higher overhead and lower volume. Both Amazon and a bookstore might charge about
the same price, a price that's higher than Amazon currently charges for books
because of lower overhead.
**Now to Mislead
With Statistics
Modeling Skewness Determinants in Accounting Research
SSRN
https://papers.ssrn.com/sol3/papers.cfm?abstract_id=3740197
60 Pages Posted:
6 Feb 2021
Temple University - Department of Accounting
Temple University - Fox School of Business and Management - Department of
Accounting
Date Written: November 30, 2020
Abstract
Skewness-based proxies are widely used in accounting and
finance research. To study how the skewness of a dependent variable Y varies
with conditioning variables X, researchers typically compute firm-specific
skewness measures over a short rolling window and regress them on X.
However, we show that this standard approach can cause severe biases and
produce false findings of both conditional skewness on average and
systematic variation in conditional skewness. These biases generalize beyond
rolling-window skewness. We develop alternative methods that address these
biases by directly modeling the conditional skewness of Y for each
observation as a function of X. Simulations confirm that our methods have
good type-I errors and test power even in scenarios in which the standard
method is severely biased. Our methods are transparent, robust, and can be
implemented in a few lines of code. Use of our methods changes a major prior
finding.
Keywords: Pearson’s
moment coefficient of skewness, quantile-based skewness, rolling window,
conditional distribution, generalized method of moments (GMM)
JEL Classification: M41,
C20, C25
Suggested Citation:
**How to Mislead With
Statistics
What Do Happiness Data Mean?
Theory and Survey Evidence—Dan Benjamin, Jakina Debnam Guzman, Marc Fleurbaey,
Ori Heffetz and Miles Kimball ---
https://blog.supplysideliberal.com/post/2021/2/11/what-do-happiness-data-mean-theory-and-survey-evidencedan-benjamin-jakina-debnam-guzman-ori-heffetz-marc-fleurbaey-and-miles-kimb
**How to Mislead With Statistics
Freedom from Fossil Fuels is Good for Your Health ---
https://www.nakedcapitalism.com/2020/02/freedom-from-fossil-fuels-is-good-for-your-health.html
Jensen Comment
This is a very superficial article that mentions many of the benefits of a world
without fossil fuels. It totally ignores the costs and risks. For example, is
starvation good for health? We don't really know how loss of fossil fuels (think
farm machinery) and petrochemicals will affect food production for over seven
billion people worldwide, but there are a huge degrees of agricultural
productivities and efficiencies that might be adversely affected by abrupt shut
down of fossil fuels. Then there's the global distribution of food that
currently relies upon fossil fuels from cargo ships to fleets of trucks between
farms and markets around the world.
Certainly there are positives about eliminating fossil fuels from heating our
homes, cooling our homes, and transporting us to jobs and other places we want
to travel. But are there no negatives in the alternatives to replacing fossil
fuels? For example, there are tremendous environmental problems with all the
battery production needed to accompany solar and wind electricity production.
Petrochemicals are now essential in the production of vital medicines.
Realistically, nuclear energy is about the only known solution to the massive
shortage of power lost with the elimination of fossil fuels. Nuclear energy is
getting safer and more economically feasible, but the cost for seven billion
people on earth will still be tremendous and require great economic sacrifices
on nations trying to do without fossil fuels.
Certainly one day in the future fossil fuels will no longer be necessary (or
even available) for any life that remains on earth. However, articles on ending
reliance upon fossil fuels must consider the advantages and disadvantages of
living without fossil fuels and why it will take so long to do so ---
https://www.bartleby.com/topics/Essay-on-Fossil-Fuels
Certainly our politicians are not doing us big favors by ignoring (think
Trump) the carbonization problem or by making decarbonization political
promises that are absurd.
MIT: Pete Buttigieg’s $2 trillion climate plan is
infeasible, but less so than most ---
https://www.technologyreview.com/s/615265/pete-buttigieg-2-trillion-climate-plan-is-infeasible-but-less-so-than-most/
MIT on Promises That are Literally Impossible to Keep: Elizabeth Warren
has a ($3 trillion) climate change plan ---
https://www.technologyreview.com/s/615212/climate-change-elizabeth-warren-has-a-3-trillion-plan-for-that/
Much depends upon future research discoveries that are hard to predict in terms
of types and timing (think flow batteries) ---
https://www.computerworld.com/article/2918235/can-elon-musks-battery-really-cut-your-power-lines.html
Petrochemicals ---
https://en.wikipedia.org/wiki/Petrochemical
Examples of Petrochemicals and Petroleum Products (think medicines and food)
---
https://www.thoughtco.com/petrochemicals-and-petroleum-products-603558
**How to Mislead With
Statistics
Research: Women Are Better
Leaders During a Crisis ---
https://hbr.org/2020/12/research-women-are-better-leaders-during-a-crisis?utm_medium=email&utm_source=newsletter_weekly&utm_campaign=weeklyhotlist_not_activesubs&deliveryName=DM113092
Jensen Comment
Firstly, I wonder if this study would have been published by Harvard if the data
revealed men are better leaders in a crisis. In this era I doubt it.
Irrespective of how the survey
data turned out, I don't like comparing opinion poll averages of gender
differences in leadership "during a crisis." Crises are highly specific events
in specific circumstances. They vary from such extremes as a local crisis (think
of someone passing out in a presidential cabinet meeting) to very global crisis
(think of missiles sinking of a USA aircraft carrier in the China Sea or Persian
Gulf). I think gender differences are negligible compared with a person's unique
history, training, experience, personality, data understanding, etc. in a
particular crisis at a particular time.
We're not dealing with fungible items in stationary processes with most types of
"crises."
The study is not restricted to
a particular types of crises such as when pilots experience engine failures in
fighter aircraft. The study refers to any type of crisis, and I think the survey
outcomes are garbage with respect to leadership in every type of crisis in every
type of circumstance. There are instances where a particular leader, man or
woman, can step up to the plate like a rather lousy leader in many respects
named Winston Churchill stepped forward marvelously when Hitler was on the verge
of taking over all of Europe.
Of course there are types of
crises were gender might be an important element of leadership, but there are
certainly many other types of crises where gender is probably irrelevant among
all the most important factors affecting great leadership at the moment.
**How to Mislead Without Statistics
With Centuries-Old Techniques, This Farm Is Preparing for the Future No
modern methods or machinery required — just crops cultivated by hand in
incredible, climate-proof quantities ---
https://reasonstobecheerful.world/permaculture-bec-hellouin-farm-france/
. . .
There is no tractor or plow in this place of constant
growth. The farmers do not use fossil fuels, nor artificial fertilizers and
pesticides. The manual work saves costs and reduces their carbon footprint.
But there is also another reason. A tractor designed for modern farming
could not plant more than three rows of carrots on the barely one-meter-wide
strips utilized by this farm. At Bec Hellouin, four times that density of
crops is grown in that amount of soil. “We cultivate radishes, carrots,
lettuce and cabbage in 12 rows on this space,” says Charles.
Continued in article
Jensen Comment
Much can be said for the above ventures into farming on land not amenable to
mechanized large-scale food production. But we should not extrapolate this
article to world production of grains (corn, soybean, and wheat)
production from giant farms in the USA's Midwest or the mechanized vegetable
production in California where my son is connected by marriage to a 5,000 acres
of rice and tomato farm using enormous Caterpillar tractors, giant combines,
etc. Yes you can now plant and harvest rice and tomatoes with robotic tractors,
combines, and trucks. The produce is untouched by human hands. The trucks taking
harvests to processing mills could even be driverless if the laws permitted such
deliveries without drivers.
The modern world with over seven billion hungry people cannot and will not
return to farming without machines --- big and better machines. What the above
article fails to compare is the productivity of our present mechanized farms
with productivity of what they would become today if we banned the machinery and
chemicals of farming. We can now longer
feed the world with hunting, gathering, and non-mechanized organic farms and
food factories.
I'm reminded of the following remarks of Milton Friedman about the lesson of
spoons.
Milton Friedman: The Lesson of the
Spoons ---
https://marginalrevolution.com/marginalrevolution/2019/08/spoons-are-in-aisle-9.html
Chopsticks would be even better than spoons in providing more and more workers
with tools to move the earth.
**How to Mislead With Quotations
College is "not for learning" and "basically
for fun."
Elon Musk
Elon Musk said a college degree isn't required for a job at Tesla —
and Apple, Google, and Netflix don't require employees to have 4-year degrees
either ---
https://www.businessinsider.com/top-companies-are-hiring-more-candidates-without-a-4-year-degree-2019-4?utm_source=Sailthru&utm_medium=email&utm_content=BIPrime_select&utm_campaign=BI%20Prime%202020-03-11&utm_term=BI%20Prime%20Select
Jensen Comment
But what proportion of
professional employees (computer scientists, engineers, accountants, lawyers,
nurses, financial analysts, etc.) have college degrees?
My guess is over
99%.
Some professionals must have college degrees (maybe even advanced
degrees just to be licensed). For example CPAs and lawyers cannot be licensed
without advanced degrees.
Prodigies hired without college degrees are few
and far between, although there are interesting stories about Harvey Firestone,
Bill Gates, and others who became wealthy CEOs without diplomas on the wall. You
don't have to have a diploma to lead a company, but that company is not going to
hire a notable proportion of professionals without college diplomas.
I hate it when Elon Musk encourages students to
party it up in college rather than make the primary goals learning and completion
of one or more degree programs.
**How to Mislead With Statistics (by avoiding key variables)
Are Home Prices in Black Neighborhoods Underpriced? ---
https://www.thestreet.com/mishtalk/economics/are-home-prices-in-black-neighborhoods-underpriced
Jensen Comment
Read the article for examples of how the statistics are misleading in this
study. However, the article misses several main points. Firstly, it does not
mention crime statistics for black neighborhoods. Secondly, it does not mention
that many black neighborhoods like those in Chicago are centers for dangerous
gangs and gang warfare. Thirdly, I don't know how an analyst makes adjustments
for public education troubles and "walkability" troubles for whites in most
black neighborhoods.
And there are some seemingly little things that are not so little in terms of
real estate value. Because many prosecutors are not discouraging shoplifting
crime in low income neighborhoods (think of Los Angeles that no longer
prosecutes teenage misdemeanors) retail businesses like supermarkets and big box
stores are avoiding low income neighborhoods. This in turn, affects real estate
values, since shopping is no longer convenient in those neighborhoods. There are
other inconveniences such as having worse taxi pickup services in high crime
neighborhoods.
From David Giles on Econometrics ---
https://davegiles.blogspot.com/2019/08/book-series-on-statistical-reasoning-in.html
David has retired from updating this wonderful blog
Book
Series on "Statistical Reasoning in Science & Society"
Back in
early 2016, the American
Statistical Association (ASA) made an announcement in
its newsletter, Amstat
News, about the introduction of an important new series of
books. In part, that announcement said:
"The
American Statistical Association recently partnered with Chapman
& Hall/CRC Press to launch a book series called the ASA-CRC Series
on Statistical Reasoning in Science and Society.
'The ASA
is very enthusiastic about this new series,' said 2015 ASA President David
Morganstein, under whose leadership the arrangement was made. 'Our strategic
plan includes increasing the visibility of our profession. One way to do
that is with books that are readable, exciting, and serve a broad audience
having a minimal background in mathematics or statistics.'
The
Chapman & Hall/CRC press release states the book series will do the
following:
·
Highlight the
important role of statistical and probabilistic reasoning in many areas
·
Require minimal
background in mathematics and statistics
·
Serve a broad
audience, including professionals across many fields, the general public,
and students in high schools and colleges
·
Cover statistics in
wide-ranging aspects of professional and everyday life, including the media,
science, health, society, politics, law, education, sports, finance,
climate, and national security
·
Feature short,
inexpensive books of 100–150 pages that can be written and read in a
reasonable amount of time."
Seven
titles have now been published in this series -
Measuring Society,
by Chaitra H. Nagaraja (2019)
Measuring Crime: Behind the Statistics, by Sharon L. Lohr (2019)
Statistics and Health Care Fraud: How to Save Billions, by Tahir Ekin
(2019)
Improving Your NCAA® Bracket with Statistics, by Tom Adams (2018)
Data Visualization: Charts, Maps, and Interactive Graphics, by Robert
Grant (2018)
Visualizing Baseball, by Jim Albert (2017)
Errors, Blunders, and Lies: How to Tell the Difference, by David S.
Salsburg (2017)
Readers
of this blog should be especially interested in Chaitra Nagaraja's recently
published additionto this series. Chaitra devotes
chapters in her book to the topics of Jobs, Inequality, Housing, Prices,
Poverty, and Deprivation. I particularly like the historical perspective
that Chaitra provides in this very readable contribution, and I recommend
her book to you (and your non-economist friends).
Type 1 (Alpha) and Type 2 (Beta) Errors in Statistical Inference ---
https://en.wikipedia.org/wiki/Type_I_and_type_II_errors#Type_II_error
Why is Type 2 error seldom computed in practice?
The probability of a Type II Error cannot generally be computed because it
depends on the population mean which is unknown. It can be computed at, however,
for given values of µ, 2 σ , and n .
https://www.ssc.wisc.edu/~gwallace/PA_818/Resources/Type%20II%20Error%20and%20Power%20Calculations.pdf
Engineers frequently are able to construct Operating Characteristic (C) curves
for routine tests in quality control ---
https://www.businessmanagementideas.com/production-management/operating-characteristic-o-c-curves/6960
Jensen Comment
I don't know of a single accounting research study or auditing firm that has
ever measured Type 2 error other than on hypothetical data. I also have never
heard of a study in economics and finance that measured Type 2 error.
However, when I took Engineering Statistics 100 years ago we derived OC curves
from real world quality control and vehicle traffic data using known means and
variances.
There are numerous tutorials on how to compute Type II error with known means
and variances. One of the more popular is provided by the Khan Academy ---
https://www.khanacademy.org/math/ap-statistics/tests-significance-ap/error-probabilities-power/v/introduction-to-type-i-and-type-ii-errors
**How to Mislead With
Statistics
New York algebra fact of the
day ---
https://marginalrevolution.com/marginalrevolution/2020/06/new-york-fact-of-the-day-2.html
Take
here in New York, where in 2016 the passing rate for the Regents Examination
in Algebra I test was 72 percent. Unfortunately, this (relatively) higher
rate of success does not indicate some sort of revolutionary pedagogy on the
part of New York state educators. As the New York Post complained in 2017,
passing rates were so high in large measure because the cutoff for passing
was absurdly low — so low that students needed only to answer 31.4 percent
of the questions correctly to pass the 2017 exam.
Walter A. Williams: The Nation's Report Card
How are K-12 schools doing under President Trump versus
President Obama?
https://townhall.com/columnists/walterewilliams/2020/05/06/the-nations-report-card-n2568167?utm_source=thdaily&utm_medium=email&utm_campaign=nl&newsletterad=05/06/2020&bcid=b16c6f948f297f77432f990d4411617f&recip=17935167
Jensen's Comment
Most K-12 schools were probably doing better when I was a child than they're
doing today. The downhill slide is greatest in the gang-ridden schools,
drug-infested urban schools like Chicago and New Orleans. Throwing money at such
schools is not the answer until life at home recovers. Finland
knows this, which is why Finland's dads spend more time with school children
than the moms or the teachers.
https://www.theguardian.com/lifeandstyle/2017/dec/04/finland-only-country-world-dad-more-time-kids-moms
The New Yorker: What Statistics Can't Tell Us About Ourselves ---
https://www.newyorker.com/magazine/2019/09/09/what-statistics-can-and-cant-tell-us-about-ourselves
Thank you Denny Beresford for the heads up!
If the end brings me out all right, what is said
against me won’t amount to anything. If the end brings me out wrong, ten angels
swearing I was right would make no difference.
Lincoln on How to Handle Criticism ---
https://www.brainpickings.org/2019/03/27/abraham-lincoln-criticism/?mc_cid=855d203b71&mc_eid=4d2bd13843
Skepticism 101 ---
http://www.skeptic.com/skepticism-101
**How to Mislead With Statistics (spurious
correlations) ---
https://reason.com/archives/2015/12/04/did-california-prop-47-cause-state-crime
Unprofessional
Journalism: The Mueller Report ---
https://twitter.com/moorehn/status/1154558852043591681
How to Mislead With Statistics
Anaesthetist John Carlisle has spotted problems in hundreds of research papers —
and spurred a leading medical journal to change its practice ---
https://www.nature.com/articles/d41586-019-02241-z
Poroi: Project on Rhetoric of Inquiry ---
https://ir.uiowa.edu/poroi/
Why History Gets Stuff Wrong All the Time ---
https://awealthofcommonsense.com/2019/07/why-history-get-stuff-wrong-all-the-time/
Stanford University: Civic Online Reasoning ---
https://irlpodcast.org/
The Truth About Teacher Pay ---
https://www.nationalaffairs.com/publications/detail/the-truth-about-teacher-pay
Stanford professor who changed America with just one study was also a liar
(cherry picking study outcomes) ---
https://nypost.com/2019/11/02/stanford-professor-who-changed-america-with-just-one-study-was-also-a-liar/?utm_source=pocket-newtab
Big
Data+Small Bias << Small Data+Zero Bias ---
https://marginalrevolution.com/marginalrevolution/2020/01/big-datasmall-bias.html
An Oversimplified, Misleading Argument about Inequality and
Taxes ---
https://www.nationalreview.com/2019/11/book-review-triumph-of-injustice-oversimplified-misleading-arguments-about-inequality-taxe
Chronicle of Higher Education: What College Activists Want?
https://www.chronicle.com/article/What-College-Activists-Want/249184?utm_source=at&utm_medium=en&utm_source=Iterable&utm_medium=email&utm_campaign=campaign_1363707&cid=at&source=ams&sourceId=296279
Defunded police.
Inclusive coursework.
Faculty members who look like them. (including
administrators and coaches.
Students are demanding radical change for racial justice,
and they’re not backing down.
The demand: Sever ties with the police
(except armed Antifa patrols)
The demand: Remove symbols of oppression (including the library's
politically incorrect materials)
The demand: Hire people of color (even if they are less qualified
than others)
The demand: Diversify the curriculum (No
Shakespeare/math/business and more Che Guevara)
Some of the unmentioned demands in the above article
Free tuition, room and board, pot, and booze
Free medical and dental care (including free abortions)
Open admission for for people of color
Only A grades (stop giving mostly A- and B grades)
No examinations, quizzes or grading of term papers
Excuse from class attendance in favor of protesting
Screening of all campus speakers for political correctness (pretty much like
it is now)
No suspensions or dismissals (except in the case of the first signs of
conservatism disease)
Reparations plus guaranteed annual income during and after graduation
Reply from Bob Jensen later in the day
I perhaps exaggerated too much on student demands and tried unsuccessfully
to be somewhat funny. However, I think if I dug deeper I would find where
student groups have made demands of all the the things I mentioned.
I note that the Daily Beast articles almost always promoted a leftist
agenda.
Here are some of the documented demands of students listed by the Daily
Beast (note the ones to get rid of grades, tests, and teachings of all
male poets (including Shakespeare). I also note that some colleges (think
Michigan State) removed mathematics from the core course and skills
requirements:
https://www.thedailybeast.com/the-craziest-demands-of-college-kids-in-2016
**How to MIslead With
Statistics
NBER: Misdemeanor
Prosecution ---
https://www.nber.org/papers/w28600
Communities
across the United States are reconsidering the public safety benefits of
prosecuting nonviolent misdemeanor offenses. So far there has been little
empirical evidence to inform policy in this area. In this paper we report
the first estimates of the causal effects of misdemeanor prosecution on
defendants' subsequent criminal justice involvement. We leverage the as-if
random assignment of nonviolent misdemeanor cases to Assistant District
Attorneys (ADAs) who decide whether a case should move forward with
prosecution in the Suffolk County District Attorney's Office in
Massachusetts. These ADAs vary in the average leniency of their prosecution
decisions. We find that, for the marginal defendant,
nonprosecution of a nonviolent misdemeanor offense leads to large reductions
in the likelihood of a new criminal complaint over the next two years.
These local average treatment effects are largest for first-time defendants,
suggesting that averting initial entry into the criminal justice system has
the greatest benefits. We also present evidence that a recent policy change
in Suffolk County imposing a presumption of nonprosecution for a set of
nonviolent misdemeanor offenses had similar beneficial effects: the
likelihood of future criminal justice involvement fell, with no apparent
increase in local crime rates.
...
We
find that the marginal nonprosecuted misdemeanor defendant is 33 percentage
points less likely to be issued a new criminal complaint within two years
post-arraignment (58% less than the mean for complier" defendants who are
prosecuted; p < 0.01). We find that nonprosecution reduces the likelihood of
a new misdemeanor complaint by 24 percentage points (60%; p < 0.01), and
reduces the likelihood of a new felony complaint by 8 percentage points
(47%; not significant). Nonprosecution reduces the number of subsequent
criminal complaints by 2.1 complaints (69%; p < .01); the number of
subsequent misdemeanor complaints by 1.2 complaints (67%; p < .01), and the
number of subsequent felony complaints by 0.7 complaints (75%; p < .05). We
see significant reductions in subsequent criminal complaints for violent,
disorderly conduct/theft, and motor vehicle offenses.
Jensen Comment
Firstly, if less than half are "less likely" to repeat the offenses what happens
to those that are "more likely" to repeat offenses?
Secondly, there is such a wide
variety of misdemeanor crimes that lumping them together and looking at averages
can be misleading. Examples of misdemeanors include prostitution, drug
possession, non-violent mugging, vandalism, trespassing, public intoxication,
public defecation, reckless driving, indecent exposure, peeking tommery, and
shoplifting. Indeed not prosecuting some of these crimes might lower the odds of
repeating the offense, but I find it hard to believe that not prosecuting for
prostitution and shoplifting is going to lead to a lower likelihood of
prostitution and shoplifting.
Thirdly, not prosecuting some
crimes leads to lowering the possibility of such crimes. For example, if
shoplifting becomes too rampant big box stores (think Walmart and Target) may
either close down or certainly not build new stores in the parts of a community
where shoplifting is more likely. One time I shopped in a convenience
store in downtown Baltimore where customers were not allowed to touch the
merchandise until is was paid for. Clerks behind bulletproof glass retrieved the
merchandise and collected the money before the merchandise was passed in drawers
to customers. The effect of not prosecuting crimes thereby leads to higher
prices of merchandise and/or increased costs of having to travel much further to
shop in stores. More dramatically if
non-violent mugging and panhandling becomes more likely due to non-prosecution
tourists will avoid the high risk areas such that crime statistics go down for
the wrong reasons. Wiill tourists flock to Los Angeles and Portland,
Oregon since these cities no longer prosecute misdemeanors? The only people
flocking to such places may be drug addicts (which is what happened in San
Francisco).
Fourthly, and most importantly,
there may be huge changes in the data being collected. For example, if
misdemeanors are no longer prosecuted after January 1, 2022 it may well be that
victims may no longer report crimes and/or police arrest far fewer criminals
after January 1, 2022 because their arrests will not be prosecuted.
Hence, there may be increases in these
misdemeanors that are no longer getting into the crime database.
Lastly, the use of p-values in
statistical inference has fallen out of favor with the American Statistical
Association because they are too unreliable ---
Time to say goodbye to “statistically significant” and embrace uncertainty,
say statisticians ---
https://retractionwatch.com/2019/03/21/time-to-say-goodbye-to-statistically-significant-and-embrace-uncertainty-say-statisticians/
Three years ago, the American Statistical Association (ASA) expressed hope
that the world would move to a “post-p-value
era.”
The statement in which they made that recommendation has been cited more
than 1,700 times, and apparently, the organization has decided that era’s
time has come. (At least one journal had already banned
p values by 2016.)
In an editorial in
a special
issue of
The American Statistician out today, “Statistical Inference in the 21st
Century: A World Beyond P<0.05,” the executive director of the ASA, Ron
Wasserstein, along with two co-authors, recommends that when it comes to the
term “statistically significant,” “don’t say it and don’t use it.” (More
than 800 researchers signed onto a piece
published in Nature yesterday calling
for the same thing.) We asked Wasserstein’s co-author, Nicole
Lazar of the University of Georgia,
to answer a few questions about the move.
So the ASA wants to
say goodbye to “statistically significant.” Why, and why now?
In the past few years
there has been a growing recognition in the scientific and statistical
communities that the standard ways of performing inference are not serving
us well. This manifests itself in, for instance, the perceived crisis in
science (of reproducibility, of credibility); increased
publicity surrounding bad practices such as p-hacking (manipulating the data
until statistical significance can be achieved); and perverse incentives
especially in the academy that encourage “sexy” headline-grabbing results
that may not have much substance in the long run. None of this is
necessarily new, and indeed there are conversations in the statistics (and
other) literature going back decades calling to abandon the language of
statistical significance. The tone now is different, perhaps because of the
more pervasive sense that what we’ve always done isn’t working, and so the
time seemed opportune to renew the call.
Much of the
editorial is an impassioned plea to embrace uncertainty. Can you explain?
The world is
inherently an uncertain place. Our models of how it works — whether formal
or informal, explicit or implicit — are often only crude approximations of
reality. Likewise, our data about the world are subject to both random and
systematic errors, even when collected with great care. So, our
estimates are often highly uncertain; indeed, the p-value itself is
uncertain. The bright-line thinking that is emblematic of declaring some
results “statistically significant” (p<0.05) and others “not statistically
significant” (p>0.05) obscures that uncertainty, and leads us to believe
that our findings are on more solid ground than they actually are. We think
that the time has come to fully acknowledge these facts and to adjust our
statistical thinking accordingly.
Continued in article
**How to Mislead
With Statistics
Stratified Sampling ---
https://en.wikipedia.org/wiki/Stratified_sampling
Mathematician Gary Cornell argues that current testing procedures won't
tell us much about vaccine efficacy for the elderly because sampling was not
stratified ---
https://garycornell.com/2020/10/22/we-are-unlikely-to-have-a-vaccine-that-is-proven-effective-for-seniors-for-a-long-time-unless-dramatic-action-is-taken-now/
**How to Mislead With Statistics
Statistical Anomalies in Biden Votes, Analyses Indicate ---
https://www.theepochtimes.com/statistical-anomalies-in-biden-votes-analyses-indicate_3570518.html?utm_source=newsnoe&utm_medium=email&utm_campaign=breaking-2020-11-08-5
Jensen Comment
Be aware that the above article is published by a conservative and highly biased
media outlet. In spite of this the article raises some interesting questions
such as Benford's Law commonly used by accountants (think IRS) in search
of fraud in financial data. Benford's Law is also a common component of forensic
accounting education ---
https://www.mentalfloss.com/article/63099/irss-favorite-mathematical-law
I want to claim that I do no support the long delay in the the GOP concession
that Trump lost to Biden. But it is interesting how data analysts are
identifying and analyzing statistical anomalies. Readers can be confused by
false claims of statistical anomalies and true anomalies that are not due to
fraud or error ---
https://www.kdnuggets.com/2020/09/diy-election-fraud-analysis-benfords-law.htm
Having said this I don't think there's probably sufficient evidence to
overthrow the 2020 election results. Investigations of fraud should proceed to
improve the integrity of future elections. But the Biden team should not be
delayed in their efforts to take over the leadership of the USA.
Election fraud analysis becomes increasingly important as the margins of
difference vote counts shrink like they did in the November 2020 election.
Some fraud controls in live voting are lost when votes are accepted by mail. For
example, it's much harder for the dead to show up at the voting centers.
How to Mislead With Statistics
Why Was The National Polling Environment So Off In 2020?
https://fivethirtyeight.com/features/why-was-the-national-polling-environment-so-off-in-2020/
The bottom line is that we really don't know. We have far more excuses than
reasons.
**How to Mislead
With Statistics
Epic miscalls
and landslides unforeseen: The exceptional catalog of polling failure ---
https://theconversation.com/epic-miscalls-and-landslides-unforeseen-the-exceptional-catalog-of-polling-failure-146959
**How to Mislead With Statistics: Failure to Recognize Externalities
Externality ---
https://en.wikipedia.org/wiki/Externality
Boston schools wanted to stagger start times to save on transportation
costs and improve student health. Here's why parents were against it — and what
it can teach us about pandemic planning ---
https://www.businessinsider.com/why-some-boston-parents-were-against-staggered-school-start-times-2020-10
Jensen Comment
The school districts primarily considered parties most directly involved in
start-time decisions --- students, teachers, and taxpayers who pay the
transportation costs. Parents are more indirectly and variably involved. For
example, stay-at-home parents and parents now working remotely in a majority of
homes may be less concerned than working parentshaving to physically commute to
work on tight schedules. Those parents with less scheduling flexibility
became powerful voices in this illustration.
**How to Mislead With Statistics
Paradoxes of Probability & Statistical Strangeness
https://scitechdaily.com/paradoxes-of-probability-statistical-strangeness/?fbclid=IwAR3JlsjucUeAQg8LeYTFvSoGJcFWpovSvr3gnB4CM99Ekihr-_FTuXlTQOo
Thank you Jagdish Gangolly for the heads up
Simpson's Paradox
Base Rate Fallacy
Will Rogers Paradox
Berkson's Paradox
Multiple Comparisons Fallacy
**How to Mislead With
Statistics
Here's how much every US
state (and Washington DC) pays its teachers and how much they spend on each
student ---
Click Here
Rank (Teacher
Salary Average. Spending Per Student)
01 New York ($87,543,
$24,040)
02 California ($84,649,
$12,498)
03 Massachusetts ($83,622 ,$17,058)
04 Washington, DC ($79,350,
$22,759)
05 Connecticut ($78,247,
$20,635)
06 New Jersey ($76,376,
$20,021)
07 Maryland ($73,444,
$14,762)
08 Washington ($72,965,
$12,995)
09 Alaska ($70,877,
$17,726)
10 Pennsylvania ($70,258,
$16,395)
...
42 Indiana ($51,508,
$10,262)
43 South Carolina ($51,485,
$10.856)
44 Missouri ($50,817,
$10,810)
45 Arizona ($50,381,
$8,329)
46 West Virginia ($50,238,
$11,334)
47 Louisiana ($50,217,
$11,452)
48 Arkansas ($49,822,
$10,139)
49 South Dakota ($49,220,
$10,073)
50 Florida ($48,800,
$9,346)
51 Mississippi ($45,192,
$8,935)
Jensen Comment
Broad generalizations are misleading. We might say that it costs about half as
much to live in Mississippi as in New York, but this is not entirely true
because it costs much more than double to live in New York City and much less
than double to live in Poughkeepsie, New York.
One might conclude that
southern states pay teachers a lot less, but why do South Dakota, Indiana, and
Arizona rank down among the low paying southern states? Some southern states
(think Georgia) are not in the bottom 10 in terms of average teacher salaries.
There are all sorts of statistical problems when dealing with average salaries
without considering dispersions around the mean. In New York for example the
salaries highly skewed upward by the immense number New York City high salaries,
These very high average salaries skew the state's mean upwards relative to what
it would be if New York City was taken out of the mean calculation.
There are also statistical
concerns about the spending per student numbers shown above.
There are many factors affecting spending per student. Vermont and Georgia at
ranks 17 and 18 have nearly identical average teacher salaries (about $61,000)
And yet Vermont's spending per student is a whopping $19,340 compared to
Georgia's spending per student at $10,810. This is due mostly to a policy of
allowing miniscule rural towns in Vermont to have their own unconsolidated
school districts. The Vermont joke is that some school districts have more
supervisory board members than the numbers of students in their very rural
schools. The good news is that the student/teacher ratio is very, very low in
Vermont while administrator/student ratios are also very high. This is probably
a very good thing from a pedagogical standpoint but a bad thing from an
accounting standpoint. It cost a lot extra to heat and maintain school buildings
for only a few students.
In Georgia school districts
tend to be more consolidated giving rise to a lower average spending per
student. Vermont could greatly lower its spending per student by consolidating
more districts, but this would also increase the student/teacher ratios and make
students be bussed relatively long distances across mountain passes in the
winter. New Hampshire at rank 19 spends less per student ($16,893) than Vermont
($19,340), but this is due in part to having a population of 1,400,000 compared
to Vermont's sparse 644,000 population over roughly the same land mass and
terrain. New Hampshire has more populated school districts due heavily to having
over twice as many residents in the state. This in turn is due to New
Hampshire's attraction of having no income tax and no sales tax, whereas Vermont
taxes everything it can think of to tax. One thing very high taxes do is keep
the population low.
The above type of reasoning
does not apply to all states. What Mississippi and Florida spend per student is
just plain miserable no matter how you look at it. But look at how much more New
York state spends per student relative to California. Go figure why New York
spends nearly twice as much per student!
My main point is that spending
per student is a very misleading number because there are so many heterogeneous
efficiencies and inefficiencies blended into that one number. In Vermont high
spending per student leads to very small numbers of students per teacher. But in
New York high spending per student is not generally such a good thing for
student/teacher ratios like high spending is in Vermont. Spending per student is
highly skewed by the cost of everything in New York City.
**How to Mislead With
Statistics
Those hidden factors
affecting research outcomes
https://marginalrevolution.com/marginalrevolution/2021/03/testing-todd.html
Researchers make hundreds of decisions about
data collection, preparation, and analysis in their research. We use a
many‐analysts approach to measure the extent and impact of these decisions.
Two published causal empirical results are replicated by seven replicators
each. We find large differences in data preparation and analysis decisions,
many of which would not likely be reported in a publication. No two
replicators reported the same sample size. Statistical significance varied
across replications, and for one of the studies the effect's sign varied as
well. The standard deviation of estimates across replications was 3–4 times
the mean reported standard error.
Jensen Comment
Accounting researchers rarely discover such problems because those researchers
rarely replicate the works of one another.
574 Shields Against Validity Challenges in Plato's Cave ---
http://faculty.trinity.edu/rjensen/TheoryTAR.htm
**How to Mislead With Statistics
Canadian researchers gave $7,500 to people without a home — and the results show
the power of universal basic income ---
https://www.businessinsider.com/canadian-basic-income-experiment-gives-homeless-people-cash-2020-10
. . .
The Foundation for Social Change, a Vancouver-based charity, partnered with
the University of British Columbia to identify 50 people between 19 and 64
years old who had recently become
homeless. The recipients were identified as not having significant
substance abuse or mental health issues.
Researchers studied
their spending habits over
12 months and compared their outcomes to a control group who did not receive
the cash payment.
Those who were
given the cash largely spent the money on food, rent, and transportation and
moved into stable housing faster over the course of the year, according to
the findings.
Spending on
"temptation goods," such as drugs, cigarettes, and alcohol declined by 39%,
on average. And recipients were able to keep an average of $1,000 in
savings, according to Canadian news outlet CBC.
The cash payment saved the shelter system $8,100 per person over the course
of the year, a total savings of $405,000.
Continued in article
Jensen Comment
In fairness the findings report of this study emphasizes that the stipends were
given to only people who recently became homeless (during the Covid-19
pandemic). Without saying so, I think that it's
implied that the findings do not extrapolate well the people who are chronically
homeless due to addictions, mental illness, depression, or lack of motivation to
better themselves.
A recent homeless person could be a hard worker (think a waiter or waitress)
unable to pay rent because of restaurant closures during the pandemic. People
motivated to work are more apt to use the money to find work compared to
hard-core alcoholics unable to think beyond where to get the next bottle of
booze.
The main point is that statistical findings are often difficult to extrapolate
to different people and different circumstance
**How to Mislead With
Statistics
The Gender Gap in Pandemic
Job Losses Has Been Wildly Exaggerated ---
https://reason.com/2021/05/11/the-gender-gap-in-pandemic-job-losses-has-been-wildly-exaggerated/
Jobs data casts doubt on the idea that
the COVID-19 pandemic is uniquely setting women back.
For more than a year, the U.S. has been flooded with
gloomy headlines and dire predictions about
women and work. "The pandemic is
devastating a generation of working women," opined one Washington
Post writer in February. Citing data showing that 2.5 million women
dropped out of the workforce since the COVID-19 pandemic began, Vice
President Kamala Harris said "the
pandemic has put decades of the progress we have collectively made for women
workers at risk."
Harris called it a "national
emergency"—albeit one that could be fixed by greenlighting the Biden
administration's coronavirus spending plan.
And so the narrative typically
goes: women's employment prospects are in
crisis; the way out is passing the Democrats' preferred economic policies. (See
Matt Welch
in Reason's
June print issue for more on this
rhetoric.)
But the magnitude of this gender
gap has never been as great as many
have made it out to be. And recent data cast further doubt on the "she-cession"
narrative. At the end of April 2021, the unemployment rate for women was
slightly lower than the unemployment
rate for men. And the women's labor force participation rate had recovered
more than the men's rate had.
Just How Big Are These Gender Gaps Now?
To read headlines about
gender and job losses, one might get the impression that U.S. women are
faring drastically worse on the
coronavirus-era employment front than men are. Yet such losses have never
been as drastically gendered as many doomsayers let on.
"Labor force participation—defined
as all civilians working full or part time, as well as those who are
unemployed but looking for work—fell dramatically for both genders between
March and April 2020," noted
Gallup. In April 2020, men's labor
force participation was at 97.8 percent of its February 2020 level and
women's labor force participation was 96.9 percent of its February 2020
level—a gender gap of just 0.9* percentage
points.
he labor force
participation rate is a separate measure than the unemployment rate, which
is concerned with how many people are out of work and actively seeking a
job. On unemployment, U.S. women are also faring better than their
male counterparts (though "better" here does come with some caveats, since
unemployment numbers don't include people out of a job and not seeking a new
one).
In April
2021,
the unemployment rate for U.S. men ages 20 and older was at 6.1 percent, down
7 percentage points from its April 2020 peak.
For women ages 20 and older, it was at 5.6 percent—down 9.9 percentage
points since the previous April.
Put another way, women's
unemployment rate is now just 2.5 percentage points higher than it was in
pre-pandemic times, while men's unemployment rate is 2.9 percentage points
higher.
The Truth Behind the Panic
It is true that American
women initially lost more jobs to COVID-19 than their male counterparts did
(in contrast to the typical recession pattern).
In February 2020, the
civilian unemployment rate for women age 20 and up was
3.1 percent,
according to BLS data. For men, it was 3.2 percent. But by the end of April
2020, the unemployment rate for women had jumped to 15.5 percent, while for
men it only jumped to 13.1 percent.
Two explanations for
this discrepancy have emerged. First, women tend to outnumber men as the
primary caregivers for children and elderly or ailing family members,
leaving them more
vulnerable to work disruptions when
schools and child care centers shut down, when kids need homeschooling, or
when relatives need care. Second, women are more highly concentrated in
retail, leisure, and hospitality jobs, which were more heavily affected by
pandemic-related closures, restrictions, and mandates.
While the first factor has
gained the most attention, the second one may be the bigger culprit.
Labor force
participation for women with children did indeed drop more than it did for
men with children, "consistent with the theory that working mothers
disproportionately took themselves out of the labor force to care for
children who were no longer able to attend day care or school," noted Gallup.
Yet "the drops among women without children and men without children are
also sizable," which "suggests that factors other than child care have
significantly influenced decisions to leave the workforce."
"Overall, these labor force
patterns seem largely tied to occupational differences between women and
men," according to Gallup's analysis of BLS data. "Occupations with a higher
share of women have exhibited lower labor force participation rates and
higher unemployment rates throughout the pandemic."
Either explanation suggests
that—for both women and men—the drop is more likely short-term than
long-term.
A Call to Arms?
Given the current
state of recovery, "it does not make sense to enact permanent programs, such
as government-run paid family and medical leave, subsidized childcare, and
universal pre-K with the justification of fixing a COVID -19 disparity that
no longer exists," argues Heritage
Foundation research fellow Rachel Greszler in a new report.
"Policymakers can do far
more to help women and families by removing government-imposed barriers to
flexible work, to employer-provided paid family and medical leave, and to
accessible and affordable childcare than by adding costly and bureaucratic
new programs and upending the labor market in ways that would limit
families' incomes and choices," she posits.
By February 2021, labor
force participation for both sexes had ticked back up somewhat. And while
women were still seeing a less full recovery, the gap was again less than
one percentage point. Compared to February 2020, men's February 2021 labor
force participation was 2.2 percent smaller and women's was 3.1 percent
smaller.
That's not nothing—"the
gap in labor force changes amounts to roughly 493,000 more women than men
being absent from the labor force since the pandemic began," Gallup pointed
out in early March. But it's also not evidence that women have been
uniquely devastated by
pandemic-related job losses, especially when—contra previous economic
downturns—many of the circumstances that initially created the job losses
will remedy quickly as life returns to a more normal pace.
Indeed, that already seems to be
happening, according
to data from the Bureau of Labor Statistics (BLS).
In April 2021, the labor
force participation rate for U.S. men 20 and older was 69.8 percent, down
from 71.6 percent in February 2020. For women, it was 61.7 percent in April,
down from the 63.3 percent in February 2020. So, while women's labor force
participation was lower than men's at the start of the pandemic and still
is, women are now slightly closer than men are to their pre-pandemic
participation level, with the April 2021 labor force participation rate for
men 1.8 percentage points lower and the rate for women down 1.6 percentage
points.
Continued in article
**How to Mislead With Statistics
Capitalized Value ---
https://en.wikipedia.org/wiki/Market_capitalization
Zoom is Now Worth More Than
Exxon, I Have Ten Questions ---
https://www.thestreet.com/mishtalk/economics/zoom-is-now-worth-more-than-exxon-i-have-ten-questions
Jensen Comment
Capitalized value is a highly controversial way of valuing a company because
most of the shares outstanding are not traded on a daily basis such that prices
of the relatively few shares being traded are generally poor estimates of what
all outstanding shares would bring if they were suddenly made available. Share
trading prices are also subject to a lot market fluctuations that have little to
do with the company itself such as when a powerful world leader dies or is
overthrown.
Accountants argue that using
capitalized value to estimate the total value of a company is usually nonsense
since only equity is being valued rather than total asset value. Using share
prices puts the carts before the accounting horses. The purpose of financial
accounting is to help investors set their buy, sell, and hold decisions based
upon accounting measurements and accounting disclosures such as contingencies.
Would all the owners of Exxon
shares pool their holdings and trade them for all the shares of Zoom? I
seriously doubt it!
Zoom's value is based upon a speculative balloon in the sky, whereas a lot of
Exxon's value lies in hard and soft assets like real estate, oil leases,
tankers, trucks, oil rigs, refineries, etc. Most of those assets have
alternative uses with great value. Zoom's value can pop in an instant, whereas a
great many of Exxon's assets can be put into alternative valuable uses. Also the
hundreds of millions of home and vehicle owners who rely of some type of Exxon
fuel cannot easily change to alternative energies. For example, it will take
decades for hundreds of millions vehicles relying on carbon fuel to be replaced
by carbon-free alternatives.
Zoom's customers can switch on
short notice when some better technology emerges on the scene.
**How to Mislead With Statistics
Simple
Solution to California’s Anticipated $54 Billion Budget Deficit ---
https://www.counterpunch.org/2020/05/15/simple-solution-to-californias-anticipated-54-billion-budget-deficit/
. . .
A 50% tax on the
wealth of just Larry Ellison, Mark Zuckerberg and Elon Musk would solve the
deficit with tens of billions remaining. A quick google search puts their
wealth at:[1]
Zuckerberg $68.2 billion
Ellison $67.4 billion
Musk $36.8 billion
An emergency wealth
tax of 50% on these three individuals alone would come to $86.2 billion.[2] That
would leave over $30 billion more than the estimate of California’s
government deficit. That extra money could be used to house the homeless,
guarantee everyone food and access to medical care, finally provide a proper
level of funding for the state’s public colleges and schools, lift many, if
not all, of the state’s residents out of poverty, and have funds to help out
in case the state experiences another round of destructive fires and/or a
major earthquake.
This type of tax should
have no impact on the lifestyles of the super-wealthy. Recently, they
appeared to be able to get by on “far less.” Zuckerberg’s wealth was put at $46
billion at
the end of 2015 and “just” $4
billion in
2010, less than 6% of what it is today. In 2015, Musk’s wealth was estimated
at $13.2
billion,
not even half of what it is now. After the tax, the net worth of the
super-wealthy would still be excessive.
Continued in article
Jensen Common
An extreme
wealth tax such as that suggested above is not so simple as the article naively
makes it sound. California needs cash and none of the billionaires mentioned
above are sitting on tens of billions in cash or gold or any other investments
that are easily cashed in at market values. They're sitting mostly on common
stock in the companies they control (Facebook, Oracle, Tesla, Boring, and SpaceX,
etc.). Stock prices are set by supply and demand at relatively small amounts of
daily trading. Forcing these huge shareholders to quickly dump 50% of their
enormous holdings would send share values plunging to a point where these
billionaires and their companies no longer have the wealth envisioned in the
above article.
Secondly, the
author of the above article assumes that these billionaires will passively
accept a 50% tax on all their wealth. If such legislation in Sacramento
approaches reality those billionaires will be long gone from California and may
even move their companies out of state. The naive author of the above article
does not investigate why Sweden and France experimented with and then abandoned
much more modest wealth taxes on their most wealthy taxpayers as the wealth
taxes were discovered to be counterproductive on the economies.
Thirdly,
California would be sending a message that there is no longer a California dream
of becoming a billionaire with new ventures in the no-longer Golden State.
Instead the message would be to start new ventures iin more business-friendly
states that still offer an American Dream.
Sir Jim
Ratcliffe, Britain's wealthiest man and a key Brexit backer, has decided to
leave the UK and live in Monaco ---
https://www.independent.co.uk/news/uk/home-news/jim-ratcliffe-brexit-uk-richest-man-monaco-move-tax-haven-eu-leave-a8484211.html
Sir Jim Ratcliffe, Britain’s
wealthiest man and a key Brexit backer,
has decided to leave the UK and live in Monaco.
Despite his previous claims
that the UK would be “perfectly successful” outside of the European Union (EU),
the billionaire has chosen to leave the country of his birth and move to the
principality, whose residents do not pay income tax, on the Mediterranean
coast.
Sir Jim, founder and CEO of the
chemicals giant Ineos, was named as
the richest man in Britain in this year’s Sunday
Times rich
list, with an estimated fortune of £21bn.
Continued in
article
The Achilles
heel of the dual income tax : the Norwegian case ---
https://ssb.brage.unit.no/ssb-xmlui/handle/11250/180583
The dual income tax provides the
self-employed individual with large incentives to participate in tax
minimizing income shifting. The present paper analyses the income shifting
incentives under the Norwegian split model in the presence of technology
risk, and it concludes that the
widely held corporation serves as a tax shelter for high-income
self-employed individuals. In addition, real capital investments with
a low risk profile are means to shift income from the labor income tax base
to the capital income tax base for the high-income self-employed.
OECD:
Recommended Tax Reform in Norway --- Phase Out the Wealth Tax
https://www.oecd-ilibrary.org/content/paper/5k9bls0vpd5d-en?crawler=true
Tax Reform in Norway
A Focus on Capital Taxation
Norway’s dual income tax system achieves high levels of revenue collection
and income redistribution, without overly undermining economic performance
and while paying attention to environmental externalities. It treats capital
and labour income in different ways:
capital income is taxed at a single low rate, while labour income is taxed
at progressive rates.
However, effective tax rates on savings vary widely across asset classes.
The favourable treatment of owner-occupied housing relative to financial
savings should be reduced, preferably by taxing imputed rents at the
standard 28% statutory rate. The wealth tax implies very high effective tax
rates on savings, indicating that it either gives rise to tax avoidance or
significantly inhibits growth. The government should investigate the issue
and, if the growth-equity trade-off is too unfavourable to growth,
phase out or lower the wealth tax.
To restrain tax avoidance by the wealthy, the base of the gift and
inheritance tax should be broadened. Overall, the reform package recommended
in this paper would improve the allocation of capital and increase work and
investment incentives. It could be designed to be broadly neutral in regard
to income redistribution and public revenue.
American
Economic Review 2019: Tax Evasion and Inequality (Scandinavia) ---
https://www.aeaweb.org/articles?id=10.1257/aer.20172043
Drawing on a unique dataset of leaked
customer lists from offshore financial institutions matched to
administrative wealth records in Scandinavia, we show that offshore tax
evasion is highly concentrated among the rich. The skewed distribution of
offshore wealth implies high rates of tax evasion at the top:
we find that the 0.01 percent richest households evade about 25 percent of
their taxes. By contrast, tax evasion detected in stratified random
tax audits is less than 5 percent throughout the distribution. Top wealth
shares increase substantially when accounting for unreported assets,
highlighting the importance of factoring in tax evasion to properly measure
inequality.
Here's a humorous and serious TED talk that seriously argues why the world
needs billionaires---
https://www.ted.com/talks/harald_eia_where_in_the_world_is_it_easiest_to_get_ric
**How to Mislead With
Statistics
The COVID Panic Is a Lesson in Using Statistics to Get
Your Way in Politics ---
https://mises.org/wire/covid-panic-lesson-using-statistics-get-your-way-politics?utm_source=Mises+Institute+Subscriptions&utm_campaign=e9c5c5695a-EMAIL_CAMPAIGN_9_21_2018_9_59_COPY_01&utm_medium=email&utm_term=0_8b52b2e1c0-e9c5c5695a-228708937
Jensen Comment
One of my favorite examples is the media's use of Sweden's relatively high
Covid-19 death rate (that's lower than that of the Belgium, the UK, and various
other EU nations) as a glaring example of what happens when you don't have a
national lockdown. Evidence seems to be mounting that Sweden's high death rate
comes more from a glaring failure to protect its most vulnerable citizens,
especially the elderly. Had Sweden done this aggressively early on in March the
case the media might have had less of a case against the Swedish failure to lock
down. Of course we'll never know in hind sight since national death rates from
Corona-19 are so varied and complicated and the data are so inaccurate.
Please don't take this tidbit
as a suggestion that locking down is not important for most (all?) nations.
Heterogeneity ---
https://en.wikipedia.org/wiki/Homogeneity_(statistics)
Also see ---
https://en.wikipedia.org/wiki/Heterogeneity_in_economics
**How to Mislead With
Statistics
Pandemics and persistent
heterogeneity ---
https://www.medrxiv.org/content/10.1101/2020.07.26.20162420v1
It
has become increasingly clear that the COVID-19 epidemic is characterized by
overdispersion whereby the majority of the transmission is driven by a
minority of infected individuals. Such a strong departure from the
homogeneity assumptions of traditional well-mixed compartment model is
usually hypothesized to be the result of short-term super-spreader events,
such as individual's extreme rate of virus shedding at the peak of
infectivity while attending a large gathering without appropriate
mitigation. However, heterogeneity can also arise through long-term, or
persistent variations in individual susceptibility or infectivity. Here, we
show how to incorporate persistent heterogeneity into a wide class of
epidemiological models, and derive a non-linear dependence of the effective
reproduction number R_e on the susceptible population fraction S. Persistent
heterogeneity has three important consequences compared to the effects of
overdispersion: (1) It results in a major modification of the early epidemic
dynamics; (2) It significantly suppresses the herd immunity threshold; (3)
It significantly reduces the final size of the epidemic. We estimate social
and biological contributions to persistent heterogeneity using data on
real-life face-to-face contact networks and age variation of the incidence
rate during the COVID-19 epidemic, and show that empirical data from the
COVID-19 epidemic in New York City (NYC) and Chicago and all 50 US states
provide a consistent characterization of the level of persistent
heterogeneity. Our estimates suggest that the hardest-hit areas, such as
NYC, are close to the persistent heterogeneity herd immunity threshold
following the first wave of the epidemic, thereby limiting the spread of
infection to other regions during a potential second wave of the epidemic.
Our work implies that general considerations of persistent heterogeneity in
addition to overdispersion act to limit the scale of pandemics.
**How to Mislead With Statistics
Corona19 Death Rates ---
https://www.factcheck.org/2020/05/where-the-u-s-ranks-in-covid-19-deaths-per-capita/
President Trump claimed the USA had one of the lowest death rates.
Chris Wallace Claimed the USA has had the seventh highest death rate ---
https://townhall.com/tipsheet/guybenson/2020/07/20/fact-check-president-trump-vs-chris-wallace-on-coronavirus-death-rates-defunding-the-police-n2572736
Both are wrong. Out of 144 nations the USA comes in at Rank 32
with most European nations having higher
death rates. Austria and Norway had death rates lower than the USA.
Averages (for some nations are more misleading than others). For example, the
Netherlands has a relatively dense population across the entire country. Its
death rate has a low standard deviation relative to the USA. In comparison, the
USA has a relatively disperse nation with populations concentrated in some large
cities in in some states and other states that are relatively low in population.
Among other things population density contributes to higher death rates (but
there are exceptions for other interactive factors like age of the state
populations, number of people commuting by subways and trains, etc.).
Corona-19 Death Rates Per 10,000 Cases
Accumulated Data as of July 19, 2020
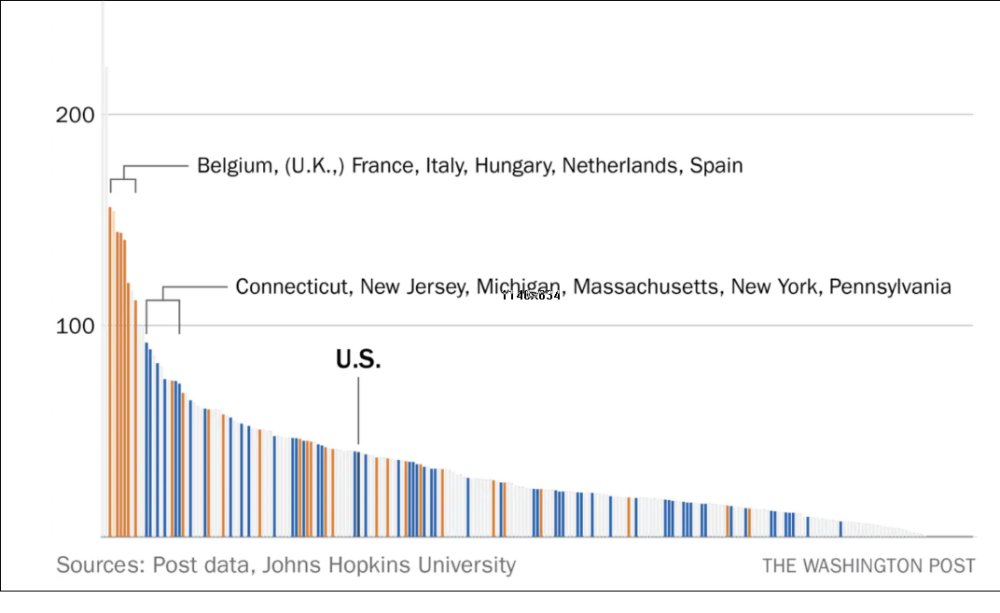
Since accuracy of reported data is
so suspect in the majority of nations, it's misleading to compare number of
cases and number of deaths by nation.
Having said this I will report the following in any case because it's
consistent with the Johns Hopkins Data
Coronavirus (COVID-19) death rate in countries with confirmed deaths and
over 1,000 reported cases as of July 17, 2020, by country ---
https://www.statista.com/statistics/1105914/coronavirus-death-rates-worldwide/
|
Yemen |
Confirmed
Cases
1,552 |
Number of
Deaths
438 |
Death
Rate %
28.22 |
|
Belgium |
63,238 |
9,795 |
15.49 |
|
United Kingdom |
292,552 |
45,119 |
15.42 |
|
France |
200,929 |
30,049 |
14.96 |
|
Italy |
243,736 |
35,017 |
14.37 |
|
Hungary |
4,279 |
595 |
13.91 |
|
Netherlands |
51,351 |
6,137 |
11.95 |
|
Mexico |
324,041 |
37,574 |
11.6 |
|
Spain |
258,855 |
28,416 |
10.98 |
|
Canada |
111,144 |
8,875 |
7.99 |
|
Ecuador |
71,365 |
5,207 |
7.30 |
|
Sweden |
76,877 |
5,593 |
7.28 |
|
Ireland |
25,698 |
1,749 |
6.81 |
| |
|
Liberia |
1,070 |
68 |
6.36 |
|
Sudan |
10,527 |
668 |
6.35 |
|
Niger |
1,102 |
69 |
6.26 |
|
Switzerland |
33,290 |
1,969 |
5.91 |
|
Slovenia |
1,897 |
111 |
5.85 |
|
Romania |
35,003 |
1,971 |
5.63 |
|
China |
85,314 |
4,644 |
5.44 |
|
Burkina Faso |
1,038 |
53 |
5.11 |
|
Iran |
267,061 |
13,608 |
5.10 |
|
North Macedonia |
8,623 |
401 |
4.65 |
|
Denmark |
13,124 |
610 |
465 |
|
Germany |
201,450 |
9,087 |
4.50 |
|
Finland |
7,293 |
328 |
4.25 |
|
Guatemala |
32,939 |
1,404 |
4.26 |
|
Lithuania |
1,902 |
79 |
4.15 |
|
Japan |
23,833 |
985 |
4.13 |
|
Poland |
39,054 |
1,605 |
4.11 |
|
Iraq |
86,148 |
3,532 |
4.09 |
|
USA |
3,565,256 |
138,174 |
3.88 |
|
Sierra Leone |
1,678 |
64 |
3.81 |
|
Brazil |
2,012,151 |
76,688 |
3.81 |
|
Followed by 112 other nations |
|
|
|
|
Accuracy varies greatly |
**How to Mislead With Statistics
Surprising study: Urban density doesn’t cause more COVID-19 infections, even
promotes lower death rates ---
https://www.studyfinds.org/surprising-study-urban-density-doesnt-cause-more-covid-19-infections-even-promotes-lower-death-rates/
Crowded city streets, subways, and buses have been
considered the most likely places to become infected with COVID-19 over the
past few months. Surprisingly, however, a new study from the Johns Hopkins
Bloomberg School of Public Health concludes that densely populated spaces
aren’t actually linked to higher infection
rates.
Even more confounding, the study’s
analysis indicates that crowded, dense locations are associated with lower coronavirus death
rates.
In all, COVID-19 infection and death rates were
assessed across 913 U.S. metropolitan counties. After researchers accounted
for additional factors like race and education, the population density
within each county was not significantly linked to infection rates. As
mentioned, denser counties, as opposed to more rural, sprawling
areas with smaller populations, were associated with lower death rates. The
study’s authors speculate this is because denser, urban areas often offer
better healthcare services.
Instead, higher
coronavirus infection and death rates seem to be linked to a metropolitan
area’s size,
not its density. So, cities that are
very big and stretch across multiple counties that are “tightly linked
together through economic, social, and commuting relationships” appear to be most
at risk of
high coronavirus infection rates
Continued in Article
Jensen Comment
I think the populated density issues are more complicated than density per se
(think population per square mile). For example, the above study concludes that "densely
populated spaces aren’t actually linked to higher infection
rates". However,
I contend that the most dense populations vary greatly in terms of lifestyles.
Los Angeles differs greatly from New York City in many ways, including the LA's
relative lack of public transportation relative to NYC. Also in NCC it's
extremely common for workers to move out of NYC when they retire. And if they
retire in a another dense area like Miami or LA their lifestyles change because
they are no longer commuting daily over long distances by public transportation
to get to and from jobs. The public indoor places of Manhattan and San Francisco
are crowded many hours of each day relative to the public indoor places of
Miami, LA, and Houston.
My point here is that population density as a predictor of Covid-19 infections
and deaths confounds many other issues like demographic differences of
residents, lifestyle differences, etc. But
density should not be eliminated as a contributing factor to the multivariate
set of interactive causes.
Both the risks of infection from Covid-19 and the risk of dying when infected
are multivariate and interactive.
Except for age I don't think we can factor out any one variable (like population
per square mile) from all the other interactive causes.
And density is a continuum. Southern New Hampshire is much less densely
populated than Northern New Hampshire. And Southern New Hampshire is very much
less densely populated than New York City.
New York State has a population of 19.5 million out of which over 8.2 million
live in NYC. New Hampshire has a population of 1.4 million out of which 110,000
live in Manchester, NH.
As a retired total recluse living on food and drink ordered from Amazon, your
odds of testing positive for Covid-10 are probably about the same in NYC or New
Hampshire's Manchester or Littleton in the north. If
you're a patrol cop or hospital worker your probability of testing positive is
much higher in dense NYC or Manchester. However your probability is even lower
in Littleton relative to Manchester and points along I-93 leading toward
Massachusetts.
Now consider the following map of New Hampshire where the state's highest
population density is skewed toward the southern part of the state ---
https://www.nh.gov/covid19/
Note that "50+" in the color
coding includes such large numbers as 500 and 800.
In the middle of New Hampshire my guess is that nursing home residents
contributed to nearly all of the 6, 7, AND 16 numbers shown on the map below.
I contend that the Covid-19 infection rates along the southeastern boundary are
relatively high because this is where NH workers commuting to Massachusetts
(think Boston) are most likely to live in NH. These NH state line residents most
likely were infected due to working in Massachusetts (think NH medical
professionals who work in Massachusetts hospitals)
Contrary to the conclusion of
the above "Surprising Study," the one thing I'm certain of is that people who
move from New York City to northern New Hampshire at the present time ipso
facto have lower probabilities of becoming infected unless they live like a
recluses before and after the move.
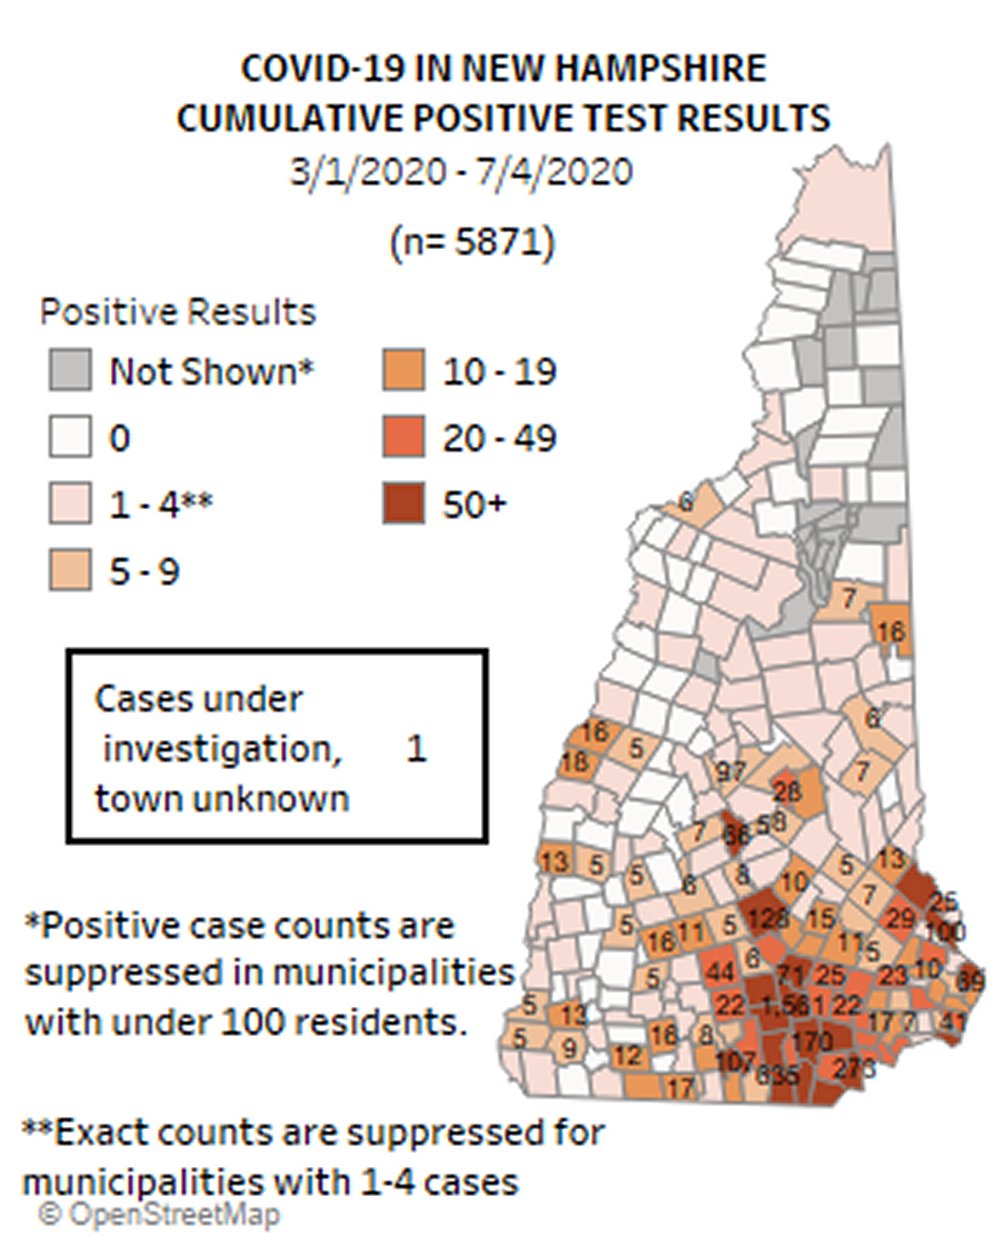
**How to Mislead With Bad
Assumptions
Biden plan for free public
college tuition could doom most private colleges ---
https://www.foxnews.com/opinion/biden-free-college-justin-haskins-chris-talgo
Jensen Comment
I'm opposed to free public colleges except possibly the first two years in local
community colleges. My reason is the trillions of dollars it will cost to
otherwise provide free tuition and other aid to all public universities for
undergraduate and postgraduate education. It's unfair to give them free
undergraduate degrees and then tell them they have to pay to graduate schools
aimed at career education.
The conclusion that free public
education will doom most private colleges is misleading.
Some private colleges are on the brink of extinction and will fail with or
without free public college competition.
Free public college education
will overwhelm the best public colleges (think flagship universities) with
applicants. Either top public universities will limit the acceptance rates for
onsite campuses to what it is now, or they will ruin onsite education with
gigantic lecture classes, or they will limit the free tuition to inferior
distance education. By inferior I mean that online courses will be huge with
almost no interaction between students and their teachers and other students in
each course. The very best online courses are small with instant messaging
between faculty and students. These can
be even better than face-to-face tutorials.
The better private schools will
survive by offering what they offer now --- smaller classes, closer interactions
with faculty, and campus residency aimed at providing all the things they cannot
obtain in large public universities, small dormitories, participation in sports
without having to perform at a professional level, etc.
But the nation may not survive
as Biden's social program promises inch up toward $100 trillion per year for
universal health care for legal and illegal residents, minimum basic income,
green initiatives, reparations for all people of color, open borders, massive
housing subsidies, free college for all legal and illegal residents, enormous
increase in funding to K-12 schools, new roads/bridges,
bailout of states, etc.
The ploy of promising everything for
everybody is not new to political candidates.
History is replete with failed promises when economic realities set in for
elected officials. The worry today is that activists will no longer accept
excuses for failed promises and will elect zealots like AOC, Harris, or Bernie
Sanders instead of Joe Biden --- who, like Obama, I hope is more tuned into
economic realities even though Biden's now making unrealistic promises.
I hope Biden's VP choice is a
realist and not a zealot.
Here's One Economic Reality
That Activists Avoid Mentioning
Some argue that public colleges aren't all that radical, and some European
nations (think Finland and Germany) now offer free university education. But
they don't tell you how these nations face economic realities.
These nations painfully limit the number
of students getting free college education or free training to about the top 1/3
of Tier 2 graduates such that the other 2/3 either cannot get into college or
have to rely on private sector companies to train them with apprenticeships
---
http://faculty.trinity.edu/rjensen/HigherEdControversies.htm#Tertiary
**How to Mislead With Statistics
CDC: USA Media Over Reporting Coronavirus Deaths by 60%
https://www.blabber.buzz/conservative-news/867450-cdc-data-shows-coronavirus-deaths-actually-37308-nearly-half-what-media-is-reporting-special?utm_source=c-alrt&utm_medium=c-alrt-email&utm_term=c-alrt-GI&utm_content=9GHGkdpWhYe83EFyZJjkFO8_21LdfGwaVfyZOKuqu1nQ.A
As of May 1, the CDC website states that 37,308 people died
from the Wuhan coronavirus, which includes confirmed and presumed deaths
from the pathogen.
The data also
shows that the coronavirus pandemic peaked in the U.S. the week of April 11.
Additionally, the
number of coronavirus deaths have been decreasing since April 25, with about
93% of all coronavirus deaths happening to individuals over 55 years old.
As Newsmax
journalist John Cardillo noted, the data reported on by the media and
Worldometer is a “scam” for likely attributing other causes of death to
inflate coronavirus fatalities
Jensen Comment
I can think of trillions of reasons for overstating the deaths, although in
truth much of the problem may be due to careless reporting errors. The same
thing has happened for over 100 years with pneumonia. Pneumonia is known as the
old peoples' friend because when people suffering with cancer or other terminal
illnesses experience weakened immune systems the final cause of death is often
pneumonia. It would've been a total waste of money all those years to have
diverted 60% of the medical research money to preventing pneumonia when that
medical research money was better spent on cancer and other terminal illnesses
that led to the weakened immune systems.
Of course pneumonia among young and healthy people was a much bigger problem
before penicillin and other antibiotics.
There are many reasons (think stimulus money) for over reporting Covid-19
deaths, but the above article has huge statistical errors ---
https://www.snopes.com/fact-check/cdc-death-figures/
**How to Mislead With
Statistics
Have We Already Defunded the
Police?
https://marginalrevolution.com/marginalrevolution/2020/06/have-we-already-defunded-the-police.html
Jensen Comment
A well known problem in cost accounting comes in precisely defining costs to be
classified. The classic example is the definition of a $20 million building on a
balance sheet.
Firstly, that $20 million most likely includes the cost of the land under and
surrounding the building. Land costs are quite different than construction costs
of the building itself. For one thing land site lasts forever and is not subject
to depreciation like the construction costs of the building certain land
improvements.
Secondly, there's the classic problem in accountancy of costs that get
expensed (on the income statement) versus costs that get capitalized (on the
balance sheet) and the rates at which some of those capitalized costs become
expensed. For example, the costs of light bulbs in a $20 million building is a
significant cost. When the building was new, those light bulb costs were
probably included in the $20 million capitalized cost. However, every year
thereafter the replacement costs of those light bulbs are probably expensed each
year even when the light bulbs themselves are expected to last several years.
Now consider "Police and Corrections Expenditures" in the above article. I
suspect these numbers are taken from the annual expenditure budgets.
Governmental accounting is based more on fund accounting than accrual accounting
used by business firms. But fund accounting is troubled by some of the
definitional problems faced in accrual accounting. Does "Police Expenditure" in
the above article include the cost of operating police station buildings or is
it only based on the salaries and bonuses of police officers and administrators?
Does it include the related cost of vehicles, computers, etc.?
Then there's the gray zone of technology costs affecting policing. Does
"Police Expenditure" include the cost of creating and maintaining databases such
as fingerprint, DNA, and criminal records in national, state, and regional
databases?
Presumably, there are tradeoffs such as the more we spend on newer policing
technologies the less we have to spend on police labor that those technologies
replaced. Those technology costs may be included in budgetary funds other than
"Police Expenditures."
Then there's the problem of those multimillion dollar punitive damage awards
the courts pass against police departments. Are they "Police Expenditures?"
And then there's the enormous problem that the State of Illinois and the City
of Chicago know more about than anybody else. Does "Police Expenditure" include
the massive cost of pensions of police officers and administrators? If so
defunding of police is not such a simple matter since retirement obligations go
on and on even if you fire the entire police force.
My point here is that accountancy in the 21st Century accountancy is much
more complex that in the 1400s when Pacioli expressed double-entry bookkeeping
in simple algebraic equations.
The question of whether we are
already "defunding the police" is not so simple to answer as concluded in the
above article.
**How to Mislead With Statistics
California's Energy
Regulations Hurt the Poor, While 'Green' Subsidies Benefit the Rich ---
https://reason.com/2020/07/10/californias-energy-regulations-hurt-the-poor-while-subsidies-benefit-the-rich/
Jensen Comment
This is a classic problem of short-term versus long-term benefits.
The real issue is whether subsidies to wealthy corporations and wealthy
universities might greatly benefit all earthlings (rich and poor) in the
long-run. For example, R&D supplements to Big Oil may help those companies find
and develop low-carbon energy solutions that are much more important to the
planet than solar panels on housing for the rich and poor owners.
And it's not just R&D. Big Oil companies are already investing heavily in
alternative energies (think windmill farms) --- possibly more than the public
sector is investing in such alternatives. Subsidies to Big Oil might hasten
their replacement of carbon-based energies.
**How to Mislead With Statistics
New York Is Having a Violent Summer, But It's Not Because of Bail Reform ---
https://reason.com/2020/07/09/new-york-is-having-a-violent-summer-but-its-not-because-of-bail-reform/
Jensen Comment
This article is misleading because it fails to mention the effect of bail reform
on lesser crimes, particularly shoplifting. To the extent that bail reform
essentially legalizes shoplifting it can do great harm to areas where
shoplifting is heaviest. For example, in the poor parts of Los Angeles, Chicago,
St. Louis, and Baltimore having no punishments for shoplifters means that stores
in those poor parts will close up giving less shopping alternatives (think
grocery stores, pharmacies, Walmarts, Targets, etc.) to the poorest residents of
the cities.
If you want more stores in the ghettos
you have to prevent shoplifting in most every way possible, including punishing
the shoplifters.
**How to Mislead With
Statistics
From a Retraction Watch Newsletter on June 1, 2020
Especially note the study in Lancet that the liberal media jumped on as being
the most definitive study to date. The media loved it, but 180 scientists were
skeptical of parts of it.
Also note that there's a lot of completely phony research being circulated.
How many papers
about COVID-19 have been retracted? We’ve been keeping track, as part of our
database. Here’s
our frequently updated list.
Here’s what was
happening elsewhere:
·
A
large study in The Lancet of hydroxychloroquine for COVID-19 has earned a correction after more
than 180 scientists signed a letter criticizing it. More from Andrew
Gelman.
·
A
company allegedly “fabricated phony scientific studies…to
substantiate their false claims” about COVID-19.
·
The
US Food and Drug Administration (FDA) “has
warned a drug company for data falsification” and environmental
issues.
·
“Scientific misinformation persists when
retractions and corrections are not promptly issued, are not sufficiently
detailed, and fail to connect to the misinformation.”
·
“We
use network models to think about why
retractions often fail.”
·
“The
preliminary nature of what I’ve seen published in top journals is
eye-opening. It forces us to rethink what
peer review means, what rigor means, and what prestige means.”
·
“The
problem is that good science, which requires scrutiny and replication,
simply cannot
move at the speed of the rolling news cycle.”
·
“British psychologist Hans Eysenck has always been controversial for his
social views. His scientific
integrity is now also under attack – again.” More here.
·
“Disability rights activists are pressuring a law school journal to retract
a paper that they claim justifies ‘ableism and eugenics’ in
response to the COVID-19 pandemic.”
·
“Reasons to Worry Less
About the Explosion of Preprints.”
·
“[I]n
recent years,” says a report, “all the major publishers have made
their own investments in preprint platforms.”
·
A
look at open
peer review.
·
“Subsequently, on the same day, this paper was alerted to allegations —
first made public on social media — that parts
of the same piece by Ravi were similar to sections of a paper, ‘Roadmap to
Responsibly Reopen America’, published on April 23, by Paul Romer,
University Professor, New York University, and 2018 Nobel Laureate in
Economics.”
·
“Coronavirus studies appear at lightning speed. Too
soon maybe?”
·
“The
speed of coronavirus
science has consequences.”
·
“When
does fast science become problematic science? COVID-19
is testing us on that question and many more,” says the Los
Angeles Times.
·
“Post-Publication Peer Review for Real:” Researchers say the approach taken
by one neuroscience journal could
succeed where others have failed.
·
“We
also found a better affinity to Nature by
the general audience and a
better affinity to Science in
former USSR scholarly allies.”
·
A study
of retractions in the life sciences, using PubMed, which the
author says is, to the best of her knowledge, “the biggest dataset on
retractions in biomedical literature to be studied.” We’d humbly suggest
looking at our
database, which is far
more comprehensive, next time.
·
“A
Vigilante in Statistical Badlands:” How
a JAMA paper on dialysis came to be retracted.
·
“It
is also interesting to note that several preprints received negatively by
the scientific community are amongst the most tweeted.” A preprint
about preprints during COVID-19.
·
“Concerns have been raised about the treatment of Chinese academics deemed
to have strayed from official narratives about the Covid-19 pandemic.”
·
“An
academic who doesn’t
have the ability to challenge the research findings of their colleagues because
those questions threaten the university’s funding doesn’t have intellectual
freedom.”
·
“However, the results may have been influenced by the (re)search bubble
effect. In other words, using
the Google search engine may have influenced study results due to
underlying, highly personalized algorithms…”
Journal Retracts Study
Debunking Hydroxychloroquine ---
https://www.ozy.com/presidential-daily-brief/pdb-337486/?utm_term=OZY&utm_source=Sailthru&utm_medium=email&utm_campaign=PDB%20%282020-06-05%2010:34:26%29#article337492
Prognosis: Yikes. On May 22, British medical journal The Lancet published a
Harvard study that found not only does the malaria drug not help treat
COVID-19, it’s associated with higher mortality rates. Alarmed, the World
Health Organization paused trials of the drug. But now the journal has
retracted the study at the request of three of its authors, who expressed
concerns about the quality of the data — and Surgisphere, the company that
provided it, has refused to transfer the full dataset.
The retraction could fuel supporters
of hydroxychloroquine like President Trump and Brazilian President Jair
Bolsonaro.
Australian scientists have savaged the international mess over a Harvard
study of the drug hydroxychloroquine as a disastrous setback in the search for
COVID-19 treatments that will scare off patients and undermine trust in good
science ---
https://www.smh.com.au/national/this-is-not-how-science-works-major-setback-in-the-search-for-covid-19-treatment-20200605-p54zxi.html
Australian scientists have
savaged the international mess over a study of the drug hydroxychloroquine
as a disastrous setback in the search for COVID-19 treatments that will
scare off patients and undermine trust in good science.
On Friday, the
World Health
Organisation restarted its trial of
hydroxychloroquine after
The Lancet
medical journal spectacularly retracted
a
research paper that reported the drug was
associated with a
35 per cent increased risk of serious cardiac side effects.
The study’s authors said
they could no longer vouch for the veracity of its data, following repeated
concerns raised about the methods of the US data collection company
Surgisphere.
The Lancet editor, Dr Richard
Horton described the fiasco as "a shocking example of research misconduct in
the middle of a global health emergency” to
The Guardian.
Despite the retraction, British scientists on Friday halted their own
large-scale hydroxychloroquine trial after initial results showed no
evidence of benefit.
"We
reviewed the data and concluded there is no evidence of a beneficial effect
of hydroxychloroquine in patients hospitalised with COVID, and decided to
stop enrolling patients to the hydroxychloroquine arm with immediate
effect," said Martin Landray, an Oxford University professor who is
co-leading the so-called RECOVERY trial.
"This is not a treatment for COVID-19. It doesn't work. This result should
change medical practice worldwide. We can now stop using a drug that is
useless."
In Australia, Health
Minister Greg Hunt announced $170,000 to
fund hydroxychloroquine research at Queensland University of Technology,
the Doherty Institute has resumed recruiting COVID-19 patients for its
hydroxychloroquine ASCOT trial, and the Walter Eliza Hall Institute’s SHIELD
trial has continued to test the prophylactic effects of the drug in
healthcare workers.
Mr
Hunt said Australia is taking cautious steps to consider a range of
different therapies and treatments and "we'll continue with our programs".
But
the damage had been considerable, said SHIELD trial lead investigator
Professor Marc Pellegrini.
“We are diverting valuable resources to mitigate the
fall-out of this scandalous
Lancet
paper,” he said.
“This is incredibly damaging when we need to be moving very fast. The
greatest damage is to science itself.”
Dr
Gaetan Burgio, head of an infectious diseases lab at the Australian National
University, said it is “an absolute disaster” to be focused on an
observational trial of limited value that has distracted from the
gold-standard randomised controlled trials to find an effective treatment
for COVID-19.
“I
wouldn’t be surprised if [trial investigators] have a lot of trouble
recruiting patients as a result of this,” Dr Burgio said.
Continued in article
Bob Jensen's blog called Fraud
Updates ---
http://faculty.trinity.edu/rjensen/FraudUpdates.htm
How to
Mislead With Statistics
The Cost of
Living Adjustment (COLA) for Social Security is Not Based Upon What Senior
Citizens Buy
Social Security beneficiaries might not receive much of a cost-of-living
adjustment next year — and some say recipients might not get anything at
all.
COLA
is linked to the consumer-price index, which has suffered lately because of
low oil prices. Based on the CPI data between January and April of this
year, COLA for next year would be zero, according to Mary Johnson, a Social
Security policy analyst for The Senior Citizens League. There are still five
months until the administration announces the COLA for 2021, which occurs in
October. The adjustment in 2020 was considered minimal, at 1.6% this year,
down from 2.8% in 2019. COLAs have averaged 1.4% over the last decade, down
from the average 3% it was between 2000 and 2009.
. . .
The problem:
Social Security’s cost-of-living adjustment is linked to the consumer-price
index for urban workers. There’s another subset of CPI, known as
CPI-E,
which tracks
elderly spending. The difference is primarily in health care and housing.
Those expenses, including Medicare
premiums and homeowners’ insurance, grow rapidly year over year, but benefit
adjustments don’t reflect that growth.
The coronavirus
crisis could deepen the divide, especially as medical expenses drop in some
areas — such as elective surgeries — but increase in others, including care
for COVID-19 patients. “Older people are disproportionately affected by the
COVID-19 crisis, often due to underlying medical conditions,” Johnson said.
The Centers for Disease Control and Prevention, as well as other leading
figures, have urged older Americans to stay home and away from others as
they are typically at a
higher risk
of complications from contracting the virus.
Annual average out-of-pocket expenses for prescription drugs were $1,102 in
January 2000 and $3,875.76 in January 2020, according to the study — a 252%
increase. Medicare Part B premiums jumped 218% during the same time frame,
and home heating oil grew 172% during that period. Even the price of oranges
grew more than double, from $0.61 in 2000 to $1.34 in 2020, a 120% increase.
A retiree in 2000 with an average benefit of $816 a month would have
$1,246.20 in 2020, but would need $380 more a month just to maintain that
same level of buying power she had in 2000.
Continued in article
Jensen Comment
The 800-lb gorilla in all of this is what will happen to nursing home pricing
and other long-term care nursing prices not covered by Medicare? Nursing home
expenses are going through the roof as nursing homes adapt to the risks of the
pandemic and increased attention given to nursing homes by regulators. It's
pretty safe to predict that already very high nursing home prices in the USA are
going to take another leap upward. There will be increases in Medicare fraud as
heirs try to get loved ones onto Medicaid that covers nursing home care for
"poor people."
Increased costs of Medicaid coverage is
the most serious expense rise for our beleaguered state budgets.
Nursing home pricing trends
2004-2019 ---
https://www.genworth.com/aging-and-you/finances/cost-of-care/cost-of-care-trends-and-insights.html
**How to Mislead With
Statistics (What the attention/advertising seeking media usually ignores)
Coronavirus: Why are
international comparisons difficult?
https://www.bbc.com/news/52311014
Thank you Arnold Barkman for the heads up. b
Everyone wants to know how well their country is tackling coronavirus,
compared with others. But you have to make sure you're comparing the same
things.
The United States, for example, has far more Covid-19 deaths than any other
country - as of 20 April, a total of over 40,000 deaths.
But the US has a population of 330 million people.
If you take the five largest countries in Western Europe - the UK, Germany,
France, Italy and Spain - their combined population is roughly 320 million.
And the total number of registered coronavirus deaths from those five
countries, as of 20 April, was over 85,000 - more than twice that of the US.
So, individual statistics don't tell the full story.
For comparisons to be useful, says Rowland Kao, professor of data science at
the University of Edinburgh, there are two broad issues to consider.
"Does the underlying data mean the same thing? And does it make sense to
compare two sets of numbers if the epidemiology [all the other factors
surrounding the spread of the disease] is different?"
Counting deaths
Let's look at some of the numbers first. There are differences in how
countries record Covid-19 deaths.
France, for example, includes deaths in care homes in the headline numbers
it produces every day, but the daily headline figures for England only
include deaths in hospitals.
There's also no accepted international standard for how you measure deaths,
or their causes.
Does somebody need to have been tested for coronavirus to count towards the
statistics, or are the suspicions of a doctor enough? Does the virus need to
be the main cause of death, or does any mention on a death certificate
count?
Are you really comparing like with like?
Death rates
There is a lot of focus on death
rates, but
there are different ways of measuring them
too.
One
is the ratio of deaths to confirmed cases - of all the people who test
positive for coronavirus, how many go on to die?
But
different countries are testing in very different ways. The UK has mainly
tested people who are ill enough to be admitted to hospital. That can make
the death rate appear much higher than in a country which had a wider
testing programme.
The
more testing a country carries out, the more it will find people who have
coronavirus with only mild symptoms, or perhaps no symptoms at all.
Most cases are never counted at all!
Continued in article
Jensen Comment
There are of course giant nations more populated than the USA. China has 1.5
billion people, but it's suspected that China cheats with statistics when it
suits a purpose. India has almost as many people but is way down the list of
confirmed coronavirus cases and deaths ---
https://www.arcgis.com/apps/opsdashboard/index.html#/bda7594740fd40299423467b48e9ecf6
Reasons are not clear, but India and Africa are mysteriously immune to
coronavirus infections to date.
**How to Mislead With Statistics
Veterans Affairs Secretary Shares Some Key Details About that HCQ Study the
Media Is Obsessing Over
(like patients were so sick nothing could save them) ---
https://townhall.com/tipsheet/cortneyobrien/2020/04/22/veterans-affairs-secretary-shares-some-key-details-about-that-hcq-study-the-media-is-obsessing-over-n2567406?utm_source=thdailypm&utm_medium=email&utm_campaign=nl_pm&newsletterad=&bcid=b16c6f948f297f77432f990d4411617f&recip=17935167
People are dying from
coronavirus because clinical research is too slow (and I
think almost impossible given our changed way of life since March 2020)
https://marginalrevolution.com/marginalrevolution/2020/04/people-are-dying-from-coronavirus-because-research-is-too-slow.html
Jensen Comment
One of the main reasons for general clinical research delay (maybe forever) is
that developers fear massive class action lawsuits. This is why, in most
instances, Big Pharma outsources clinical trials to medical schools. However, in
some instances the costs of this outsourcing combined with fear of lawsuits
leads to failure to test at all (particularly in heart medications and devices
mentioned in the above article). Added to the delay is that for successful
research outcomes there is the added delay of cranking up production and fear
that nations who cheat on patents will develop black market versions of the
medication or medical device. In the case of the coronavirus Bill Gates is
investing in early production of the seven leading prospects of vaccination to
avoid some of the production delays.
The big
problem is that there's such a long delay imposed by nature itself. How
often have we heard that a super flu vaccination is in production only to
discover at the end of the season that it's been a flakey flu vaccination.
Viruses mutate so quickly and unpredictably. More accurate testing of a
vaccination alternative takes years and years --- as in the case of the
successful smallpox vaccination.
Then there's the issue of ethics. Suppose
coronavirus Alternative X is being tested among 500 people chosen at random to
receive Alternative X versus 500 who will receive a placebo.
Do you want to be one of those test
subjects put in a chamber that exposes each of these people to very high risk of
infection? Instead we must let those people be exposed in "normal life,"
and in normal life most people aren't being exposed to the coronavirus,
especially during and after the lockdowns. In the olden days we might go to an
third-world country and pay poor people whatever it takes to be put into a high
risk infection chamber. This is now rightly considered a violation of human
rights to even let poor people have such a choice.
Clinical studies of coronavirus vaccinations will
have a high risk of false negatives
for people in both test groups simply because they were not exposed in a
high risk way to the virus. This is particularly a problem for test subjects in
nursing homes who are now being more carefully shielded from exposure.
It would be monumentally difficult to run clinical
trials in New Zealand or Mongolia or Siberia where so many people are
geographically separated due to huge distances between very small towns and
farms.
Added to this is the issue is a great mystery of
the coronavirus immunities.
Covid-19: South Africa versus Louisiana
As of April 17 South Africa reports
2,605 Covid-19 cases to date and
48 deaths
https://www.arcgis.com/apps/opsdashboard/index.html#/bda7594740fd40299423467b48e9ecf6
South Africa has almost 60 million people with over 80% being Black African
As of April 8 Louisiana reports
17,030 Covid-19 cases with 652
deaths (with an abnormally high proportion being African American)
https://gov.louisiana.gov/index.cfm/communication/viewcampaign/2605?&uid=h5d%2Afvl6n%5B&nowrap=1
Louisiana has 4.6 million people with over 32% being African American
Even with reporting discrepancies there should be an investigation of why
African Americans are so much more prone to die from Covid-19 than Black
Africans. There are many possible reasons even after doubting the degree of
testing and poor record keeping in South Africa ---
https://wgno.com/news/health/coronavirus/louisiana-covid-19-cases-reach-12496-with-409-deaths/
International comparisons of most anything are complicated. This is especially
so in the case of the great 2020 pandemic!
**How to Mislead With Statistics
How Germany is managing its coronavirus epidemic, and reacting with
disdain to Trump’s policies ---
https://theconversation.com/how-germany-is-managing-its-coronavirus-epidemic-and-reacting-with-disdain-to-trumps-policies-134758
The solid and publicly funded German health system
is also credited for Germany’s relatively low death rate. There are over
28,000 intensive care beds with sufficient respirators available at German
hospitals, more than in most other parts of the world.
Jensen Comment
The author of the above article makes no note that its almost impossible to
compare Germany (with 83 million people crowded into a land mass less than half
the size of Texas)
with the USA (with over 350 million residents spread over vast square miles of
sparsely populated land as well as being concentrated in some cities). The
author of the above article would not dare mention that the USA has over 34.7
critical care beds
per 100,000 capita
compared with Germany's 29.2 critical care beds. That author would not dare
mention that the USA has more new drug patents than the rest of the world each
year ---
https://sccm.org/Blog/March-2020/United-States-Resource-Availability-for-COVID-19
The world is more eagerly awaiting a new vaccine from the USA than it is waiting
for one from Germany.
The huge problem with comparing the USA health care with that of Germany is
that the patients in the USA are spread over such a vast territory compared to
Germany. The Coronavirus case has hit some parts of the USA (think the areas
around NYC and Seattle) very hard relative to vast system of thousands rural
communities that have zero or less than a handful of Coronavirus cases. There
are a lot of supplies (think masks, gowns, and ventilators) in the USA stored
unused in USA hospitals that have never seen a Coronavirus case (we have a son
who works in one of these hospitals in Maine). But it would be unwise for these
rural hospitals to strip their supplies when there are risks of sudden outbreaks
anywhere in the USA.
Since Germany has a national health care plan progressives
think think that these "free" health care services must be vastly superior to
the USA's health care coverage. The fact of the matter is that Germany's free
plan is quite basic and relatively inferior to the free plans in other parts of
Europe. The Germans that can afford it pay for private medical insurance to get
better health care coverage.
Health Insurance in Germany --- http://www.toytowngermany.com/wiki/Health_insurance
I think the USA should consider the German insurance plan.
Germany does have some economic advantages over the USA. Since it has much
less National Debt/GDP relative to the USA it's much
easier for the Germans to borrow in order to finance a huge economic stimulus
package relative the USA that will probably have to rely on printing money for
the first stage of a stimulus package ---
https://worldpopulationreview.com/countries/countries-by-national-debt/
A problem for the EU right now is that this pandemic further threatens to
break up the EU since the more prosperous European nations are weary of
supporting their poor neighbors.
**How to Mislead With
Statistics by Assuming a Stationary Process That is Not Stationary
What should we believe and
not believe about R?
https://marginalrevolution.com/marginalrevolution/2020/04/our-best-people-are-working-on-this-problem.html
. . .
Ultimately, the models and
statistics in the field aren’t designed to handle rapidly changing R,
and everything is made much worse by the massive inconsistencies in the
observed data. R itself is a surprisingly subtle concept (especially in
changing systems): for instance, rt.live uses a simple relationship between
R and the observed rate of growth, but their claimed relationship only holds
for the simplest SIR model (not epidemiologically plausible at all for
COVID-19), and it has as an input the median serial interval, which is also
substantially uncertain for COVID-19 (they treat it as a known constant).
These things make it easy to badly missestimate R. Usually these errors pull
or push R away from 1 — rt.live would at least get sign(R – 1) right if
their data weren’t garbage and they fixed other statistical problems — but
of course getting sign(R – 1) right is a low bar, it’s just figuring out
whether what you’re observing is growing or shrinking. Many folks would
actually be better off not trying to forecast R and just looking carefully
at whether they believe the thing they’re observing is growing or shrinking
and how quickly.
All that
said, the growing (not total, but mostly shared) consensus among both folks
I’ve talked to inside Google and with academic epidemiologists who are
thinking hard about this is:
-
Lockdowns, including Western-style lockdowns, very
likely drive R substantially below 1 (say .7 or lower), even without
perfect compliance. Best evidence is the daily death graphs from Italy,
Spain, and probably France (their data’s a mess): those were some
non-perfect lockdowns (compared to China), and you see a clear peak
followed by a clear decline after basically one time constant (people
who died at peak were getting infected right around the lockdown). If R
was > 1 you’d see exponential growth up to herd immunity, if R was 0.9
you’d see a much bigger and later peak (there’s a lot of momentum in
these systems). This is good news if true (and we think it’s probably
true), since it means there’s at least some room to relax policy while
keeping things under control. Another implication is the “first wave” is
going to end over the next month-ish, as IHME and
UTexas (my
preferred public deaths forecaster; they don’t do R) predict.
-
Cases are of course
massively undercounted, but the weight of evidence is that they’re
*probably* not *so* massively undercounted that we’re anywhere near herd
immunity (though this would of course be great news). Looking at
Iceland, Diamond Princess, the other studies, the flaws in the Stanford
study, we’re very likely still at < ~2-3% infected in the US. (25% in
large parts of NYC wouldn’t be a shock though).
Anyways,
I guess my single biggest point is that if you see a result that says
something about R, there’s a very good chance it’s just mathematically
broken or observationally broken and isn’t actually saying that thing at
all.”
That is
all from Rif A. Saurous, Research Director at Google, currently working on
COVID-19 modeling.
Currently it seems to me that those are the smartest and best informed views
“out there,” so at least for now they are my views too.
Jensen Comment
Misleading statistics aren't all bad as long as they get you tenure, promotions,
and pay raises.
**How to Mislead With Speculative Assumptions
Capitalism Has Failed in Fighting Coronavirus ---
https://www.nakedcapitalism.com/2020/04/capitalism-has-failed-in-fighting-coronavirus.html
Jensen Comment
Socialists are embarrassed by not being able to point to a single socialist
takeover in the real world that succeeded. But they are great at making
speculative assumptions without the least bit of evidence.
For example, the above article assumes that socialist regimes would've
stockpiled the needed supplies for all possible pandemics. This is garbage. Was
Mao stockpiling pandemic supplies for his starving peasants? Firstly there are
too many kinds of possible pandemics and other looming disasters to stockpile
for every contingency. Secondly, socialist regimes have repeatedly demonstrated
an inability to feed the people now, let alone spend trillions on stockpiling
supplies to save their lives if future pandemics hit.
I cringe when reading the following written by an academic:
A worker-coop based economy—where workers
democratically run enterprises, deciding what, how and where to produce, and
what to do with any profits—could, and likely would, put social needs and
goals (like proper preparation for pandemics) ahead of profits.
There's no evidence that worker-coop economies will make enormous sacrifices
needed for social goals. If fact there's no evidence of a single worker-coop
economy that sustained itself in the real world.
There is evidence in capitalist economies
(like the Nordic nations) are willing to tax profits for social goals, but then
so is the USA willing to do so or we would not have Social Security, Medicare,
Medicaid, and one of the more generous welfare systems in the world (think of
the tens of millions of people from all over the world trying to emigrate to the
USA). There aren't many nations giving nearly all its children two meals a day
in or out of school. I followed a school bus yesterday that stopped at nearly
every house on the road to hand out a large bag of food to each child.
I hate to say it but the above article is an example of misleading speculative
assumptions.
**How to Mislead With Statistics
Sr. Fauci: ‘You Can’t Rely On The Models,’ Too Many Variables ---
https://www.dailywire.com/news/fauci-you-cant-rely-on-the-models-too-many-variables
Jensen Comment
Missing variables are often overlooked problems by social science, finance, and
accounting researchers. Not only are there too many missing variables, but some
of those variables are ignored because they can't be reliably quantified and/or
are not in purchased databases that "lazy" researchers prefer to use rather than
gather their own data. Models don't deal well with qualitative variables. In
accountancy these variables are called intangibles and are often ignored by
model builders.
An even bigger problem is the assumption of stationary that does not apply to
a non-stationary world. This is especially a problem in a pandemic.
Academic researchers keep using defective models if they can get them tenure
and promotions with the help of journal referees who belong to the same clubs.
**How to Mislead With
Statistics
Critics Say a Pair of
California Antibody Studies Contain Critical Statistical Errors That Produced
Implausible Results ---
https://reason.com/2020/04/22/critics-say-a-pair-of-california-antibody-studies-contain-critical-statistical-errors-that-produced-implausible-results/
Too many false positives, nonrandom study
population, and infection fatality rates out of whack with other data,
critics claim.
Two
studies by researchers associated with Stanford University and the
University of Southern California using antibody blood tests have estimated
that many more people have been infected with the novel coronavirus that
causes COVID-19 than confirmed diagnoses would indicate. How many more
people? In the Santa Clara (Silicon Valley) study, the researchers estimated
that coronavirus infections at the beginning of April were 50- to 85-fold
more than the number of confirmed cases at that time. In the Los Angeles
County study, they estimated the infection rate at 28 to 55 times higher
than confirmed cases in that jurisdiction.
If true, these findings
of vastly more widespread rates of infection would suggest that the disease
is much less lethal than the crude case fatality rates suggest. (A point
noted by
me
and other Reason
colleagues
in reporting on these studies.) Not surprisingly, these findings have proved
quite controversial,
particularly drawing the
critical attention
of
statisticians
from other institutions.
Since the
Los Angeles County study
has apparently not yet been published online, let's focus on the chief
objections to the Santa Clara study. Those include arguments that (1) the
prevalence rates among people tested for antibodies to coronavirus published
in the study are mostly, or even entirely, very likely due to false
positives; (2) the results are skewed because it was enriched with
participants who were more likely to have been exposed to the virus than the
general population of the county; and (3) that COVID-19 infections must be
very widespread to produce the excess mortality seen in places like New York
City, e.g, essentially most New Yorkers must already have been infected,
suggesting an unprecedented level of contagiousness.
First,
let's look at the problem of false positives. The researchers' blood test
survey in Santa Clara County found that 1.5 percent (50 out of 3,330 people
tested) were positive for the presence of antibodies to the coronavirus. So
the question is, how many of the 50 positives they found might be false
positives?
Continued in article
A Wealth Tax is the Way to Fund the Pandemic ---
https://www.nytimes.com/2020/04/21/opinion/coronavirus-wealth-tax.html
A Wealth Tax is Not the Way to Fund a Pandemic ---
https://www.bloomberg.com/opinion/articles/2020-04-21/coronavirus-a-wealth-tax-isn-t-the-right-way-to-pay-for-pandemic?sref=y8VYjYe4
Jensen Comment
Note that a wealth tax is more symbolic than a viable way to raise the trillions
of dollars being spent on the pandemic to date unless you impose an enormous
wealth tax.
Firstly, if you want to eliminate billionaires you can send them all to tax
havens like Monaco before you get the legislation passed.
Secondly, taxes are collected in cash whereas billionaire wealth is invested
in things other than cash (think stocks, bonds, patents, and real estate),
Forcing billionaires to spend trillions in assets to raise cash to pay taxes
could collapse the stock markets, bond markets, real estate markets, and pension
funds at a time when the USA is struggling to keep those markets from collapsing
entirely.
Thirdly, billionaires are not stupid. Thev've seen fit to protect themselves
in constitutional law and obedient bipartisan legislators making passage of a
serious wealth tax almost impossible.
Nations like Sweden, France, and others that passed wealth taxes found wealth
taxes to be a disaster and later rescinded most the wealth taxes and even high
marginal income taxes ---
https://en.wikipedia.org/wiki/Wealth_tax#Criticisms
Adding an enormous wealth tax on top of all the other economic disasters of
the 2020 pandemic will become another nail in the coffin of the USA economy
relative to the world economy that now knows better than to impose serious
wealth taxes.
Here's a humorous and serious TED talk that seriously argues why the world
needs billionaires
https://www.ted.com/talks/harald_eia_where_in_the_world_is_it_easiest_to_get_rich
The Singapore Dream: How Singapore's richest man went
from welding in a factory for $14 per hour to owning a $17 billion hotpot
restaurant chain ---
https://www.businessinsider.com/life-of-singapore-richest-man-from-welder-to-hotpot-billionaire-2020-1
While a
move is underway to destroy the American Dream of rags to riches (by taxing away
the riches) the Chinese dream is on the rise.
The Chinese Dream
How a Chinese billionaire went from making $16 a month in a factory to being one
of the world's richest self-made women with an $8.3 billion real-estate empire
---
https://www.businessinsider.com/worlds-richest-self-made-woman-wu-yajun-net-worth-2019-2
Top 50 Billionaires in China ---
https://en.wikipedia.org/wiki/List_of_Chinese_by_net_worth
Jensen
Comment
The question for students to debate is why a supposed
communist country allows so many billionaires to rise up from poverty.
That's supposed to happen in the USA where a child growing up in deep
poverty (think Oprah Winfrey or Howard Shultz) became a multi-billionaires.
But is it also supposed to happen under communism? If
so, why?
One reason is that many billionaires can afford to pour lots
of money into high risk ventures. When's the last time you heard about a high
risk (think Silicon Valley).
I don't think China is giving any thought to a wealth tax as the result of
the 2020 pandemic. China understands
economics these days better than most USA voters
**How to Mislead With Statistics
The best students in the world, charted ---
https://qz.com/1759506/pisa-2018-results-the-best-and-worst-students-in-the-world/
Once again, Asian countries came out on top. In the
latest test, China and Singapore ranked first and second, respectively, in
math, science, and reading. Elsewhere, Estonia is noteworthy for its
performance, ranking highly in all three subjects.
In the world’s biggest education test, one small country has raced past
all the others ---
https://qz.com/853656/massachusetts-ranks-nears-singapore-the-education-powerhouse-in-global-assessment-of-15-year-olds-who-are-the-best-students-in-the-world-according-to-pisa-2015/
The United States fared poorly, as usual: with a
math score of 470, it performed well below the OECD average, and it is among
the lowest-performing countries in the subject. Results in science declined
from 2012, coming in at 496, slightly above the OECD average. In reading, it
also performed slightly better than the OECD average (493) at 497.
Disadvantaged Schools Don't Need Smaller Classes --- They Need Better
Teachers ---
https://qz.com/1759506/pisa-2018-results-the-best-and-worst-students-in-the-world/
Jensen Comment
Who can argue against wanting and needing better teachers?
But I've long contended that two-parent homes (like
you find in Finland, China, Estonia, and other top-ranking nations) are the
single most important factor in education. It isn't just the
helping of kids do homework. What's more important are the externalities of
two-parent homes in terms of discipline, teamwork, role modeling,
motivation, and (gasp) happy homes.
The problem is that you can't just legislate two-parent homes like you
can legislated increased school budgets.
Jensen Comment
I'm bound to be lambasted for a closing observation on this topic of "best
students." I begin by noting that these are averages, and averages are distorted
by outliers and skewed distributions. Now the controversial observation:
The highest ranking nations in terms of education are really not very diverse
and generally are highly restrictive regarding immigration.
But before we conclude that diversity may draw testing performance down, we
need to observe that there are many confounding factors
when it comes to measuring what we really want from education in terms of
economic performance, innovation, etc. For example, the USA is overwhelmingly
successful in terms of development of new medications and technologies in spite
of the relatively poor performance of the USA relative to top performing OECD
nations on the PISA tests ---
https://en.wikipedia.org/wiki/Programme_for_International_Student_Assessment
The above articles contain some legitimate complaints about PISA testing as a
measure of education performance.
I'm a strong believer is diversity and rather generous limits on diverse
legal immigration. But open borders can destroy the USA or any other advanced
economy irreparably.
Statistically Controlling for Confounding Constructs is Harder than You
Think—Jacob Westfall and Tal Yarkoni ---
https://blog.supplysideliberal.com/post/2019/10/17/jacob-westfall-and-tal-yarkoni-statistically-controlling-for-confounding-constructs-is-harder-than-you-think
Bob Jensen's Threads on P-Values and What Went Wrong ---
http://faculty.trinity.edu/rjensen/theory01.htm#WhatWentWrong
**How to Mislead With False Promises
The Atlantic: We Need to Start Tossing
Money Out of Helicopters It’s the best option in such extreme circumstances ---
https://www.theatlantic.com/ideas/archive/2020/03/we-need-start-tossing-money-out-helicopters/608968/?utm_source=newsletter&utm_medium=email&utm_campaign=politics-daily-newsletter&utm_content=20200331&silverid-ref=NTk4MzY1OTg0MzY5S0
Jensen Comment
I agree to a controlled amount strategically placed, but not when it comes to
raining down trillions of dollars in printed currency. Raining down trillions of
dollars from helicopters would be a disaster. Need I remind you that in Zimbabwe
eventually one egg cost 100 billion Zimbabwe dollars ---
http://robinwestenra.blogspot.com/2019/10/a-crippling-drought-in-zimbabwe.html
By July 2019, the basic food basket was BsF.
2,600,000 in Caracas, according to the Venezuelan Federation of Teachers Center
of Documentation and Analysis, which makes monthly surveys about the price of
products. The Commerce Chamber, however, has a different figure: BsF. 3,700,000
---
https://www.theatlantic.com/ideas/archive/2020/03/we-need-start-tossing-money-out-helicopters/608968/?utm_source=newsletter&utm_medium=email&utm_campaign=politics-daily-newsletter&utm_content=20200331&silverid-ref=NTk4MzY1OTg0MzY5S0
A better alternative to helicopter raining is for the government to
temporarely buy (maybe with printed money) equity positions into newly issued
shares in many failing businesses --- to put them back on their feet until the
economy is turned around. Then government should sell those shares like it did
in a turned-around Chrysler Corporation following the 2008 recession. Multiplier
effects will create new businesses and new jobs ---
https://en.wikipedia.org/wiki/Fiscal_multiplier
Venezuelans would rather have jobs than billions of useless printed money.
The good news in this pandemic is that it may have dashed the false
promises of Warren and Sanders that the USA economy would be a better place with
$100 trillion spent on new social programs ---
Brian Riedl computed the added $100 trillion cost
of Bernie's initiatives (not counting his free pre-schooling for every child,
the collapse of the capital markets, the loss of most USA pensions, and tides
through open borders ) ---
https://www.city-journal.org/bernie-sanders-expensive-spending-proposals
That helicopter spending (think free college for everybody, guaranteed minimum
wage for everybody, free health care and medicines and nursing care for a great
tide of illegal immigrants from all over the world, etc.) would become an
economic disaster
**How to Mislead With Nothing
The Wall Street Journal published such a scathing story about Google's
search engine when they had absolutely nothing to back it up ---
https://searchengineland.com/misquoted-and-misunderstood-why-we-the-search-community-dont-believe-the-wsj-about-google-search-325241
Jensen Comment
I use DuckDuckGo whenever
I'm looking for a company's home page such as when I'm looking for the home page
of a restaurant ---
https://duckduckgo.com/
Often Google searches lead off with a list of reservation booking agents (not
the home site) that must pay Google to have their sites listed first. But that's
only my anecdotal experience.
I use DuckDuckGo increasingly when looking for a lot of things!
One thing I suspect some professors and students do is forget to use the
Google Scholar search engine ---
https://scholar.google.com/
Put your search phrase into quotation marks and find some of the most scholarly
publications about that phrase.
Bob Jensen's Search Helpers: You can do a lot more than just going
to Google or DuckDuckGo ---
http://faculty.trinity.edu/rjensen/Searchh.htm
The article below may be out of date
"I'm Being Followed: How Google—and 104 Other Companies—Are Tracking Me on
the Web," by Alexis Madrigal, The Atlantic, February 29, 2012 ---
http://www.theatlantic.com/technology/archive/12/02/im-being-followed-how-google-and-104-other-companies-are-tracking-me-on-the-web/253758/
This morning, if you opened your browser and went
to NYTimes.com, an amazing thing happened in the milliseconds between your
click and when the news about North Korea and James Murdoch appeared on your
screen. Data from this single visit was sent to 10 different companies,
including Microsoft and Google subsidiaries, a gaggle of traffic-logging
sites, and other, smaller ad firms. Nearly instantaneously, these companies
can log your visit, place ads tailored for your eyes specifically, and add
to the ever-growing online file about you.
There's nothing necessarily sinister about this
subterranean data exchange: this is, after all, the advertising ecosystem
that supports free online content. All the data lets advertisers tune their
ads, and the rest of the information logging lets them measure how well
things are actually working. And I do not mean to pick on The New York
Times. While visiting the Huffington Post or The Atlantic or Business
Insider, the same process happens to a greater or lesser degree. Every move
you make on the Internet is worth some tiny amount to someone, and a panoply
of companies want to make sure that no step along your Internet journey goes
unmonetized.
Even if you're generally familiar with the idea of
data collection for targeted advertising, the number and variety of these
data collectors will probably astonish you. Allow me to introduce the list
of companies that tracked my movements on the Internet in one recent 36-hour
period of standard web surfing: Acerno. Adara Media. Adblade. Adbrite. ADC
Onion. Adchemy. ADiFY. AdMeld. Adtech. Aggregate Knowledge. AlmondNet.
Aperture. AppNexus. Atlas. Audience Science.
And that's just the As. My complete list includes
105 companies, and there are dozens more than that in existence. You, too,
could compile your own list using Mozilla's tool, Collusion, which records
the companies that are capturing data about you, or more precisely, your
digital self.
While the big names -- Google, Microsoft, Facebook,
Yahoo, etc. -- show up in this catalog, the bulk of it is composed of
smaller data and advertising businesses that form a shadow web of companies
that want to help show you advertising that you're more likely to click on
and products that you're more likely to purchase.
To be clear, these companies gather data without
attaching it to your name; they use that data to show you ads you're
statistically more likely to click. That's the game, and there is
substantial money in it.
As users, we move through our Internet experiences
unaware of the churning subterranean machines powering our web pages with
their cookies and pixels trackers, their tracking code and databases. We
shop for wedding caterers and suddenly see ring ads appear on random web
pages we're visiting. We sometimes think the ads following us around the
Internet are "creepy." We sometimes feel watched. Does it matter? We don't
really know what to think.
The issues the industry raises did not exist when
Ronald Reagan was president and were only in nascent form when the Twin
Towers fell. These are phenomena of our time and while there are many
antecedent forms of advertising, never before in the history of human
existence has so much data been gathered about so many people for the sole
purpose of selling them ads.
"The best minds of my generation are thinking about
how to make people click ads," my old friend and early Facebook employee
Jeff Hammerbacher once said. "That sucks," he added. But increasingly I
think these issues -- how we move "freely" online, or more properly, how we
pay one way or another -- are actually the leading edge of a much bigger
discussion about the relationship between our digital and physical selves. I
don't mean theoretically or psychologically. I mean that the norms
established to improve how often people click ads may end up determining who
you are when viewed by a bank or a romantic partner or a retailer who sells
shoes.
Already, the web sites you visit reshape themselves
before you like a carnivorous school of fish, and this is only the
beginning. Right now, a huge chunk of what you've ever looked at on the
Internet is sitting in databases all across the world. The line separating
all that it might say about you, good or bad, is as thin as the letters of
your name. If and when that wall breaks down, the numbers may overwhelm the
name. The unconsciously created profile may mean more than the examined self
I've sought to build.
Most privacy debates have been couched in
technical. We read about how Google bypassed Safari's privacy settings,
whatever those were. Or we read the details about how Facebook tracks you
with those friendly Like buttons. Behind the details, however, are a tangle
of philosophical issues that are at the heart of the struggle between
privacy advocates and online advertising companies: What is anonymity? What
is identity? How similar are humans and machines? This essay is an attempt
to think through those questions.
The bad news is that people haven't taken control
of the data that's being collected and traded about them. The good news is
that -- in a quite literal sense -- simply thinking differently about this
advertising business can change the way that it works. After all, if you
take these companies at their word, they exist to serve users as much as to
serve their clients.
Continued in article
Intelligence and educational achievement ---
https://www.sciencedirect.com/science/article/abs/pii/S0160289606000171
This 5-year prospective longitudinal study of
70,000 + English children examined the association between psychometric
intelligence at age 11 years and educational achievement in national
examinations in 25 academic subjects at age 16. The correlation between a
latent intelligence trait (Spearman's g froK=12m CAT2E) and a latent trait
of educational achievement (GCSE scores) was 0.81. General intelligence
contributed to success on all 25 subjects. Variance accounted for ranged
from 58.6% in Mathematics and 48% in English to 18.1% in Art and Design.
Girls showed no advantage in g, but performed significantly better on all
subjects except Physics. This was not due to their better verbal ability. At
age 16, obtaining five or more GCSEs at grades A⁎–C is an important
criterion. 61% of girls and 50% of boys achieved this. For those at the mean
level of g at age 11, 58% achieved this; a standard deviation increase or
decrease in g altered the values to 91% and 16%, respectively.
Jensen Comment
There was a time when grades might have been competitive predictors of
educational achievement in the USA but then grade
inflation ruined both the predictors and the criterion of educational
achievement ---
Grade Inflation in High Schools 2005-2018 ---
https://fordhaminstitute.org/sites/default/files/20180919-grade-inflation-high-schools-2005-2016_0.pdf
Also see
https://www.k12academics.com/education-issues/grade-inflation
Grade inflation is the
increase in the number of high grades over time. Grade inflation is often
conflated with lax academic standards. For example, the following quote
about lax standards from a Harvard University report in 1894 has been used
to claim that grade inflation has been a longstanding issue: "Grades A and B
are sometimes given too readily ... insincere students gain passable grades
by sham work." Issues of standards in American education have been
longstanding. However, rising grades did not become a major issue in
American education until the 1960s.
The evidence for grade
inflation in the US was sparse, largely anecdotal and sometimes
contradictory until recently. Hard data were not abundant. A Stanford
University report in the 1990s showed that grades had been rising since the
1960s; in an effort to stem grade inflation, Stanford changed its grading
practices slightly. National surveys in the 1990s generally showed rising
grades at American colleges and universities, but a survey of college
transcripts by a senior research analyst in the US Department of Education
found that grades declined slightly in the 1970s and 1980s. Data for
American high schools were lacking.
However, recent data leave little doubt that grades are rising at American
colleges, universities and high schools.
Leaders from number of institutions, including Harvard University and
Princeton University, have publicly stated that grades have been rising and
have made efforts to change grading practices. An evaluation of grading
practices in US colleges and universities written in 2003, shows that since
the 1960s, grades in the US have risen at a rate of 0.15 per decade on a 4.0
scale. The study included over 80 institutions with a combined enrollment of
over 1,000,000 students. An annual national survey of college freshmen
indicates that students are studying less in high school, yet an increasing
number report high school grades of A- or better.
The debate on grade
inflation has moved from assessment to causes. Are grades rising because
standards are being lowered or because students are producing better work?
Grade inflation is highly correlated the timing when student evaluations of
teachers commenced to seriously impact tenure, promotion, and pay of teachers.
Efforts to limit granting of A grades at places like Cornell and Princeton
were deemed failures.
http://faculty.trinity.edu/rjensen/assess.htm#RateMyProfessor
It didn't help when RateMyProfessors.com commenced to post millions of student
evaluations of named teachers online for the world to see
https://www.ratemyprofessors.com/
The top college teachers at the above site tend to be rated as "easy graders."
Statement Against Student Evaluations for Promotion and Tenure Decisions
(American Sociological Association) ---
https://www.asanet.org/sites/default/files/asa_statement_on_student_evaluations_of_teaching_sept52019.pdf
Jensen Comment
They fail to mention my main objection student evaluations --- the disgrace of
grade inflation bringing the median grades up to A- across the USA ---
http://faculty.trinity.edu/rjensen/assess.htm#RateMyProfessor
The Atlantic: Has College Gotten Too Easy? Time spent studying is
down, but GPAs are up --
-
https://www.theatlantic.com/education/archive/2019/07/has-college-gotten-easier/594550/
Jensen Comment
In eight decades the median grade across the USA went from C+ to A- (with
variations of course) and efforts in such places as Princeton and Cornell to
limit the proportion of A grades were ended and deemed as failures.
http://faculty.trinity.edu/rjensen/assess.htm#RateMyProfessor
Now we ask: Has college gotten to easy. I guess you know what I think.
Higher education has become Lake Wobegon where (almost) all students are
above average in terms of what used to be average.
Especially note the grade inflation
graphs at
www.Gradeinflation.com
**How to Mislead With Statistics
MSNBC Contributor: 'The Iowa Caucus Is Essentially the Perfect Example of
Systemic Racism'
https://townhall.com/tipsheet/juliorosas/2020/02/04/msnbc-contributor-the-iowa-caucus-is-essentially-the-perfect-example-of-systemic-racism-n2560703?utm_source=thdailypm&utm_medium=email&utm_campaign=nl_pm&newsletterad=&bcid=b16c6f948f297f77432f990d4411617f&recip=17935167
"Yes, but I think for a different reason than a lot
of folks probably will think. Maybe I’ll be the only person to say this
today. The Iowa caucus is essentially the perfect example of systemic
racism. 91% of the voters in Iowa are white," Maxwell said.
Jensen Comment
That (91%) is about right without any racism since the population of Iowa is
90.7% with a "Black or African American" population of 4.0% ---
https://www.census.gov/quickfacts/fact/table/IA/PST045218
Doesn't 90.7% round to 91%?
This article is essentially the perfect example of crying racism ad
nauseam on MSNBC.
**How to Mislead With Statistics
The mother of all cognitive illusions: The belief
that having to pay higher taxes would make it more difficult to buy what you
want
https://behavioralscientist.org/behavioral-economics-robert-frank-taxes-mother-of-all-cognitive-illusions/
Jensen Comment
What a terrible article. The title of the above
paper should read "The mother of all academic illusions."
The above article is a combination of lousy research and slight of hand. An
example of slight of hand is the comparison of 1940s highest marginal tax rates
with those of the 1980s. Consider the quotation:
In World War II, the top
marginal tax rate in the United States was 92 percent. By 1966 it had fallen
to 70 percent. In 1982 it was 50 percent, and it is now just 37 percent.
This is a slight of hand because the author knows
(but does not tell us) that the USA marginal top tax rates of the 1940s are not
directly comparable with the marginal rates of the 1980s. No high income
taxpayers in the 1940s were paying 92% of their incomes in taxes. For example,
very favorable tax rates on capital gains were exploited by wealthy people to
greatly reduce taxes owed from since 1921 ---
https://en.wikipedia.org/wiki/Capital_gains_tax_in_the_United_States#History
Beginning in 1942, taxpayers
could exclude 50% of capital gains on assets held at least six months or
elect a 25% alternative tax rate if their ordinary tax rate exceeded
50%.[11] From 1954 to 1967, the maximum capital gains tax rate was 25%
Secondly taxpayers during World War II had
various alternatives to earn income tax free such as Series E, F and G U.S.
Treasury Bonds ---
https://en.wikipedia.org/wiki/War_bond#United_States_2
There were and still are various other ways to exempt or
reduce ncome from taxation ---
https://en.wikipedia.org/wiki/Tax_exemption#exempt_income
Probably the worst thing about "The Mother of All
Cognitive Illusions" is the total ignoring of why virtually all advanced nations
(and most others) greatly reduced highest marginal tax rates between 1979 and
2002, because high marginal top tax rates were counter
productive to economic growth and prosperity.
http://www.econlib.org/library/Enc/MarginalTaxRates.html
Those nations like Sweden that did not offer lower capital gains rates and other
tax avoidance alternatives took terrible hits by confiscating high incomes
essential to their economies. When they at last discovered how counter
productive these high tax rates were to their economies they quickly reduced the
top marginal rates. Also remember that some nations like Denmark that still have
relatively high marginal rates are including more services in with their tax
dollars like free medical care and free college and job training (for the top
35% of the students).
|
Table 1 Maximum
Marginal Tax Rates on Individual Income |
|
*. Hong
Kong�s
maximum tax (the
�standard
rate�)
has normally been 15 percent, effectively capping the marginal rate
at high income levels (in exchange for no personal exemptions). |
|
**. The
highest U.S. tax rate of 39.6 percent after 1993 was reduced to 38.6
percent in 2002 and to 35 percent in 2003. |
|
|
|
|
1979 |
1990 |
2002 |
|
Argentina |
45 |
30 |
35 |
|
Australia |
62 |
48 |
47 |
|
Austria |
62 |
50 |
50 |
|
Belgium |
76 |
55 |
52 |
|
Bolivia |
48 |
10 |
13 |
|
Botswana |
75 |
50 |
25 |
|
Brazil |
55 |
25 |
28 |
|
Canada (Ontario) |
58 |
47 |
46 |
|
Chile |
60 |
50 |
43 |
|
Colombia |
56 |
30 |
35 |
|
Denmark |
73 |
68 |
59 |
|
Egypt |
80 |
65 |
40 |
|
Finland |
71 |
43 |
37 |
|
France |
60 |
52 |
50 |
|
Germany |
56 |
53 |
49 |
|
Greece |
60 |
50 |
40 |
|
Guatemala |
40 |
34 |
31 |
|
Hong Kong |
25* |
25 |
16 |
|
Hungary |
60 |
50 |
40 |
|
India |
60 |
50 |
30 |
|
Indonesia |
50 |
35 |
35 |
|
Iran |
90 |
75 |
35 |
|
Ireland |
65 |
56 |
42 |
|
Israel |
66 |
48 |
50 |
|
Italy |
72 |
50 |
52 |
|
Jamaica |
58 |
33 |
25 |
|
Japan |
75 |
50 |
50 |
|
South Korea |
89 |
50 |
36 |
|
Malaysia |
60 |
45 |
28 |
|
Mauritius |
50 |
35 |
25 |
|
Mexico |
55 |
35 |
40 |
|
Netherlands |
72 |
60 |
52 |
|
New Zealand |
60 |
33 |
39 |
|
Norway |
75 |
54 |
48 |
|
Pakistan |
55 |
45 |
35 |
|
Philippines |
70 |
35 |
32 |
|
Portugal |
84 |
40 |
40 |
|
Puerto Rico |
79 |
43 |
33 |
|
Russia |
NA |
60 |
13 |
|
Singapore |
55 |
33 |
26 |
|
Spain |
66 |
56 |
48 |
|
Sweden |
87 |
65 |
56 |
|
Thailand |
60 |
55 |
37 |
|
Trinidad and Tobago |
70 |
35 |
35 |
|
Turkey |
75 |
50 |
45 |
|
United Kingdom |
83 |
40 |
40 |
|
United States |
70 |
33 |
39** |
|
|
|
Source: PricewaterhouseCoopers;
International Bureau of Fiscal Documentation. |
**How to
Mislead With Statistics
Market
Capitalization ---
https://en.wikipedia.org/wiki/Market_capitalization
Market cap is given by the formula MC = N × P where MC is the market
capitalization, N is the number of shares outstanding, and P is the closing
price per share.
Jensen
Comment
Although the above article contends MC is the "equity value of a company", I
flatly deny that a market capitalization value is "the" equity value of the
company unless all or most of the shares are traded such as in a cash
acquisition of all the shares. The closing price (Marginal P) may only be 100 or
less shares, and their price per share will be vastly different than the
(usually unknown) closing value of all shares divided by all outstanding shares.
No analyst in the world contends that the closing (marginal) price of a
company's shares is indicative of the total equity value of a corporation.
First and
foremost the closing (marginal) price based in a small trade of only a few
shares does not reflect control of the company. The element of control (which
may entail less than 50% of the shares) is of enormous value (and risk) that is
not reflected in a small marginal trade (e.g., 100 shares) at the end of a
trading day.
Secondly and
importantly the closing (marginal) price of a few shares reflects total market
ups and downs that often have little to do with the underlying long-term equity
value of a given company such as the downslide of market closing prices of Ford
and Tesla following a missile attack on a couple of
fuel tanks in Saudi Arabia. Tesla stock prices may actually decline as part of a
general market price slide even though Tesla cars do not consume gasoline. I
don't think Iran's recent missile attack on a Sauidi oil field had any impact on
the long-term value of Ford and Tesla.
Thirdly,
daily closing prices of small trades are impacted by short-term trading
strategies and liquidity preferences of investors who only trade relatively
small numbers of shares relative to total outstanding shares. Total (unknown)
equity values of Ford and Tesla change very little day-to-day as a rule whereas
the short-term trader profits and losses my change enormously. Small trades take
place most of the time even when total equity value is unchanged.
Baloney Stat BS: Tesla
is now the highest-valued automaker in US history
Tesla is now the highest-valued automaker in US history ---
https://markets.businessinsider.com/news/stocks/tesla-stock-price-rally-most-valuable-us-car-maker-history-2020-1-1028804022
This kind of headline should not be allowed
Tesla’s
market cap is now double Ford’s ---
https://qz.com/1779609/teslas-market-cap-is-now-more-than-double-fords/
Jensen
Comment
So now let's compare what factors (aside from small trader speculations) are
extremely important to the total equity value of Tesla versus Ford.
Tesla Inc.
Ford Motor Company ---
https://en.wikipedia.org/wiki/Ford_Motor_Company
Even though
GAAP accounting statements are not based upon current values of all assets and
liabilities GAAP accounting suggests Tesla
has a lot less total equity value than Ford? Anybody who invests
entirely on Tesla instead of Ford in pension savings is gambling big time. The
risk of gambling a small proportion of savings in Tesla can be diversified, but
the risk of gambling everything on Tesla is far greater than investing
everything in Ford.
The reason GAAP accounting does not report current value of a company's total
equity is that nobody in the world knows how to compute total equity value
unless future streams of the company's net cash flows are
known to infinity.
What accountants call current "exit
values" of most assets and liabilities are prohibitively costly to estimate with
reliability and the sums of asset and liability exit values are misleading as
estimates of total equity value because exit values of individual items do not
reflect interactive higher order interaction covariances ("value
in use") that are usually impossible to estimate along with the values of
intangibles that nobody knows how to estimate such as the current value of the
labor forces of Apple, Microsoft, Tesla, and Ford. The value of an intangible
employee (think Elon Musk) is fundamentally different than the tangible value of
a building or machine (think robot), because management cannot control the use
of an employee in the same manner as a building or machine. A machine cannot by
itself decide to change companies or retire from the company. But an employee
can simply decide to no longer work for a company. Slavery
was prohibited long ago.
Two reasons Ford is fundamentally more
valuable than Tesla are financial scale and diversification. Ford owns a lot
more tangible assets than Tesla that will be valuable if both Ford and Tesla
fail. Ford has a lot more borrowing capacity since Tesla is so deep in debt
relative to assets. Ford is much more likely to be bailed out by the USA
government in times of financial emergency due to the bargaining power of four
times as many employees and the dependency of local communities across the USA
on tax revenues from Ford assets and employees.
Baloney Stat BS: Tesla
is now the highest-valued automaker in US history
Tesla is now the highest-valued automaker in US history ---
https://markets.businessinsider.com/news/stocks/tesla-stock-price-rally-most-valuable-us-car-maker-history-2020-1-1028804022
This kind of headline should not be allowed
Why Hydrogen Fuel Cell Cars are Tesla's Biggest Threat
https://www.businessinsider.com/hydrogen-fuel-cell-cars-teslas-biggest-threat-2019-12
Two reasons Ford and the other larger
vehicle manufacturers are fundamentally more
valuable than Tesla are financial scale and diversification. Ford owns a lot
more tangible assets than Tesla that will be valuable if both Ford and Tesla
fail. Ford has a lot more borrowing capacity since Tesla is so deep in debt
relative to assets. Ford is much more likely to be bailed out by the USA
government in times of financial emergency due to the bargaining power of four
times as many employees and the dependency of local communities across the USA
on tax revenues from Ford assets and employees.
Suppose that new technology such as
cheap hydrogen fuel cells make both lithium battery and gasoline powered cars
obsolete. Ford has more cash, more factories, more employees, and more borrowing
power (credit) to quickly shift to manufacture of hydrogen-powered vehicles..
Tesla is stuck with one car ,manufacturing factory (using tents) in the USA.
lousy credit, and many fewer employees to quickly compete in the USA's hydrogen
vehicle market.
Tesla is a Ponzi fraud!
**How to Mislead
With Statistics
Market
Capitalization ---
https://en.wikipedia.org/wiki/Market_capitalization
Market cap is given by the formula MC = N × P where MC is the market
capitalization, N is the number of shares outstanding, and P is the closing
price per share.
Jensen Comment
Although the above article contends MC is the "equity value of a company", I
flatly deny that a market capitalization value is "the" equity value of the
company unless all or most of the shares are traded such as in a cash
acquisition of all the shares. The closing price (Marginal P) may only be 100 or
less shares, and their price per share will be vastly different than the
(usually unknown) closing value of all shares divided by all outstanding shares.
No analyst in the world contends that the closing (marginal) price of a
company's shares is indicative of the total equity value of a corporation.
First and
foremost the closing (marginal) price based in a small trade of only a few
shares does not reflect control of the company. The element of control (which
may entail less than 50% of the shares) is of enormous value (and risk) that is
not reflected in a small marginal trade (e.g., 100 shares) at the end of a
trading day.
Secondly and
importantly the closing (marginal) price of a few shares reflects total market
ups and downs that often have little to do with the underlying long-term equity
value of a given company such as the downslide of market closing prices of Ford
and Tesla following a missile attack on a couple of
fuel tanks in Saudi Arabia. Tesla stock prices may actually decline as part of a
general market price slide even though Tesla cars do not consume gasoline. I
don't think Iran's recent missile attack on a Sauidi oil field had any impact on
the long-term value of Ford and Tesla.
Thirdly, daily
closing prices of small trades are impacted by short-term trading strategies and
liquidity preferences of investors who only trade relatively small numbers of
shares relative to total outstanding shares. Total (unknown) equity values of
Ford and Tesla change very little day-to-day as a rule whereas the short-term
trader profits and losses my change enormously. Small trades take place most of
the time even when total equity value is unchanged.
Tesla’s
market cap is now double Ford’s ---
https://qz.com/1779609/teslas-market-cap-is-now-more-than-double-fords/
Jensen Comment
So now let's compare what factors (aside from small trader speculations) are
extremely important to the total equity value of Tesla versus Ford.
Tesla Inc.
Ford Motor Company ---
https://en.wikipedia.org/wiki/Ford_Motor_Company
Even
though GAAP accounting statements are not based upon current values of all
assets and liabilities GAAP
accounting suggests Tesla has a lot less total equity value than Ford?
Anybody who invests entirely on Tesla instead of Ford in
pension savings is gambling big time. The risk of gambling a small proportion of
savings in Tesla can be diversified, but the risk of gambling everything on
Tesla is far greater than investing everything in Ford.
https://www.investopedia.com/ask/answers/122314/what-difference-between-market-capitalization-and-market-value.asp
The reason GAAP accounting does not report current value of a company's total
equity is that nobody in the world knows how to compute total equity value
unless future streams of the company's net cash flows are
known to infinity.
What accountants call current "exit values"
of most assets and liabilities are prohibitively costly to estimate with
reliability and the sums of asset and liability exit values are misleading as
estimates of total equity value because exit values of individual items do not
reflect interactive higher order interaction covariances that are usually
impossible to estimate along with the values of intangibles that nobody knows
how to estimate such as the current value of the labor forces of Apple,
Microsoft, Tesla, and Ford. The value of an intangible employee (think Elon
Musk) is fundamentally different than the tangible value of a building or
machine (think robot), because management cannot control the use of an employee
in the same manner as a building or machine. A machine cannot by itself decide
to change companies or retire from the company. But an employee can simply
decide to no longer work for a company.
Slavery was prohibited long ago.
**How
to Mislead With Charts
MIT: Our pathetically slow shift to clean energy, in five
charts ---
https://www.technologyreview.com/s/614917/our-pathetically-slow-shift-to-clean-energy-in-five-charts/
Jensen Comment: Some of the charts are misleading. All "renewables" are
not carbon free. Up here amidst a national forest "renewable" biomass electric
generating plants burn wood chips with smoke pouring out of tall chimneys like
they are coal plants. People are also burning a lot of "renewable" split logs in
wood stoves that send carbon into the atmosphere far worse than my propane
stoves.
**How to
Mislead With Statistics (Note the bias ratings)
Which Pollsters To Trust In 2018 By Nate Silver
Filed under 2018 Election
https://fivethirtyeight.com/features/which-pollsters-to-trust-in-2018/
Climate Alarmists (think NASA) Caught Manipulating Temperature
Data Yet Again ---
https://www.blabber.buzz/conservative-news/603035-climate-alarmists-caught-manipulating-temperature-data-yet-again-special?utm_source=c-pm&utm_medium=c-pm-email&utm_term=c-pm-GI
**How to Mislead With Statistics: What can possibly go wrong when
comparing first-year incomes of history versus computer science graduates?
The U.S. Department of Education on Wednesday released data on first-year
earnings of college graduates, for the first time broken down by program level
---
https://www.insidehighered.com/news/2019/11/21/federal-government-releases-earnings-data-thousands-college-programs?utm_source=Inside+Higher+Ed&utm_campaign=6ed01ffd23-DNU_2019_COPY_02&utm_medium=email&utm_term=0_1fcbc04421-6ed01ffd23-197565045&mc_cid=6ed01ffd23&mc_eid=1e78f7c952
Jensen Comment
Firstly, earnings in the first year of a job may be of lesser importance than
other things. For example, it's well known that accounting graduates after
five-years of study and a masters degree earn less on average than computer
science and engineering graduates with four-year degrees. But accounting
graduates know that jobs are plentiful and the most desired starting jobs with
the largest multinational auditing, consulting, and tax firms are more important
than starting jobs at possibly higher salaries with other companies. The reasons
are many, the most important being the investment in training and experience
given by the largest multinational accounting firms.
Unlike physicians and engineers accounting graduates are not specialists when
they graduate. They rely upon the training and experience that their
first employers provide to them to become specialists. In fact more often than
not they don't even intend to stay with their first employers after they get
that training and experience.
What is known is that training and exposure to high paying auditing and tax
clients can lead to fast tracks to high-paying executive opportunities as well
as exciting challenges like getting into the FBI and other law enforcement
agencies. Some accountants hope to start out in the IRS that spends a lot on
training and offers opportunities later on to get a high paying tax accounting
job with business firms. Some accounting graduates intend to get all that
training and experience so they can start up their own firms.
Secondly, large accounting firms are now also providing non-salary benefits
including financial assistance for passing the CPA examination and help in
paying off student loans and family-friendly job assignments that allow young
parents to work out of their homes much of the time. And there are other
disciplines where non-salary benefits include time off. Many college
graduates become school teachers who want summers free to be with their young
children full time when those children are not in school.
Thirdly, in many fields those first-year incomes are not full salaries.
Especially in marketing and finance (think stock brokers) those incomes have a
low base salary plus commissions. Commissions are great if you bust your butt 80
hours a week, including becoming super active in your church and in your
community to make sales contacts and/or spend some of your earnings on travel
expenses and entertainment expenses that are not fully paid by your employer.
Some graduates don't want to bust their butts 80 hours per week drumming up
sales commissions.
Fourthly, reported first year salaries are often biased samples. Think of
where humanities graduates go after graduation. A goodly number have no
first-year incomes because they go on to graduate schools (think further study
in law schools and MBA programs). The ones that do not go on for graduate
studies may well be comprised of many graduates who had low GRE or GMAT scores
and could not get into top graduate programs. They're more likely to become
those over-qualified McJobs workers we hear so much about.
Fifthly, think of the poor slobs who graduate from college and join the
military --- Yeah those poorly-paid slobs who rise to the ranks of among
officers to retire in their early 40s with great lifetime pensions and
medical benefits and go on to double dip in life with new careers on top of
their retirement benefits. Their so-called "first-year earnings" in the military
are highly misleading when you forget to add in the retirement benefits.
Sixtly, some (most?) high-paying jobs are less secure. Yeah, school teachers
may have low-starting salaries but they're usually on a tenure track for job
security. Civil servants have lower incomes but they cannot be fired as long as
they're not sent to prison.
I could go on and on, but I think you get the point that studies like the one
above that compare first-year earnings can lead college students into making
lousy career choices.
**How to Mislead With
Statistics
Here's the salary breakdown for Yale's MBA class of 2019,
including the industries that are paying its grads the most ---
https://www.businessinsider.com/the-starting-salaries-for-yales-2019-mba-graduates-2019-12#1-law-8
Jensen Comment
One thing that's misleading is the category "Accounting and Finance." This is
more finance than accounting since most MBA programs, including that of Yale, do
not provide nearly enough accounting to sit for the CPA examination or get a job
in auditing or tax accounting. Any accountants graduating from from most MBA
programs took their accounting, auditing, and tax as undergraduates.
Secondly, those $125,000 annual starting salaries are averages,
and averages are distorted by distribution variations, skewness, and outliers.
More importantly, most of those high-paying starting salaries are
in urban centers like Boston, NYC, Chicago, San Francisco, Washington DC, and
Los Angeles. A starting salary of $125,000 in those cities won't go as far as a
$70,000 salary in Des Moines, Topeka, Oklahoma City, and San Antonio. In San
Francisco you may have to live in your van on only $125,000 per year.
This of course does not mean that some of those high-paying
starting salaries do not open the gates to much higher compensation a few years
down the road. But the best opportunities often depend upon the undergraduate
majors. A computer science, Chinese language, or engineering undergraduate
usually faces more opportunities with a Yale MBA diploma than an undergraduate
in art, music, or history having the same Yale MBA diploma.
And we have to ask why Ivy League MBA diplomas are usually worth
more than an MBA diploma from Cactus Gulch State University?
My answer is that it's mostly the high admission standards of the Ivy League,
University of Chicago, Stanford, and other prestigious university MBA programs.
It's the high standards of admission that count more than the top A
grades that most every graduate gets in the prestigious MBA programs.
My main point is that any measure of
central tendency cannot represent the total distribution without being
potentially misleading. It takes a graphic or some table of outcomes showing the
entire distribution.
One of the main distortions is to not
give special consideration to those who remain unemployed after graduation such
as an MBA graduate who elects for a time to be a parent at home with zero salary
or a relatively low salary from part-time employment. People get college degrees
with the long-run in mind, and doing an analysis at a point in time can be
misleading.
I would also like to see a factoring
out of some outliers. Two of my close friends at Stanford University decades ago
were an MBA student and his wife who lived in an apartment next door for a time.
Jerry graduated with an MBA and went to work an enormous salary where he would
have worked had he never gone to college. His father owned what was possibly the
largest car dealership in the State of Minnesota. Jerry started out the day
after graduation as the CEO.
Jerry was an outlier, but there are
likely to be several such outliers each year where graduates go to work at high
salaries in family businesses. Another example of an MBA friend at the time is a
graduate whose father owned the largest department store in Sydney, Australia.
Another example, is one of my former students who today is a billionaire (at
least on paper). He was a CEO of his own company when he commenced at Trinity
University as a freshman at age 18.
And there are bound to be some outliers
of unemployed graduates, including those that are unemployed for reasons other
than parenthood. MBA graduates are commonly not earning much to begin with
because they're commencing their own startups. I recall one Stanford MBA
graduate who partnered with his sister to form an ultimately successful chain of
cookie stores that financed his failed attempt to become a world-famous author.
In the first year of graduation his income was negative.
And there's the issue of salary before
and after getting a degree of any kind. I don't think Jack Palance's Hollywood
income changed because he got a degree from Stanford after he was already a
famous actor.
These are the types of distortions that
I have in mind when I talk about outliers and other aberrations in
distributions.
The Atlantic: Unhappy Socialists of South America ---
https://www.theatlantic.com/ideas/archive/2019/11/evo-morales-finally-went-too-far-bolivia/601741/?utm_source=newsletter&utm_medium=email&utm_campaign=atlantic-daily-newsletter&utm_content=20191111&silverid-ref=NTk4MzY1OTg0MzY5S0
When an independent observer mission from the Organization of American
States published its audit of Bolivia's election yesterday, the game was
finally up. After the OAS announced that there had been “clear
manipulations” of the vote in a scathing report, Morales agreed to new
elections. A few hours later, as scores of his own allies started to abandon
the sinking ship, he resigned from office. Though the future of Bolivian
democracy still remains radically uncertain, this is a momentous turning
point: one of the first times in recent memory that an authoritarian
populist has been forced to vacate his office, because his own compatriots
would not stand for his abuses.
Morales’s departure from office marks both a sea change in Latin American
politics and a stinging rebuke to the naïveté of parts of the Western left.
Even though there had always been strong evidence of their anti-democratic
leanings, new socialist leaders such as Hugo Chávez in Venezuela and Morales
in Bolivia were widely celebrated throughout the first decade of the 21st
century as the future face of Latin America.
Now virtually nothing remains of their erstwhile (socialist) appeal. Chávez
and his successor, Nicolás Maduro, have made Venezuela deeply authoritarian
and shockingly poor. Meanwhile, the Bolivian people have come out in great
numbers to stop Morales from violently crushing their protests. As one of
the most famous slogans of the Latin American left holds, El pueblo unido
jamás será vencido: The people united will never be defeated.
From east to west, and south to north, the dream of Latin America’s
so-called pink wave has turned into a nightmare. And the many scholars,
writers, and politicians who have for years sung the praises of aspiring
dictators like Maduro and Morales should not be easily forgiven for
sacrificing the rights of distant people on the altar of their rigid
ideology.
Continued in article
Jensen Comment
The so-called pink wave moved north among the faculties and
students of universities in the USA who applaud tens of trillions of dollars
in annual spending proposals for green initiatives, free medical
services, free medications, free nursing homes, free college, free
preschool, free housing, free food, guaranteed annual income, reparations,
open borders, legalized prostitution, etc. to the tune of over $10+ trillion
per year --- spending proposals that threaten
whatever's left of capitalism in the Western hemisphere.
Meanwhile capitalism thrives on the other side of the globe
in parts of Europe and in Asia.
Bernie Leads His Party to Open Borders
---
https://townhall.com/columnists/patbuchanan/2019/11/12/bernie-leads-his-party-to-open-borders-n2556311?utm_source=thdaily&utm_medium=email&utm_campaign=nl&newsletterad=11/12/2019&bcid=b16c6f948f297f77432f990d4411617f&recip=17935167
While a
move is underway to destroy the American Dream of rags to riches (by taxing away
the riches) the Chinese dream is on the rise.
The Chinese Dream
How a Chinese billionaire went from making $16 a month in a factory to being one
of the world's richest self-made women with an $8.3 billion real-estate empire
---
https://www.businessinsider.com/worlds-richest-self-made-woman-wu-yajun-net-worth-2019-2
Top 50 Billionaires in China ---
https://en.wikipedia.org/wiki/List_of_Chinese_by_net_worth
Jensen
Comment
The question for students to debate is why a supposed
communist country allows so many billionaires to rise up from poverty.
That's supposed to happen in the USA where a child growing up in deep
poverty (think Oprah Winfrey or Howard Shultz) became a multi-billionaires.
But is it also supposed to happen under communism? If
so, why?
One reason is that many billionaires can afford to pour lots
of money into high risk ventures. When's the last time you heard about a high
risk (think Silicon Valley) venture in Europe?
NYT: The Happy, Healthy Capitalists of Switzerland
---
https://www.nytimes.com/2019/11/02/opinion/sunday/switzerland-capitalism-wealth.html
Like many progressive intellectuals, Bernie
Sanders traces his vision of economic paradise not to socialist
dictatorships like Venezuela but to their distant cousins in Scandinavia,
which are just as wealthy and democratic as the United States but have more
equitable distributions of wealth, as well as affordable health care and
free college for all.
There is, however, a country far richer and
just as fair as any in the Scandinavian trio of Sweden, Denmark and Norway.
But no one talks about it.
This $700 billion European economy is among the
world’s 20 largest, significantly bigger than any in Scandinavia. It
delivers welfare benefits as comprehensive as Scandinavia’s but with lighter
taxes, smaller government, and a more open and stable economy. Steady growth
recently made it the second richest nation in the world, after Luxembourg,
with an average income of $84,000,
or $20,000 more than the Scandinavian average. Money is not the final
measure of success, but surveys also rank this nation as one of the world’s
10 happiest.
This less socialist but more successful utopia
is Switzerland.
While widening its income lead over Scandinavia
in recent decades, Switzerland has been catching up on measures of equality.
Wealth and income are distributed across the populace almost as equally as
in Scandinavia, with the middle class holding about 70 percent of the
nation’s assets. The big difference: The typical Swiss family has a net
worth around $540,000, twice its Scandinavian peer.
Switzerland did draw 15 minutes of media attention
around 2010, when Obamacare was still new — but only for its
health care system, which requires
all residents to buy insurance from private providers and subsidizes those
who can least afford it. Admirers said Swiss health care had something for
everyone: universal coverage for liberals, private providers and consumer
choice for conservatives.
But for the most part, intellectuals ignore
Switzerland as a model, perhaps put off by its exaggerated reputation as a
shady little tax haven, where Nazi gold and other illicit fortunes hide
behind strict bank secrecy laws. In 2015,
Switzerland agreed under pressure to share bank records
with foreign tax authorities, but that has not slowed the economy at all.
Switzerland always was more than secretive banks.
Capitalist to its core, Switzerland imposes
lighter taxes on individuals, consumers and corporations than the
Scandinavian countries do. In 2018 its top income tax rate was the lowest in
Western Europe at 36 percent, well below the Scandinavian average of 52
percent. Government spending amounts to a third of gross domestic product,
compared with half in Scandinavia. And Switzerland is more open to trade,
with a share of global exports around double that of any Scandinavian
economy.
Streamlined government and open borders have helped
make this landlocked, mountainous country an unlikely incubator of globally
competitive companies. To build wealth, a country needs to make rich things,
and an M.I.T. ranking of nations by the complexity of the products they
export
places Switzerland second behind Japan,
well ahead of the Scandinavian countries, whose average rank is 15.
The Swiss excel in just about every major
industry other than oil, often by targeting specialized niches, such as
biotech and engineering. The country is home to 13 of the top 100 European
companies, more than twice as many as in the three Scandinavian nations
combined. And most top Swiss firms dwarf Scandinavian peers. Nestlé, with a
stock market value of $320 billion, is 15 times larger than its closest
Scandinavian rival.
Though major multinationals are concentrated in
big cities, the Swiss economy is as decentralized as its political system.
Traveling southwest from Zurich to Geneva recently, I was struck by how many
iconic Swiss exports also originate in its provinces — Swiss Army knives
from Schwyz, watches from Bern, St. Bernard puppies from a mountain pass in
Valais, cheese and chocolates from Fribourg. Small companies anchor the
economy, accounting for two of every three jobs. Only one in seven Swiss
work for the government, about half the Scandinavian average.
No other nation’s currency has been rising
faster against its trading partners, and normally a rising franc should
erode Swiss exports by making them more expensive. Instead, while most rich
countries (including Scandinavia’s) saw their share of global exports fall
over the past decade, Switzerland’s continued to rise. Such is the
reputation of its engineers and chocolatiers that customers readily pay more
for Swiss goods.
The premium the world is willing to pay for
Swiss goods and services helps deter capital flight and stabilize the
economy. Switzerland has not been hit by a domestic financial crisis since
the 1970s; the Scandinavian countries were wracked by crises in the 1990s
and suffered sharper downturns than Switzerland did following the global
crisis of 2008.
If there is any fault line, it is that in
trying to slow the rise of the franc, Switzerland cut interest rates to
record lows ahead of its European peers, triggering a lending boom that has
driven private corporate and household debt up to 250 percent of G.D.P., a
risky height. No paradise is perfect.
For all its local charms, Switzerland is
worldly in the extreme. The Swiss are a polyglot mix of German, French and
Italian speakers, many intimidatingly fluent in multiple languages. The
foreign-born population has been increasing for more than a century and
accounts for a quarter of the whole, 40 percent non-European Union.
True, the rise of anti-immigrant parties across
Europe has an offshoot in Switzerland. The country has always been choosy,
accepting new arrivals based on their professional résumé more than family
ties or humanitarian need. But Australia and Canada also filter immigrants
to fill jobs and are widely studied models of how rich economies can survive
the aging of their domestic work forces.
Switzerland has been welcoming more immigrants
than any Scandinavian country since the 1950s. It is on track to accept more
than 250,000 immigrants between 2015 and 2020, expanding its population by 3
percent. That immigration rate is nearly double the Scandinavian average,
and one of the highest among large, developed countries. Immigrants are also
significantly more likely to hold jobs in Switzerland, in part because most
are required to land one before they arrive.
Continued in article
Jensen Comment
Comparisons of Switzerland with the USA is difficult because of the population
differences (less than 9 million residents versus over 350 million residents),
land mass differences, natural resource differences, ethnicity differences, and
the total lack of Swiss aspirations to get involved in foreign strife and wars.
The Swiss are very controlling about immigration whereas in the USA illegal
immigration is rampant. With controlled immigration Switzerland expands its
population by roughly 3% annually. In the USA legal (controlled) immigration is
nearly 5% whereas the undocumented immigrants in the USA comprise more than the
entire population of Switzerland. It's virtually impossible to determine the
exact number, but it's well in excess of 12 million.
Whereas Switzerland loves its brand of capitalism, a rising
population in the USA is clamoring for big government socialism and open
borders, especially among youth and universities. Not so in Switzerland. How
foolish!
Open immigration can’t exist with a strong social
safety net; if you’re going to assure healthcare and a decent income to
everyone, you can’t make that offer global ---
Paul Krugman
https://www.goodreads.com/quotes/724654-open-immigration-can-t-exist-with-a-strong-social-safety-ne
**
How to Mislead With Bad Analogies
"Under this plan, 45 percent (tantamount to
complete control) of the board of directors in any large corporation with
at least $100 million in annual revenue, corporations with at least $100 million
in balance sheet total, and all publicly traded companies will be directly
elected by the firm’s workers – similar to what happens under “employee
co-determination” in Germany, which long has had one of the most productive and
successful economies in the world."
Bernie Sanders
https://berniesanders.com/issues/corporate-accountability-and-democracy
Jensen Comment
Paul Krugman recently
wrote a piece defending Bernie Sanders' economics and plans for worker
control of corporations. Bernie Sanders skates on thin ice when comparing USA
corporations with German corporations. A most important difference in these two
nations is how capital investment is raised, especially high-risk financial
investment.. Germany traditionally never has had a lot
of success raising equity capital --- largely because of the lack of
control equity (capital stock) investors have on German corporations.
Historically up to and including today, German business
firms raise most of their capital from private sector banks that
limit the power that employees have on spending by corporations in Germany. In
the USA a much greatr share of corporate funding is raised from private sector
investors who have much more control of corporations and can greatly restrict
the power of workers to control how corporations spend their resources. Elon
Musk, for example, inhibits all efforts of Tesla employees to form unions.
Bernie Sanders wants to give workers and their unions complete
control of how large corporations in the USA spend their resources. Doing so
will among other things destroy the stock markets and accordingly all pension
funds now dependent upon stock prices. In a large corporation any shareholder
bloc that controls 45% of the shareholder vote essentially controls the company
(Elon Musk controls Tesla with a mere 22% oif Tesla's shares.)
What Bernie Sanders does not tell you is that he cannot have the
corporate democracy that he promises by giving workers control of large
companies in the USA. The reason is that those workers will not supply the
capital investments needed to create and sustain those companies. Therefore,
workers will have to bargain with the private sector to provide capital, and the
private sector will demand after-tax returns on their investments just like
German banks require after-tax returns on their investments in German
corporations.
And the German banks require thresholds of
after-tax returns which greatly limits the power of the German government
to tax those banks.
German corporations are not the worker honey pots that Sanders
wants for USA workers.
And for those who still argue in favor of the German way to raise
capital from the private sector, I remind you that Germany has no Silicon Valley
and has a poor track record for developing risky technology companies, new
patents for drugs (where over half come from the USA), If you want innovation
you have to somehow provide incentives to invest in high risk ventures.
German banks are not known for taking on great financial
risks.
New startup ventures are not flocking to Germany or trying to
sell their shares to German equity investors or German banks.
Chronicle of Higher Education: Free College Fantasy
https://reason.com/2019/12/09/ig-report-fbi-fisa-carter-page-trump-media/
The proposals floated by
presidential candidates are nonsensical. There’s a better way.
This
spring, Sen. Elizabeth Warren unveiled an
ambitious policy proposal:
a
$1.25-trillion plan to make college more affordable. It includes canceling
up to $50,000 in student-loan debt for 95 percent of borrowers, and putting
billions of dollars into historically black colleges and $100 billion in new
money toward the federal Pell Grant program.
Almost as
an afterthought, the plan also includes a proposal to make tuition free at
every public college and university in America. While light on details,
Warren’s version of free college seems to be
modeled after
Sen. Bernie Sanders’s. Sanders, of course, built his improbable 2016 primary
campaign in part by igniting millennial student debtors who were outraged by
the broken promise of affordable higher education. Now every serious
Democratic contender has had to propose some version of free college — or,
as Sen. Amy Klobuchar and Mayor Pete Buttigieg have done,
explain why not.
The broad
case for free college is strong. Many states have slashed public funding for
higher learning, shifting the burden to students and parents. Private
colleges, in pursuit of status and fame, have hiked prices into the
stratosphere. As real tuition at public universities
has tripled
over the
past three decades while middle-income wages have stagnated, the federal
government’s main response was to lend students ever-larger sums of money to
make up the difference, with no control over how much colleges charged or
whether the degrees were any good. It was a policy mistake of epic
proportions, leaving the path to economic mobility badly narrowed and a
generation of collegians saddled with unaffordable loans.
Continued in article
With new government programs will come price
controls. Medicare-for-All severely constrains what physicians, hospitals, and
other medical providers earn while at the same time setting new rules on work
loads. Free=College-for-All will greatly constrain what colleges and faculty
earn and add workload restrictions such as required teaching loads of four or
more courses per term. Leaves will be curtailed as well as research support.
In some European nations and elsewhere college and
trade skill training is free, but admission is restricted to the top third of
high school graduates ---
http://faculty.trinity.edu/rjensen/HigherEdControversies.htm#Tertiary
Restricting college and trade school admissions to the top third of high school
classes will never fly in the USA.
Furthermore the wages of teachers is severely limited in European nations and
class sizes are enormous.
For Democratic 2020 Presidential candidates the
media never reports the aggregated cost of promised for green
initiatives, free medical services, free medications, free nursing homes, free
college, free preschool, free housing, free food, guaranteed annual income,
reparations, open borders, legalized prostitution, etc. to the tune of over $10+
trillion per year. My guess is that
the total annual added aggregate cost for these promised programs is over $20
trillion per year.
Many voters for Trump would like to not vote for him
in 2020, but they may have to if the chosen Democratic Party contender intends
to ruin the USA economy.
Joe Biden Proposes $1 Trillion in New Corporate
Taxes ---
https://www.wsj.com/articles/joe-biden-proposes-1-trillion-in-new-corporate-taxes-11575492332?mod=djemCFO
Democratic presidential candidate Joe Biden proposed nearly $1 trillion in
new corporate taxes on Wednesday as he sought to generate more revenue to
pay for his policy plans on health care, climate, infrastructure and
education.
One of his new
taxes
would go after companies
such as
Amazon.com Inc. that
have years when they report profits to investors but show little or no U.S.
tax costs. A second would double the minimum tax rate on overseas income of
U.S.-based multinationals.
Until now, Mr. Biden has largely confined his ideas to rolling back parts of
the 2017 Republican tax cut and pursuing policies that the Democratic Obama
administration, in which he served as vice president, couldn’t get through
Congress.
The new proposals come atop Mr. Biden’s previous calls for tax increases,
which would push the corporate tax rate to 28% from 21%, tax unrealized
capital gains at death and push the top rate on individuals to 39.6% from
37%.
Mr. Biden’s proposed tax increases now total $3.2 trillion over a decade,
though his campaign confirmed on Wednesday that he also supports repealing
the $10,000 cap on the state and local tax deduction, a tax cut that would
disproportionately benefit some of the high-income households who would be
hit by his tax increases.
Still, Mr.
Biden’s tax plans are more modest than those of his main rivals for the
Democratic presidential nomination. Sens. Elizabeth Warren (D., Mass.) and
Bernie Sanders (I., Vt.)
have proposed wealth taxes on the super-rich.
Both of them, along with Mayor Pete Buttigieg, have called for returning the
corporate tax rate to 35%.
Jensen Comment
Continued in article
Jensen Comment
Bernie Sanders finally convinced Joe Biden as well as Elizabeth Warren that
voters are too stupid to understand how $1 trillion (or much more in the case of
Sanders and Warren) in new taxes is really a tax increase on the lower income
and middle income taxpayers. Biden at last believes that voters are too dumb to
understand that business firms don't pay taxes. Biden,
Sanders, and Warren think voters are just
too uneducated to understand that business firms don't pay taxes.
Instead business firms collect taxes from their customers. Nearly all companies
contributing to Biden's $1 trillion in new corporate taxes will raise prices to
(gasp) customers of Amazon, Walmart, etc. who mostly are lower and middle income
customers.
And tariffs will have to be increased on imported goods (think
sugar, TV sets, mobile phones and computers) to make it possible for USA
corporations to raise prices enough to collect the added trillion (or trillions)
in new business taxes.
In their zeal to attract ignorant voters, I don't think Biden,
Sanders, and Warren want to let on that taxing trillions from business firms and
investors will kill the stock markets. These politicians hope voters are too
stupid to realize how much their own futures depend on viable stock markets and
other capital markets. The vast pension funds of workers will get wiped out if
those capital markets get wiped out.
Biden,.Sanders, and Warren think voters are too stupid to realize
the mammoth size of the number $1 trillion or more in taxes. The CBO's estimated
total Federal revenue from all sources for 2019 is
$3.490 trillion ---
https://en.wikipedia.org/wiki/United_States_federal_budget
What's another trillion or more in new taxes?
As the saying goes: "The Road to Hell is Paved With Good Intentions."
Exhibit A is Venezuela.
Why is Capitalist Finland so Rich?
https://marginalrevolution.com/marginalrevolution/2011/03/why-is-finland-so-rich.html
Read the comments --- Finland encourages wealth incentives
Education in Finland, recipe for success?
https://marginalrevolution.com/marginalrevolution/2004/04/education_in_fi.html
Jensen Comment
One of the key differences between Finland and the USA, in my opinion, is that
Finland has a greater proportion of two-parent homes --- sounds so old fashioned
Honest Finland ---
https://en.wikipedia.org/wiki/Corruption_Perceptions_Index
The USA is dragged down by so much corruption in city, state, and federal
government, although business firms are often partners in this corruption
Demographics in Finland ---
https://en.wikipedia.org/wiki/Demographics_of_Finland
Low on racial diversity and immigration
Healthcare in Finland ---
https://en.wikipedia.org/wiki/Healthcare_in_Finland
The Dark Side (funding and sustainability) ---
https://www.cnn.com/2019/08/15/world/finland-health-care-intl/index.html
Religion in Finland ---
https://en.wikipedia.org/wiki/Religion_in_Finland#targetText=Finland is a
predominantly Christian,, Judaism, folk religion etc.
On the decline following a general trend in Europe
Sex in Finland ---
https://yle.fi/uutiset/osasto/news/study_more_finns_opting_for_solo_sexual_satisfaction/9090220
Is this a trend among all developed nations?
Bloomberg's Rankings of the Top 100 Business Schools ---
https://www.bloomberg.com/business-schools/regions/us
Jensen Comment
Whereas US News has multiple rankings for business studies specialties,
Bloomberg ignores specialties. Bloomberg also indicates scores on several
factors like entrepreneurship and compensation. The Bloomberg ranking
integrates graduate and undergraduate business schools which in some ways is
misleading. Note that the Bloomberg ranking ignores that some top schools do not
even have specialties such as tracks to take the CPA examination or forensic
accounting tracks. For example, students aspiring to for careers as CPAs will be
disappointed in top schools like Stanford, Dartmouth, and Harvard but not
Pennsylvania Wharton and UC Berkeley.
US News is a better source of multiple rankings and provides a "College
Compass" for finding fits for students with particular interests ---
https://www.usnews.com/usnews/store/college_compass.htm?src=web%3Acol_compass%3Ana%3Aalertbar%3A20180131
For employers, admission standards are the unmentioned criteria of great
importance. It's difficult to measure admission standards. For example,
rejection percentages are highly misleading since most students don't even
bother spend the time and and money applying to schools like Stanford and
Harvard. The upper-level GMAT students, on the other hand, often do not apply to
schools in the bottom half of the Bloomberg rankings unless there is some unique
geographic preference.
When asked to rank business schools employers may introduce subjective "best
buy" criteria. For example, some recruiters in the Boston area may consider
Bentley graduates to be a better buy than highly paid Harvard Business School
graduates.
The very top schools who get so many applicants with both stellar GMAT scores
and high undergraduate grades use added admissions criteria that are difficult
to quantify like undergraduate major (preferring engineers to elementary
education majors) and public service records (e.g., giving admission preference
to an applicant who taught computer programming in Tanzania as a volunteer?)
Why is Capitalist Finland so Rich?
https://marginalrevolution.com/marginalrevolution/2011/03/why-is-finland-so-rich.html
Read the comments --- Finland encourages wealth incentives
Education in Finland, recipe for success?
https://marginalrevolution.com/marginalrevolution/2004/04/education_in_fi.html
Jensen Comment
One of the key differences between Finland and the USA, in my opinion, is that
Finland has a greater proportion of two-parent homes --- sounds so old fashioned
Honest Finland ---
https://en.wikipedia.org/wiki/Corruption_Perceptions_Index
The USA is dragged down by so much corruption in city, state, and federal
government, although business firms are often partners in this corruption
Demographics in Finland ---
https://en.wikipedia.org/wiki/Demographics_of_Finland
Low on racial diversity and immigration
Healthcare in Finland ---
https://en.wikipedia.org/wiki/Healthcare_in_Finland
The Dark Side (funding and sustainability) ---
https://www.cnn.com/2019/08/15/world/finland-health-care-intl/index.html
Religion in Finland ---
https://en.wikipedia.org/wiki/Religion_in_Finland#targetText=Finland is a
predominantly Christian,, Judaism, folk religion etc.
On the decline following a general trend in Europe
Sex in Finland ---
https://yle.fi/uutiset/osasto/news/study_more_finns_opting_for_solo_sexual_satisfaction/9090220
Is this a trend among all developed nations?
**How to Mislead With Statistics
How Higher Education’s Data Obsession Leads Us Astray ---
https://www.chronicle.com/article/How-Higher-Education-s-Data/247409?utm_source=cr&utm_medium=en&cid=cr&source=ams&sourceId=296279
Has
there ever been an enterprise that produced so much data to so little effect
as higher education? We are drowning in data, awash in analytics. Yet,
critics demand even more data, contending that higher education remains
persistently opaque and lacking true accountability.
Here’s a heretical thought: Perhaps the problem
is not a lack of data, but rather, that metrics alone are a poor measure of
accountability. Our critics prefer lists over paragraphs, but sometimes
words are important to interpret statistics.
The data industry is huge, including magazine
rankings and credit-rating agencies; accreditors; and the mother of all data
collections, housed at the U.S. Department of Education: Ipeds, the
Integrated Postsecondary Education Data System. Easy access to voluminous
data allows just about anyone to extract random factoids as evidence to
assail or affirm collegiate value. Politicians assail high-tuition rates as
bad for consumers, but Moody’s rewards them for generating ever-higher
net-tuition revenues. Critics pummel elite universities for failing to
enroll enough low-income students, while berating colleges that enroll
majorities of Pell grantees for low graduation rates. More nuanced analyses
of the relationships among high-net tuition, volume of Pell grantees, and
graduation rates rarely make it into a public discussion that fixates on the
numbers, not the narrative.
Big data is helpful to understand megatrends like the
impact of student-debt burdens by race and ethnicity, the alarming growth in
discount rates, or changes in demand for majors. But statistics are no
substitute for professional judgment about the meaning of data for a
specific institution. Unfortunately, magazine rankings and the federal
College Scorecard choose to present
isolated data points as institutional quality measures without
interpretation.
Qualitative measures are also important for
accountability analysis. Rankings are silent on the ways in which the
first-year faculty members help students discover that they really can learn
statistics, write laboratory reports, analyze complex texts, conduct
research, or engage in professional work through internships. The College
Scorecard does not provide data on the campus climate for women or students
of color, or the scope of services for students with disabilities, or food
pantries and support for students who are also parents.
Accreditation has always been the place where
both quantitative and qualitative evidence is presented within the larger
institutional context; interpretation of performance data through the lens
of mission and student-body characteristics is essential to level-set the
basis for continuous quality improvement. Even more important are the
collegial conversations among visiting teams, institutional leaders, and
faculty to focus on challenges needing serious repair and opportunities to
move forward constructively. Those conversations, summarized in team
reports, often remain private, a fact that frustrates critics craving public
shaming of institutions that fall outside of traditional benchmarks.
In recent years, pushed by the critics who push
Congress and the U.S. Department of Education, accreditation has inexorably
moved toward even more data-driven assessment processes in both regional and
specialized accreditation. Whether this migration has produced more
accountability is unclear. While the idea of self-study and collegial peer
review continues, the hegemony of data analytics threatens to diminish the
most useful parts of the accreditation process in the collegial discussions
that honor mission and institutional context while also challenging
institutions to improve.
Some elite universities lobbied for this change on theory that if they surpass some normative benchmarks, they should not have
to bear the burden of the more onerous hands-on accreditation processes
beyond, perhaps, cursory reviews. Aside from the arrogance of insisting that
some universities are above collegial scrutiny (the climate that fostered
the Varsity Blues scandal notwithstanding), the use of data to exonerate
wealthy elite schools also perpetuates higher education’s caste system.
Institutions serving large numbers of at-risk students will probably not
qualify for lesser scrutiny since their
students move through college at variance from traditional norms; the more
variance, the deeper the scrutiny.
Continued in article
Jensen Comment
There's a difference between having too much data versus conducting studies that
mislead with that data. The main argument about having too much data is that too
much is being spent (in time and money) collecting it. The main argument about
misleading data can be found in the many examples of how it is misleading us ---
http://faculty.trinity.edu/rjensen/MisleadWithStatistics.htm
**How
to Mislead With Statistics
The Guardian: The 20 firms behind a third of all carbon
emissions
https://www.theguardian.com/environment/2019/oct/09/revealed-20-firms-third-carbon-emissions
Jensen
Comment
The article is misleading in a number of ways, firstly by failing to stress that
most of the increased carbon emissions are natural phenomena that are not caused
by mankind ---
https://en.wikipedia.org/wiki/Greenhouse_gas#Natural_and_anthropogenic_sources
The
second way the article is misleading is that it seems to imply that if we simply
banned those 20 companies from existence the carbon emissions on earth would
decline by a third. The fact of the matter is that people would simply grasp at
whatever other means are possible to heat their dwellings, power their
electricity, be transported from place to place, etc. Up here in New England we
would heat our homes and generate our electricity by decimating our forests ---
which is counter productive since all the carbon absorbing trees would be taken
from the earth. People in the southern USA sweltering in heat would find ways to
cool off by consuming vastly more water --- not exactly what environmentalists
hope for given the increasing scarcity of water.
Add to
this the impact of famine, job losses, and destruction of entire economies if we
tried to abruptly terminate the oil and gas infrastructure. Mad Max would become
an overnight reality ---
https://en.wikipedia.org/wiki/Mad_Max
Having
said this does not the world is simply ignoring the problem. Even the 20 firms
featured in this article are diversifying into energy alternatives that emit
less carbon --- including solar, wind power, and hydrogen initiatives.
And
there's the possibility that fanatics will impose drastic solutions that are
hopeless from the start ---
The New Yorker: The climate apocalypse is
coming. To prepare for it, we need to admit that we can’t prevent it ---
https://www.newyorker.com/culture/cultural-comment/what-if-we-stopped-pretending
**How
to Mislead With Statistics
Walter E. Williams: Idiotic Environmental Predictions ---
https://townhall.com/columnists/walterewilliams/2019/10/09/idiotic-environmental-predictions-n2554294?utm_source=thdaily&utm_medium=email&utm_campaign=nl&newsletterad=10/09/2019&bcid=b16c6f948f297f77432f990d4411617f&recip=17935167
The Competitive Enterprise Institute has published a new
paper, "Wrong Again: 50 Years of Failed Eco-pocalyptic Predictions." Keep in
mind that many of the grossly wrong environmentalist predictions were made
by respected scientists and government officials. My question for you is: If
you were around at the time, how many government restrictions and taxes
would you have urged to avoid the predicted calamity?
As reported in The New York Times (Aug. 1969) Stanford
University biologist Dr. Paul Erhlich warned: "The trouble with almost all
environmental problems is that by the time we have enough evidence to
convince people, you're dead. We must realize that unless we're extremely
lucky, everybody will disappear in a cloud of blue steam in 20 years."
In 2000, Dr. David Viner, a senior research scientist at
University of East Anglia's climate research unit, predicted that in a few
years winter snowfall would become "a very rare and exciting event. Children
just aren't going to know what snow is." In 2004, the U.S. Pentagon warned
President George W. Bush that major European cities would be beneath rising
seas. Britain will be plunged into a Siberian climate by 2020. In 2008, Al
Gore predicted that the polar ice cap would be gone in a mere 10 years. A
U.S. Department of Energy study led by the U.S. Navy predicted the Arctic
Ocean would experience an ice-free summer by 2016.
In May 2014, French Foreign Minister Laurent Fabius declared
during a joint appearance with Secretary of State John Kerry that "we have
500 days to avoid climate chaos."
Peter Gunter, professor at North Texas State University,
predicted in the spring 1970 issue of The Living Wilderness: "Demographers
agree almost unanimously on the following grim timetable: by 1975 widespread
famines will begin in India; these will spread by 1990 to include all of
India, Pakistan, China and the Near East, Africa. By the year 2000, or
conceivably sooner, South and Central America will exist under famine
conditions. ... By the year 2000, thirty years from now, the entire world,
with the exception of Western Europe, North America, and Australia, will be
in famine."
Ecologist
Kenneth Watt's 1970 prediction was, "If present trends continue, the world
will be about four degrees colder for the global mean temperature in 1990,
but eleven degrees colder in the year 2000." He added, "This is about twice
what it would take to put us into an ice age."
Mark J. Perry, scholar at
the American Enterprise Institute and professor of economics and finance at
the University of Michigan's Flint campus, cites 18 spectacularly wrong
predictions made around the time of first Earth Day in 1970. This time it's
not about weather. Harrison Brown, a scientist at the National Academy of
Sciences, published a chart in Scientific American that looked at metal
reserves and estimated that humanity would run out of copper shortly after
2000. Lead, zinc, tin, gold and silver would be gone before 1990. Kenneth
Watt said, "By the year 2000, if present trends continue, we will be using
up crude oil at such a rate ... that there won't be any more
crude oil."
Continued in article
The New Yorker: The climate apocalypse is
coming. To prepare for it, we need to admit that we can’t prevent it ---
https://www.newyorker.com/culture/cultural-comment/what-if-we-stopped-pretending
Jensen Comment
The problem with prior idiotic predictions is that they are like the boy who
cried wolf repeatedly ---
https://en.wikipedia.org/wiki/The_Boy_Who_Cried_Wolf
When the real wolf is lurking many people ignore the warnings.
How Fact Checkers Mislead With Statistics
Ilhan Omar Defended by Media and Fact Checkers ---
https://townhall.com/columnists/johnrlottjr/2019/07/31/ilhan-omar-defended-by-media-and-fact-checkers-n2550908?utm_source=thdaily&utm_medium=email&utm_campaign=nl&newsletterad=07/31/2019&bcid=b16c6f948f297f77432f990d4411617f&recip=17935167
Jensen Comment
The way fact checkers mislead with statistics is in selectivity bias by not fact
checking claims they agree with politically.
**How
to Mislead With Statistics
NYT:
The Rich Really Do Pay Lower Taxes Than You ---
https://www.nytimes.com/interactive/2019/10/06/opinion/income-tax-rate-wealthy.html
Jensen
Comment
The article is misleading in two major respects. Firstly, the title implies that
the rich pay less taxes than you. How can that be true
since nearly half the USA "taxpayers" who file tax returns pay zero income taxes
---
Washington Post:
https://www.washingtonpost.com/blogs/fact-checker/post/a-fierce-tax-debate-without-much-light/2012/06/18/gJQAijuEmV_blog.html
Add to that the number, millions *rich and poor) in the underground
economy, who don't even file tax returns.
Add to that the fact that the rich pay more in other taxes, especially property
taxes that largely fund USA K-12 schools.
This
does not mean that the rich are paying as much as they should be paying, and the
rich have tax havens and other tax avoidance/deferral strategies (legal
andillegal) to reduce their income taxes. But it is false to write that "The
Rich Really Do Pay Lower Taxes That You." The rich in general pay more taxes
than you. They just don't usually pay as much as they should be paying. But
that's a different statement.
U.S. Taxes are Progressive: Comment on “Progressive Wealth
Taxation” ---
http://www.davidsplinter.com/Splinter-TaxesAreProgressive.pdf
U.S. federal taxes are
progressive, as shown by Congressional Budget Office and Tax Policy Center
estimates, with average tax rates increasing with income. In fact, the OECD
(2011) estimated that the U.S. has the most progressive household taxes
among developed countries. Moreover, the 2017 tax reform is expected to have
little effect on overall tax progressivity (Tax Policy Center, 2017; Joint
Committee on Taxation, 2019). But Saez and Zucman (2019) argue that average
tax rates are nearly equal over the income distribution. To examine this
claim, this paper compares other estimates of average tax rates by income
group, all of which suggest a high degree of progressivity. Three issues are
found to bias the average tax rates presented in Saez and Zucman (2019).
After correcting for these issues, their estimates align more closely with
other estimates that show U.S. taxes are progressive.
I. Comparing Estimates
of Average Tax Rates There are two types of average tax rate estimates in
the literature, one based on federal taxes and another on taxes from all
sources. Figure 1 considers average federal tax rates over the income
distribution, showing estimates from Piketty and Saez (2007), Tax Policy
Center (2018, hereafter TPC), Congressional Budget Office (2019, hereafter
CBO), and Auten and Splinter (2019, hereafter AS). The left side presents
tax rates excluding payroll taxes.2 For 2004, Piketty and Saez (2007)
estimated a second quintile average tax rate of –1%, with the negative rate
resulting from refundable credits, while the top 0.01 percent tax rate was
33%. The other three estimates are for 2014, with CBO and TPC estimating
bottom quintile tax rates of –8% and –4% and top 1 percent rates of 32% and
31%. AS estimated a bottom 50 percent tax rate of 2% and a top 1 percent
rate of 29%. These average tax rates increase with income, suggesting
significant progressivity.
Figure 1, right side,
includes payroll taxes. This generally increases federal tax rates by about
10 percentage points for the bottom 99 percent of the income distribution
and 2 percentage points for the top 1 percent—a result of the Social
Security contribution taxable maximum.3 Average tax rates taxes are very
similar among these four estimates and imply a highly progressive federal
tax system.4 The Joint Committee Taxation (2019) also estimated average
federal tax rates. For 2019, before accounting for the effects of the 2017
tax reform, these tax rates almost exactly match those of Piketty-Saez. For
2015, U.S. Treasury (2015) data indicate that average federal tax rates were
more progressive than those presented in Figure 1: rangin
from –5% for the bottom
quintile to 39% for the top 0.1 percent.5 Note that Figure 1 exaggerates the
share of the population at the top. While this emphasizes differences in top
tax rates, Figure 2 instead uses an equal-spacing approach that shows how
average tax rates truly spike for a small share at the top of the
distribution.
. . .
Saez and Zucman (2019)
argue that the U.S. has a relatively proportional tax system across all
income levels. However, federal taxes are progressive, as shown by Piketty
and Saez (2007), Auten and Splinter (2019), The Urban-Brookings Tax Policy
Center, the Joint Committee on Taxation, the U.S. Treasury, and the
Congressional Budget Office. Three issues with the Saez and Zucman (2019)
methodology for calculating tax rates are shown to explain much of their
deviation from other measures.
The
second thing that is misleading is that the article implies that back in the
1950s when the tax rates on high income people were much higher (think 70%) that
the rich really paid those high rates. Multimillionaire Bing Crosby was
not paying 70% in 1950. The rich took advantage of tax loopholes as much
or more in the 1950s as they do in the 21st Century. And the levies for state
income taxes and property taxes were much, much lower.
NY Times:
Warren Wealth Tax Would Slow Economic Growth By 13% According To Penn Wharton
Budget Model ---
https://www.nytimes.com/2019/11/14/business/warren-wealth-tax-economy.html
Larry Summers ---
https://en.wikipedia.org/wiki/Lawrence_Summers
Summers on the Wealth Tax ---
https://marginalrevolution.com/marginalrevolution/2019/10/summers-on-the-wealth-tax.html
Larry Summers is my favorite liberal economist
because even while maintaining his liberal values he never stops thinking
like an economist. That makes him suspect among the left but it means that
he is always worth listening to. The video below with Saez, Summers and
Mankiw (with Rampell moderating) is excellent throughout. I cribbed a number
of points from Summers:
“I have studied last week’s
twitter war very carefully and I have to say that I am 98.5% convinced by
the critics that the Zucman-Saez data are substantially inaccurate and
misleading.”
The arguments around political
power are not persuasive. Most of what is wrong with politics is because
that is what the people want (I’m filling in a bit here from comments
throughout). A wealth tax does nothing about corporate lobbying and would
increase the incentive to give to
political organizations. If you cut wealth at the top by 30% that wouldn’t
change relative political power in the slightest.
Wealth is up in large part
because interest rates are down which means that permanent income hasn’t
increased.
Forced savings programs like
social security and unemployment insurance mean that people at the bottom
need to save less and thus their wealth falls even as their welfare
increases.
A wealth tax increases the
incentive to consume instead of save and invest.
On employee stock ownership
plans: “When you put workers in control of firms and you give them
substantial control–see Israeli kibbutz’s, see Yugoslav cooperatives, see
universities where faculties have a powerful voice–the one thing you do
not get is expansion. You get more
for the people who are already there. That does not seem to be an attractive
position for progressives.”
In the Q&A Summers just goes to
town on Saez when Saez claims 90% tax rates are a great American invention.
“The people who were around in the Kennedy administration who were at least
as progressive as you are were united in the belief that 90% tax rates were
a bad idea….The number of people who paid those 90% tax rates was trivial
and it wasn’t because there weren’t a lot of rich people.” Greg Mankiw, who
gives a nice parable in his remarks, has to stifle a laugh as Summers lets
rip.
Jensen
Comment
I've no objection to a modest wealth tax that does not badly destroy the wealth
tax. But to raise $20+ trillion annually needed to fund Democratic Party
spending proposals (Green Initiative, free medical care, free medicines, free
college, guaranteed annual income for 350+ million USA residents, reparations,
open borders, etc.) would wipe out the stock markets. That, in turn, would wipe
out most pension funds in the USA and make it impossible for business firms to
raise capital. In short it means the destruction of capitalism where
business firms raise capital from the private sector.
**How
to Mislead With Statistics
The Wealth Tax Runs Counter to the Objectives of Its Advocates
Comment on “Progressive Wealth Taxation” by Saez and Zucman prepared for the
Fall 2019 issue of Brookings Papers on Economic Activity ----
http://www.columbia.edu/~wk2110/bin/BPEASaezZucman.pdf
Emmanuel Saez and Gabriel Zucman offer a
discussion of rationale for, implementation and implications of introducing
wealth taxation in the United States. In my comments, I will primarily focus
on three topics: economic arguments for having this form of taxation,
practical issues in implementing it, and a few aspects of underlying data
and assumptions that authors rely on in evaluating the impact of this
proposal.
A general wealth tax does not exist in the
United States. However, the U.S. has a highly progressive estate tax and it
taxes capital income through a mix of (1) personal income taxes on
dividends, interest, capital gains, royalties and business incomes, and (2)
corporate taxation. Bases of all these taxes overlap with the base for
wealth taxation, although they are not economically or administratively
identical. Thus, the right question in my mind is whether a wealth tax is
desirable given existence of these other instruments. In my view, as
elaborated below, the case for wealth taxation over capital income taxation
in general is quite weak and rests on either desirability of one time
,ideally unexpected, taxation or on the presence of externalities from
wealth concentration (that ideally should be treated using instruments
tailored to specific problems). From the administrative point of view, even
then the challenging and ambitious solutions that could make wealth tax
feasible apply equally well to (otherwise preferred) capital income
taxation.
The case that authors make is not helped by
optimistic empirical assumptions that do not highlight uncertainty, which is
likely to run mostly in one direction; that may be a plus for public
presentation of the plan, but not for an economist. I discuss these issues
at the end of the comment.
Continued in article
Jensen
Comment
Along with destruction of pension fund investments in failed stock markets.
Taxing The “Rich” Won’t Pay For Politicians’ Promises ---
https://taxprof.typepad.com/taxprof_blog/2019/10/taxing-the-rich-wont-pay-for-politicians-promises.html
Hillary Clinton Is Not a Fan of Bernie’s or Warren’s Wealth Taxes
---
Click Here
She thinks they’re “unworkable” and would be “incredibly disruptive.”
Chronicle of Higher Education: Free College Fantasy
https://reason.com/2019/12/09/ig-report-fbi-fisa-carter-page-trump-media/
The proposals floated by
presidential candidates are nonsensical. There’s a better way.
This
spring, Sen. Elizabeth Warren unveiled an
ambitious policy proposal:
a
$1.25-trillion plan to make college more affordable. It includes canceling
up to $50,000 in student-loan debt for 95 percent of borrowers, and putting
billions of dollars into historically black colleges and $100 billion in new
money toward the federal Pell Grant program.
Almost as
an afterthought, the plan also includes a proposal to make tuition free at
every public college and university in America. While light on details,
Warren’s version of free college seems to be
modeled after
Sen. Bernie Sanders’s. Sanders, of course, built his improbable 2016 primary
campaign in part by igniting millennial student debtors who were outraged by
the broken promise of affordable higher education. Now every serious
Democratic contender has had to propose some version of free college — or,
as Sen. Amy Klobuchar and Mayor Pete Buttigieg have done,
explain why not.
The broad
case for free college is strong. Many states have slashed public funding for
higher learning, shifting the burden to students and parents. Private
colleges, in pursuit of status and fame, have hiked prices into the
stratosphere. As real tuition at public universities
has tripled
over the
past three decades while middle-income wages have stagnated, the federal
government’s main response was to lend students ever-larger sums of money to
make up the difference, with no control over how much colleges charged or
whether the degrees were any good. It was a policy mistake of epic
proportions, leaving the path to economic mobility badly narrowed and a
generation of collegians saddled with unaffordable loans.
Continued in article
With new government programs will come price
controls. Medicare-for-All severely constrains what physicians, hospitals, and
other medical providers earn while at the same time setting new rules on work
loads. Free=College-for-All will greatly constrain what colleges and faculty
earn and add workload restrictions such as required teaching loads of four or
more courses per term. Leaves will be curtailed as well as research support.
In some European nations and elsewhere college and
trade skill training is free, but admission is restricted to the top third of
high school graduates ---
http://faculty.trinity.edu/rjensen/HigherEdControversies.htm#Tertiary
Restricting college and trade school admissions to the top third of high school
classes will never fly in the USA.
Furthermore the wages of teachers is severely limited in European nations and
class sizes are enormous.
For Democratic 2020 Presidential candidates the
media never reports the aggregated cost of promised for green
initiatives, free medical services, free medications, free nursing homes, free
college, free preschool, free housing, free food, guaranteed annual income,
reparations, open borders, legalized prostitution, etc. to the tune of over $10+
trillion per year. etc. My guess is that
the total annual added aggregate cost for these promised programs is over $20
trillion per year --- well over four times what the government now spends for
everything in the Federal budget.
Many voters for Trump would like to not vote for him
in 2020, but they may have to if the chosen Democratic Party contender intends
to ruin the USA economy.
Joe Biden Proposes $1 Trillion in New Corporate
Taxes ---
https://www.wsj.com/articles/joe-biden-proposes-1-trillion-in-new-corporate-taxes-11575492332?mod=djemCFO
Democratic presidential candidate Joe Biden proposed nearly $1 trillion in
new corporate taxes on Wednesday as he sought to generate more revenue to
pay for his policy plans on health care, climate, infrastructure and
education.
One of his new
taxes
would go after companies
such as
Amazon.com Inc. that
have years when they report profits to investors but show little or no U.S.
tax costs. A second would double the minimum tax rate on overseas income of
U.S.-based multinationals.
Until now, Mr. Biden has largely confined his ideas to rolling back parts of
the 2017 Republican tax cut and pursuing policies that the Democratic Obama
administration, in which he served as vice president, couldn’t get through
Congress.
The new proposals come atop Mr. Biden’s previous calls for tax increases,
which would push the corporate tax rate to 28% from 21%, tax unrealized
capital gains at death and push the top rate on individuals to 39.6% from
37%.
Mr. Biden’s proposed tax increases now total $3.2 trillion over a decade,
though his campaign confirmed on Wednesday that he also supports repealing
the $10,000 cap on the state and local tax deduction, a tax cut that would
disproportionately benefit some of the high-income households who would be
hit by his tax increases.
Still, Mr.
Biden’s tax plans are more modest than those of his main rivals for the
Democratic presidential nomination. Sens. Elizabeth Warren (D., Mass.) and
Bernie Sanders (I., Vt.)
have proposed wealth taxes on the super-rich.
Both of them, along with Mayor Pete Buttigieg, have called for returning the
corporate tax rate to 35%.
Jensen Comment
Continued in article
Jensen Comment
Bernie Sanders finally convinced Joe Biden as well as Elizabeth Warren that
voters are too stupid to understand how $1 trillion (or much more in the case of
Sanders and Warren) in new taxes is really a tax increase on the lower income
and middle income taxpayers. Biden at last believes that voters are too dumb to
understand that business firms don't pay taxes. Biden,
Sanders, and Warren think voters are just
too uneducated to understand that business firms don't pay taxes.
Instead business firms collect taxes from their customers. Nearly all companies
contributing to Biden's $1 trillion in new corporate taxes will raise prices to
(gasp) customers of Amazon, Walmart, etc. who mostly are lower and middle income
customers.
And tariffs will have to be increased on imported goods (think
sugar, TV sets, mobile phones and computers) to make it possible for USA
corporations to raise prices enough to collect the added trillion (or trillions)
in new business taxes.
In their zeal to attract ignorant voters, I don't think Biden,
Sanders, and Warren want to let on that taxing trillions from business firms and
investors will kill the stock markets. These politicians hope voters are too
stupid to realize how much their own futures depend on viable stock markets and
other capital markets. The vast pension funds of workers will get wiped out if
those capital markets get wiped out.
Biden,.Sanders, and Warren think voters are too stupid to realize
the mammoth size of the number $1 trillion or more in taxes. The CBO's estimated
total Federal revenue from all sources for 2019 is
$3.490 trillion ---
https://en.wikipedia.org/wiki/United_States_federal_budget
What's another trillion or more in new taxes?
As the saying goes: "The Road to Hell is Paved With Good Intentions."
Exhibit A is Venezuela.
NY Times: Democratic Presidential Tax Plans Would Hit Blue States The
Hardest ---
https://taxprof.typepad.com/taxprof_blog/2019/11/ny-times-democratic-presidential-tax-plans-would-hit-blue-states-the-hardest.html
New York Times, How
Democrats Would Tax High-Income Professionals (Not Just the Mega-Rich):
Moody’s data shows that
higher taxes would be paid disproportionately in Democratic-leaning states.
Much of the Democratic
primary race has focused on taxes aimed at the billionaire class — policies
devised to reduce inequality and fund progressive goals on health care and
education.
But there’s also a less
discussed tax increase in leading Democratic policy proposals that would
affect not just a tiny sliver of the ultra-wealthy, but also millions of
high-income workers. For these people, many of them affluent professionals
in Democratic strongholds, it would be the biggest tax increase in recent
memory.
This year, American workers
and their employers owe a combined 12.4 percent on Social Security payroll
taxes for income up to $132,900 (rising to $137,700 in 2020). They owe
nothing on earnings above that level.
Some Democrats in the thick
of the presidential race and on Capitol Hill now seek to change or eliminate
that cap — potentially placing a new double-digit tax on high earners, with
several plans focusing on earnings above $250,000. ...
Moody’s data also shows
that the higher taxes would be paid disproportionately in Democratic-leaning
states. The 12 states with the highest share of earners who would owe higher
taxes all voted for Hillary Clinton in the 2016 election, led by New Jersey,
Connecticut and Massachusetts.
Jensen Comment
The most liberal candidates spending plans for green initiatives, free medical
services, free medications, free nursing homes, free college, free preschool,
free housing, free food, guaranteed annual income, reparations, open borders,
legalized prostitution, etc. to the tune of over $10+ trillion per year.
How to Mislead With Statistics
To combat the COVID-19
economic downturn, New Jersey Governor Phil Murphy passed a millionaire's tax.
Here's why he says that's good for everyone ---
https://www.businessinsider.com/nj-gov-phil-murphy-millionaires-tax-will-help-middle-class-2020-11
This year, New Jersey Governor Phil Murphy and the state legislature agreed
on a deal to raise the income tax by 2% on incomes over $1 million per year
to address the budget crisis brought on by the pandemic. Not only will this
tax help administer coronavirus relief to the communities and small
businesses that need it most, but it will also help rebalance a regressive
state tax code which puts a bigger tax burden on poorer households.
In this week's episode of Pitchfork
Economics,
David Goldstein and Nick Hanauer interview Governor Murphy about his
decision to tax the rich.
Murphy, a
millionaire former Goldman Sachs executive, wants to be very clear that he's
not fomenting class warfare.
"We don't begrudge people's
success," Murphy began. "Whether you're a wealthy individual or a large
corporation — we want more of each in New Jersey."
But Murphy says he raised
the tax because "I got elected to stand for a stronger, fairer New Jersey
that works for not just some, but for everybody." That meant asking the
wealthiest New Jerseyans to "help us rebuild our middle class."
From the beginning, Murphy
laid out the conditions for the tax very clearly: "Anyone earning a million
dollars and up, we're asking you to pay a few pennies more, and we'll put
every dime of that into the middle class."
Continued in article
Taxes are about to rise for
New Jersey millionaires. There aren’t many ways to duck the levies ---
https://www.cnbc.com/2020/09/24/taxes-are-about-to-rise-for-new-jersey-millionaires.html
. . .
“New Jersey is one of the more painful
states to really tax plan for,” said Albert J. Campo, CPA and managing
partner at AJC Accounting Services in Manalapan, New Jersey.
“Anyone who’s $1 million and up is
getting substantial benefits (tax breaks) at the federal level, but they’re
somewhat limited at the state level.”
The Garden State is known as a “gross
income” state, and that means certain exclusions and deductions are off the
table on state tax returns.
For instance, contributions you make
to a workplace retirement plan reduce your taxable income on your federal
return.
In New Jersey, only contributions to
401(k) plans are excludible from wages. Amounts you divert to a deferred
compensation plan or any other retirement plan – including 403(b) or 457
plans -- are not excludible from your pay.
Another quirk: People who itemize on
their federal income tax return can claim a write-off for charitable giving.
New Jerseyans, however, can’t do this on their state return.
Earlier this year, Garden State legislators
put forth a proposal to allow a gross
income tax deduction for
contributions made to certain New Jersey-based charitable organizations
during the pandemic. That measure is pending.
See here for
a list of items that can’t be excluded from wages in New Jersey.
There are a few moves
high-income households can take to lower their income if they’re close to
the margins and a couple of thousand dollars away from the steeper tax rate,
according to Alan Sobel, CPA at Sobel & Co. in Livingston, New Jersey, and
president of the New Jersey Society of CPAs:
-
Increase your 401(k) plan contributions: It’s
the one retirement plan contribution that can let you lower wages on
your New Jersey tax return.
-
Drawing down portfolio income? Consider tax-exempt
bonds: Garden
State municipal bonds can create income that’s free from federal and
state income tax.
-
Gift assets to family members in lower tax brackets: “This
way, the income is going to them and not you,” said Sobel. Be aware this
is a long-term play. You should coordinate with your accountant, estate
attorney and family members before making these gifts.
Continued in article
Jensen Comment
But in both the federal and state jurisdictions, millionaires often defer more
income tax than they report due to capital gains and losses, often value changes
that are highly volatile and highly subjective in measurement. For example,
owners of Tesla shares can see the values of their unsold shares bounce up and
down like a basketball.
Ten different real estate
appraisers may give you ten highly different value estimates of a 100 acre
parcel of land on the outskirts of Newark, the value of which may be highly
dependent upon where locations of future roads, road exits, train tracks, and
bridges are built. Ups and downs in values of such investments are unknown in
amount until sales transactions actually take place.
For the same reason, it's
virtually impossible to compare total wealth of most millionaires and
billionaires. The estimated wealth of such persons vary widely in the eyes of
different appraisers. In estate value disputes it's often the courts that have
to set values, and the courts do not have magical measurement wands any better
than the wands all disputing appraisers. The courts merely have the power to set values
when disputing value appraisers cannot agree.
My best example of
where the court resolved highly varying value estimates of finance
models is:
Questrom vs. Federated Department Stores, Inc.: A Question of Equity
Value," by University of Alabama faculty members by Gary
Taylor, William Sampson, and Benton Gup, May 2001 edition of Issues
in Accounting Education
---
http://faculty.trinity.edu/rjensen/roi.htm
One thing is certain is that
the federal government under Biden and Harris will soon impose heavy new taxes
on the same "millionaires" in New
Jersey and millionaires in all the other 49 states. This will soon become a taxing
time for high earners and wealthy people in the USA.
I think the Governor of New
Jersey overstates the case that his proposed "millionaires" tax will not lead to exodus of a significant
number of high earning citizens to move elsewhere or be a barrier to such
citizens that might move into New Jersey. New Jersey already has nearly the
highest state taxes for citizens at all levels of income. The problem with the causal
factors that inspire movements of households is that there are many such factors
that are highly interactive.
Consider me as an example,
although my income is way too low to qualify for the new millionaire tax in New
Jersey. When I retired in San Antonio, Texas my wife and I wanted to move out of
the heat, humidity, and congestion of a big city. We also wanted to be closer to
family. We have two children living in northern California, one living in
Wisconsin, and two in northern Maine. Almost like New Jersey, those three states
are among the highest taxing states in the USA. Having family within driving
distance was the primary consideration for where to move, but environmental
beauty and state taxation were interactive causal factors in choosing where to
retire. We thus narrowed our search down to northern Nevada next to California
or northern New Hampshire next to Maine. We found a mountain cottage in northern
New Hampshire that is within five hours of driving to where two of our children
live in Maine ---
http://faculty.trinity.edu/rjensen/Pictures.htm
State taxation was not the
primary causal factor for choosing to retire in New Hampshire, but the fact that
New Hampshire has no income tax and no sales tax was an interactive causal
factor that led us to choose New Hampshire over California, Wisconsin, and
Maine. If we had children in New Jersey we probably would've retired in a nearby
state with lower taxes. Never New Jersey!
My point here is some people
will avoid living in a state with very high taxes being the main reason. Others,
like my wife and I, left Texas primarily for reasons not affected by taxation.
But when choosing where to retire taxation became an interactive causal factor
--- along with other factors like not wanting to live in a city, having nice
surroundings like mountains, and having nearby family in an adjoining state.
New Jersey's
enormous state taxes have primarily or interactively been a factor in
keeping many people from wanting to live there. Adding more taxes to already
high taxes may be hurting more than helping revenue taxes in New Jersey,
the second highest taxing state in the USA.
People who can now work remotely are
leaving New York, New Jersey, and Silicon Valley in droves.
NYSE and Nasdaq threaten to
leave New Jersey if transaction tax goes ahead ---
https://www.datacenterdynamics.com/en/news/nyse-and-nasdaq-threaten-leave-new-jersey-if-transaction-tax-goes-ahead/
The New York Stock Exchange (NYSE) has threatened
New Jersey lawmakers it will move its data operations out of state if taxes
are imposed on electronic trades.
Nasdaq has also come out against the tax, saying it
is in talks with Texas as a future home.
New
Jersey is proposing a hundredth-a-cent tax on every financial transaction
processed in the state. The transaction tax won favor amongst politicians
and also of Governor Phil Murphy and Senate President Steve Sweeney back
when it was introduced
in July.
At the time it was set to charge a quarter-of-a-cent ($0.0025), but has been
scaled back due to the stock markets' resistance.
If implemented, New Jersey’s financial transaction tax would be a flat-rate
levy imposed per instrument, not per trade. Lawmakers believe it could
harvest about $500m each year or $1bn over the tax’s two year lifetime.
The securities industry in New Jersey employs about 38,000 people and pays
nearly $1.4bn in state and local taxes.
The
Assembly of Financial Institutions and Insurance Committee held a virtual
public hearing on Monday, as reported by NJ.com.
The tax would be paid by companies operating data centers specializing in
financial trades. Many such facilities are based out of New Jersey's
suburban districts like Mahwah, Secaucus, and Carteret.
In the past, proximity to Wall Street made it sensible for data centers to
be nearby for low latency trading, however, the market has now been testing
whether it can operate out-of-state.
Back in September and earlier this month, the NYSE simulated a trading day
using its backup data center in Chicago. This was a practice for any
possible relocation of the market to data centers out of New Jersey. The
co-head of government affairs for the NYSE, Hope Jarkowski, said: “From Sept
28 to Oct 2, we moved our production servers for our NYSE Chicago exchange
out of New Jersey to our secondary data center… Proximity to New York City
is no longer relevant in today’s trading environment."
She added: “We understand why a financial transaction tax, or FTT as it’s
commonly known, may be perceived as a silver bullet that can remedy or
offset financial hardship with little effect on the financial markets
themselves, impacting perhaps only big corporations or wealthy individuals.
In reality, this tax would be imposed on a processor of transactions but
would be passed along to a purchaser or seller.
"That said, these harms will never come to pass," she added, "because those
with obligations to their investor clients will simply move their business
out of New Jersey to avoid harm, leaving no transactions in New Jersey to
tax and undermining the revenue-generating aim of an FTT.”
Nasdaq also threatened to leave if any transaction tax was put in place and
said it is currently in talks with Texas Governor Greg Abbott about
relocating trading systems to the Dallas-Fort Worth area. Several other
unnamed states are also said to be talking to Nasdaq.
New Jersey Governor Phil Murphy revealed he has been in talks with market
representatives to get them on side. At a Covid-19 briefing on
Monday,
he said: “We’ve had - I thought - constructive discussions with Nasdaq and
the New York Stock Exchange. They’ve expressed their concerns. I can’t read
their minds. But the fact that we are in an hour of need, this is not a
'forever and always' consideration. I think our side of the argument is also
reasonable... we shall see. This is something we still are studying and we
still like what we see, but it’s complicated, there’s no question about it.”
Continued in article
**How to Mislead With Statistics
TripAdvisor, Hajj
Ratings or Ummah.com
:
Everything in Mecca gets 5 stars — and online reviews of other holy sites are
wildly inflated, too ---
https://theconversation.com/everything-in-mecca-gets-5-stars-and-online-reviews-of-other-holy-sites-are-wildly-inflated-too-119614
Jensen Comment
In Lake
Wobegon criticizing can get you killed.
Beto: Trump Is 'An Open, Avowed Racist' And That's
The Reason There's Violence In America ---
https://townhall.com/tipsheet/bethbaumann/2019/08/04/beto-trump-is-an-open-avowed-racist-and-thats-the-reason-theres-violence-in-n2551140
Jensen Comment
Yeah, Impeach Trump and make Beto President to eliminate all violence in the USA
Beto apparently did not conduct research on the reasons for violence in the USA
Mass Shootings in the USA ---
https://en.wikipedia.org/wiki/Mass_shootings_in_the_United_States#Differing_sources
Terrorism in the USA ---
https://en.wikipedia.org/wiki/Terrorism_in_the_United_States
Mass shootings aren’t growing more common – and evidence
contradicts common stereotypes about the killers ---
https://theconversation.com/mass-shootings-arent-growing-more-common-and-evidence-contradicts-common-stereotypes-about-the-killers-121471
The men behind the US's deadliest mass shootings have domestic
violence — not mental illness — in common ---
https://www.businessinsider.com/deadliest-mass-shootings-almost-all-have-domestic-violence-connection-2017-11
Jensen
Comment
I don't think dividing domestic violence from mental illness is that simple.
There's
a definitional problem with the phrase "deadliest mass shootings." Deadliest can
be defined in terms of the number killed and injured in one incident like the
Las Vegas shooting incident for which we probably will never know the cause.
And
there's the problem of limiting the definition of indiscriminate terror to
"shootings." What about the 9/11 terror that killed over 3,000 people?
Deadliest can defined it in terms of frequency of incidents with more than four
killed or injured --- in which case domestic violence is the cause in a majority
instances.
Racism
is scary because it seems to be on the rise among white supremacists, but the UN
tells us that with lots of money ISIS is patiently planting sleeper cells to
commit terror worldwide. They will probably inflict greater damage (think dirty
bombs). "Just you wait 'enry 'iggins just you wait!"
https://www.thebaghdadpost.com/en/Story/42360/Terrorist-sleeper-cells-ISIS-fighters-remain-in-Iraq
I've always been opposed to the entire idea of white supremacy. However, the
media is being entirely unfair and inconsistent when confounding desire to
destroy President Trump's election chances with desire to reduce mass shootings
and other terror. The media tries to mitigate Islamic terror reporting, because
we're increasingly dependent upon Islamic society to report terrorists before
they inflict damage, and we don't want to discourage our Islamic friends in this
regard (reporting terrorists). At the same time the media forgets that we are
increasingly dependent upon white supremacists to report racist killers before
they can inflict damage or in helping to find the racists who inflicted damage.
It's the white supremacist friends of extremists that we hope will report
lowlifes planning attacks (think school mates). Making people declare their
white supremacy before they can report the lowest of lowlifes is dysfunctional
in our media.
The media repeatedly hammers President Trump for once having said (the
Charlotte incident) that there are good people on both sides of a street
confrontation between white supremacists and Antifa, but the fact of the matter
is that we most certainly hope there are good guys on
both sides of the confrontation who will report acquaintances who are plotting
deadly terror.
**How to Mislead With Statistics (delay notification of data errors)
Elizabeth Warren and Bernie Sanders just slammed the Swiss drug giant
Novartis over a new controversy swirling around the world's most expensive drug
---
https://www.businessinsider.com/novartiss-zolgensma-data-manipulation-gets-scrutiny-from-us-senators-2019-8
**How to Mislead With Statistics
U.S. Crime 'Good Guys With Guns' Can Rarely Stop Mass Shootings, and Texas
and Ohio Show Why 'Good Guys With Guns' Can Rarely Stop Mass Shootings, and
Texas and Ohio Show Why ---
https://time.com/5644578/good-guys-with-guns-el-paso-dayton/?utm_source=newsletter&utm_medium=email&utm_campaign=the-brief&utm_content=20190807&xid=newsletter-brief
Jensen Comment
This is a classic biased article from a left wing rag.
In accountancy we hear over and over that financial audits are often failures
at detecting employee pilfering, and it's true that financial statement audits
are not designed to detect pilfering by employees in part because audits to
detect employee pilfering are prohibitively expensive unless there is prior
suspicion that narrows the search. Financial statement audits are designed
to test overall conformance of financial reports to reporting standards.
However, only naive analysts conclude that financial statement audits do not
prevent some employee pilfering.
The problem is that we can never conduct very useful research on the impact
of financial statement auditing on preventing
employee pilfering. How do you catch a moonbeam in
your hand? How many employees are discouraged from pilfering when they
know that internal and external auditors will be poking around their records?
The
Sandy Hook School Shooter knew that
there were no armed teachers, administrators, or police officers on duty at the
school the morning he shot up a bunch of little kids. Would he have been so
brazen if he knew there were armed officials all around the school. Would
he instead have picked a softer target like a restaurant or a park when the
school was no longer a marshmallow target?
We'll never know. How to you catch a moonbeam in
your statistical database?
There are no perfect employee pilfering prevention measures just like there
are no perfect mass shooting prevention measures. But it's a
politically-motivated conclusion that "guns rarely stop mass shootings."
Schools are softer targets than gun shows because there
are fewer guns on site.
How many mass shootings take place at gun shows?
**How to Mislead With Statistics
New York Times --- Why Can’t Everyone Get A’s?
https://taxprof.typepad.com/taxprof_blog/2019/06/why-cant-everyone-get-as.html
Framing excellence in these competitive terms
doesn’t lead to improvements in performance. Indeed, a consistent body of
social science research shows that competition tends to hold us back from
doing our best. It creates an adversarial mentality that makes productive
collaboration less likely, encourages gaming of the system and leads all
concerned to focus not on meaningful improvement but on trying to outdo (and
perhaps undermine) everyone else.
The article was written by
Alfie
Kohn (author, No
Grades + No Homework = Better Learning)
---
https://www.amazon.com/gp/product/B001T4Y1QA/ref=as_li_qf_asin_il_tl?ie=UTF8&tag=lawproblo-20&creative=9325&linkCode=as2&creativeASIN=B001T4Y1QA&linkId=e245c2f94ba89c4b1fd7d0c7b9b7541c
Jensen Comment
This is a poorly researched article with citation bias that overlooks the
biggest disgrace in USA education over the past 50 years --- grade inflation in
K-12 and higher education where the median grade went from C+ to A-
http://faculty.trinity.edu/rjensen/assess.htm#RateMyProfessor
The author looks at the hypothetical case where the proportion of A grades
does not increase when courses get easier. He completely overlooks the reality
that the proportion of A grades actually increased to nearly 50% after teaching
evaluations commenced to affect tenure and pay raises of teachers ---
http://faculty.trinity.edu/rjensen/assess.htm#RateMyProfessor
Alfie Kohn completely ignores evidence that student put less effort into
courses taken on a pass/fail basis relative to when they take courses for letter
grades.
Academic Achievement Declines under Pass-Fail Grading ---
https://www.tandfonline.com/doi/abs/10.1080/00220973.1971.11011260
The author overlooks the case where over 60 students at Harvard were expelled
for cheating in a political science course where all students were assured of an
A grade if they turned in their homework (irrespective of the quality of their
answers). The students collaborated on cheating because without an incentive to
get a higher grade they did not want to waste their time on homework ---
http://faculty.trinity.edu/rjensen/Plagiarism.htm#UVA
"Cheating Scandal at Harvard," Inside Higher Ed, August 31,
2012 ---
http://www.insidehighered.com/quicktakes/2012/08/31/cheating-scandal-harvard
Harvard University is investigating about 125
students -- nearly 2 percent of all undergraduates -- who are suspected
of cheating on a take-home final during the spring semester, The
Boston Globe reported Thursday. The
students will appear before the college’s disciplinary board over the
coming weeks, seem to have copied each other’s work, the dean of
undergraduate education said. Those found guilty could face up to a
one-year suspension. The dean would not comment on whether students who
had already graduated would have their degrees revoked but he did tell
the Globe, “this is something we take really, really
seriously.” Harvard administrators said they are considering new ways to
educate students about cheating and academic ethics. While the
university has no honor code, the Globe noted, its official
handbook says students should “assume that collaboration in the
completion of assignments is prohibited unless explicitly permitted by
the instructor.”
"The Typo That Unfurled Harvard’s Cheating Scandal," Chronicle of
Higher Education, September 12, 2012 ---
http://chronicle.com/blogs/ticker/jp/the-typo-that-unfurled-harvards-cheating-scandal?cid=wc&utm_source=wc&utm_medium=en
How to Mislead With Charts
"How to Lie with Charts," Harvard Business Review, December 2014
---
https://hbr.org/2014/12/vision-statement-how-to-lie-with-charts
The above link is only a teaser. You have to pay to see the rest of the article.
"BP Misleads You With Charts," by Andrew Price, Good Blog, May
27, 2010 ---
Click Here
http://www.good.is/post/bp-misleads-you-with-charts/?utm_source=feedburner&utm_medium=feed&utm_campaign=Feed%3A+good%2Flbvp+%28GOOD+Main+RSS+Feed%29
"Correlation or Causation? Need to prove something you already believe?
Statistics are easy: All you need are two graphs and a leading question," by
Vali Chandrasekaran, Business Week, December 1, 2011 ---
http://www.businessweek.com/magazine/correlation-or-causation-12012011-gfx.html
How to Mislead With Statistics
"Reminder: The FBI’s ‘Police Homicide’ Count Is Wrong," by Reuben
Fischer-Baum, Nate Silver's 5:38 Blog, November 12, 2014 ---
http://fivethirtyeight.com/datalab/reminder-the-fbis-police-homicide-count-is-wrong/
How to Mislead With Statistics
"Some Stats Are Just Nonsense," by Cullen Roche, Pragmatic Capitalism
via Business Insider, November 15, 2014 ---
http://www.businessinsider.com/historical-statistical-and-nonsensical-2014-11
How to Mislead With Statistics
Common Accountics Science and Econometric Science Statistical Mistakes ---
http://www.cs.trinity.edu/~rjensen/temp/AccounticsScienceStatisticalMistakes.htm
The Huffington Post‘s War on Medical Science: A Brief History ---
https://sciencebasedmedicine.org/the-huffington-posts-war-on-science-revisited/
Robustness Statistics ---
https://en.wikipedia.org/wiki/Robust_statistics
**How to Mislead With Statistics
Mass shootings aren’t growing more common – and evidence contradicts common
stereotypes about the killers
---
https://theconversation.com/mass-shootings-arent-growing-more-common-and-evidence-contradicts-common-stereotypes-about-the-killers-121471
State gun laws, gun ownership, and mass shootings in the US: cross
sectional time series ---
https://www.bmj.com/content/364/bmj.l542
Outcome variables
We used the Supplementary Homicide Reports from the Federal Bureau of
Investigation’s Uniform Crime Reporting System (1998-2015) to obtain counts
of mass shootings by state. We compiled these data in line with the most
commonly used definition of a mass shooting: one event in which
four or more individuals were killed by a perpetrator using a firearm and
the perpetrator themselves did not count toward the total number of victims.
These mass shooting events were analyzed in total and stratified as to
whether the mass shooting was domestic or non-domestic in nature. Domestic
mass shootings included instances where the perpetrator committed the act
against an immediate family member or partner. Non-domestic mass shootings
included all other types of relationships, such as acquaintances, employees,
employers, friends, neighbors, strangers, extended family members, and
others. Florida was excluded due to non-participation in the Uniform Crime
Reporting System program.
Jensen Comment
The above article is badly misleading in that its conclusions are based largely
on rounding error in computing averages and denominator effects that destroy
robustness. The study focuses on rare events, it's conclusions and displays are
unstable to slight sensitivity analysis.
I will focus my criticisms on Figure 2 where Rhode Island, Delaware, New
Hampshire, North Dakota, and Arkansas each have rounded averages of zero mass
shootings across 17 years. There were mass shootings in those five states, but
their averages round to zero. The worst state in Figure 2 is Vermont that
has the highest average of three mass shootings across those same 17 years. Thus
the lowest five states have zero mass shooting averages and the highest state
has an average of three mass shootings. The difference from lowest to highest
(in Figure 2) I suspect is heavily to heavily be rounding error and is not as
significant as it appears in Figure 2.
There also is what is known as a denominator effect that destroys robustness
in Figure 2 due to the low population of 600,000 people in Vermont. Such a low
population destroys much of the robustness in comparing the highest mass killing
state (Vermont) with more populated states like California, New York, Arkansas
and Delaware. The same applies to low population states of Wyoming, Montana,
North Dakota, New Hampshire, and Alaska.
The study concludes as follows:
Discussion
Our analyses show that US state gun laws have become more permissive in
recent decades, and that a growing divide in
rates of mass shootings appears to be emerging between restrictive and
permissive states. A 10 unit increase in the
permissiveness of state gun laws was associated with an approximately 9%
higher rate of mass shootings after adjusting for key factors. A 10%
increase in gun ownership was associated with an approximately 35% higher
rate of mass shootings after adjusting for key factors. On the absolute
scale, this means that a state like California, which has approximately two
mass shootings per year, will have an extra mass shooting for every 10 unit
increase in permissiveness over five years. It will also have three to five
more mass shootings per five years for every 10 unit increase in gun
ownership. These results were also consistent across multiple analyses and
when stratified as to whether or not mass shootings were committed by
someone in a close relationship with the victims.
I contend that the above conclusion is unstable (not robust) such as the
conclusion that a restrictive state like Rhode Island has a hugely greater
divide (an average of zero mass shootings per year) with a permissive state
Vermont (with an average of three average mass shootings) --- a conclusion
that does not, based upon this study, justify legislation for more restrictive
gun laws to reduce mass shootings. The authors of the above study are not
responsible in pointing out the lack of robustness in their displays and
discussion. For example the five states shown in Figure 2 to have zero average
mass shootings all had mass shootings that were so rare they rounded to zero.
The worst state (Vermont) had an average rounded up to three in Figure 2. But in
reality the difference between the worst state (Vermont) and the five best
states is not really 3-0 = 3. This difference is
somewhat due to rounding differences combined with denominator effects rather
than robust statistical outcomes.
The first rule of statistical analysis is discuss the robustness of the
outcomes. The above study lacks a robustness analysis.
**How
to Mislead With Smoke and Mirrors
Marketwatch: These 7 Social Security myths just aren’t true, no matter how
often you hear them ---
https://www.marketwatch.com/story/these-7-social-security-myths-just-arent-true-no-matter-how-often-you-hear-them-2019-08-27
Jensen
Comment
I agree with most of that most of the "myths" in this article are myths, but I
disagree with Myth 2.
Myth No. 2: The government raided the trust fund
Some people believe the Social Security system wouldn’t be facing insolvency
today if the government kept their gosh-darned theivin’ hands out of it.
Here’s the truth: There has never been any change in the way Social Security
payroll taxes are used by the federal government.
The Social Security trust fund has never been “put into the general fund of
the government.” It is a separate account, and always has been.
We
can find the origins of this myth in the change that happened back in 1969.
At that time, the government began listing the trust fund’s transactions in
a single budget along with all the other functions of the federal
government.
The transactions were shown alongside other functions, but the trust fund
remained a separate account. In 1990, the government began listing the
activities of the trust fund separately.
None of these movements had anything to do with the actual operations of the
trust fund; it was purely a change of accounting practices.
The government did not raid Social Security’s trust fund. But you might
still believe the myth that it did if you don’t understand where the money
went — because it is true that the system faces insolvency today.
Why isn’t there a trust fund sitting around with trillions of dollars from
all the money we working taxpayers put into the system? Because the Treasury
uses those dollars.
Before you say, “aha! This proves the point; the government did steal the
money!” …not so fast. The government always uses incoming revenue to meet
its current obligations before it borrows money. This includes funds coming
in and earmarked for the Social Security trust fund.
For every dollar that comes in from Social Security taxes, a special-issue
Treasury bond takes its place. These bonds earn interest — which is a good
thing.
In
fact, since these bonds were first introduced to the trust fund, they
generated $1.9 trillion in interest. For reference, the total trust fund
balance is only $2.9 trillion.
Had all those dollars been left in cash, the trust fund would be worth about
two-thirds less and would have run dry much earlier than currently
projected.
The bottom line is that there’s no difference between the way the federal
government runs the trust fund and the way your bank handles your cash
accounts.
Jensen
Added Comment
Who
pays the interest?
When a
lender lends cash to a borrower the borrower repays the
loan principal plus interest to the lender. The interest is called a
Return on Investment (ROI) to the lender.
But
borrowing from the Social Security Trust fund is all smoke and mirrors.
The current generation lends money to whom?
In effect they lend it to themselves. Presumably the money taken out each year
from the SS Trust Fund each year goes to first pay for current social security
benefits and any excess goes current government spending goes to current
government spending on other programs, thereby avoiding additional taxes that
the current generation should be funding this year with added taxes. Yes
Congress does promise to repay the money from the trust fund plus interest.
But the interest paid years down the road is paid by future generations of
unborn children that did not borrow the money. Those children will
eventually have to pay the added taxes the current generation should have
coughed up this year instead of raiding the SS Trust fund and forcing the future
generation repay the loan plus the interest. Those unborn children did not elect
to borrow the money and repay the principal plus interest. No the current
generation borrowed the money and forced the future generation to replay the
principal plus interest. It's all smoke and mirrors that the Marketwatch did not
own up to in the above article.
Sure it looks like the SS Trust funds earned interest
on the bonds it used to replace current cash collections. But in reality the
returns are paid eventually in taxes by our unborn children to pay for historic
government expenditures on other programs that otherwise would have required
increased taxes.
Something similar happens with Social Security benefits to disabled programs.
The government should help disabled people, but the disability benefits each
year should come from current tax money raised for by the current generation to
help disabled people. In effect the current generation avoided some disability
taxes this year for disabled people by borrowing from future generations of
unborn children to pay the current disability benefits.
In effect Congress is getting away with robbing our future generations of
unborn children by promising that they will eventually pay for disability
benefits doled out in the present years.
It's
all smoke and mirrors.
**How to Mislead With Statistics
New Study Defending NYC’s Minimum Wage Law is Fake News ---
https://mises.org/wire/new-study-defending-nyc’s-minimum-wage-law-fake-news?utm_source=Mises+Institute+Subscriptions&utm_campaign=a77e7113d9-EMAIL_CAMPAIGN_9_21_2018_9_59_COPY_01&utm_medium=email&utm_term=0_8b52b2e1c0-a77e7113d9-228708937
Jensen Comment
What liberals don't like to discuss is the impact of a state-wide $15 per hour
on small town small businesses.
From the CFO Journal's Morning Ledger on July 25, 2019
In
a small California city, America’s highest
minimum wage is
causing a debate over how to balance boosting wages for the lowest-paid
workers and ensuring small businesses can afford to keep employing them.
Jensen Comment
Showing once again that minimum wages are more of a problem for small businesses
than for Walmart and Amazon that are not located in small villages with less
than 1,000 people --- small town businesses that struggle to make any profits
and endure losses in some seasons (think a small New England inn in the winter
and spring). Actually I've recently discovered how the inn down the road from me
charging a $300 average (with tax) per night for a room is struggling with
competition from Airbnb renting scenic entire houses (think four bedrooms and a
garage) for $200 per night in very scenic locales.
The high-labor inn across from me is once again is
trying to lift itself out of bankruptcy while the Airbnbs are doing great ---
The Sunset Hill House --- https://www.thesunsethillhouse.com/
Prices
of course vary, but up here in small-village Sugar Hill (one store downtown) you
can rent a picture-perfect farm house for $200 per night, a ski chalet on Cannon
Mtn for $200 a night, and the historic dairy barn film Bette Davis hauled in
from Vermont and rebuilt into her main home (rent now for $300 per night) ---
ttps://hookedonhouses.net/2016/01/14/bette-davis-beloved-butternut-farm-new-hampshire/
Airbnbs can
also make labor-saving deals like bring your own sheets and towels and bring
your own breakfasts.
The bottom line is do you want to
pay $300 per night per room with a view versus $300 per night for four bedrooms
in wooded seclusion, a fully-equipped kitchen, a huge family room, and a deck
with a view --- all for $300 per night --- with much more privacy for your
family and friends?
New Hampshire has not yet doubled
the minimum wage to $15 per hour, but when it does hundreds of struggling inns
and other small businesses end up in bankruptcy court (yet again).
In small villages doubling the
minimum wage will wipe out jobs, once again driving people to the bigger cities.
**How to Mislead With Statistics
For years, the estimates of nonfatal gunshot injuries published by the
Centers for Disease Control and Prevention have grown increasingly unreliable
---
https://fivethirtyeight.com/features/how-one-hospital-skewed-the-cdcs-gun-injury-estimate/
Important Issues in Statistical Testing and Recommended Improvements in Research
April 27, 2019 Message from
Tom Dyckman, Emeritus Accounting Professor from Cornell University
Caught by accident a video
of the history of Persia on your blog. I think it was prepared by the
National Historical Association. I watched it for the hour and then another
on the a time-history of the world over the last 200,000 years. Both
fascinating and well done. I now put away an hour each day for education via
your blog. Thanks.
Enclosing my latest
manuscript just accepted for publication in Econometrics. It deals with
issues you have been interested in as well as I that address issues
in statistical testing and accounting.
Have a great day.
Tom
Econometrics Journal ---
https://academic.oup.com/ectj
Jensen Comment
Although the article has not yet been published, here's the introduction:
Important Issues in Statistical Testing and
Recommended Improvements in Accounting Research
Thomas R. Dyckman, Cornell University
Stephen A. Zeff, Rice University
Synopsis:
A great
deal of the accounting research published in recent years has involved
statistical tests. Our paper proposes improvements to both the quality and
execution of such research. We address the following limitations in current
research that appear to us to be ignored or used inappropriately: (1)
unaddressed situational effects resulting from model limitations and what
has been referred to as “data carpentry,” (2) limitations and alternatives
to winsorizing, (3) necessary improvements to relying on a study’s
calculated “p-values” instead of on the economic or behavioral importance of
the results, and (4) the information loss incurred by under-valuing what can
and cannot be learned from replications.
Keywords:
Model Specification, Model Testing, Reporting Results (p-values),
Replications.
Introduction
As
professors of accounting for nearly 60 years and past presidents of the
American Accounting Association, we are concerned about the quality of
statistical research in accounting. This article is a call to our accounting
colleagues, and perhaps also to those in other fields, to invest substantial
time and effort toward improving their requisite knowledge and skill when
conducting the appropriate statistical analysis. Involving expert
statisticians may be helpful, as we all need to recognize the limitations in
our own knowledge in order to tap into this expertise. Our heightened
interest in improvements to the quality of statistical analysis in
accounting research was in response to attending research presentations and
reading the current literature.
Several
years ago, we suggested several improvements to statistical testing and
reporting (Dyckman and Zeff 2014). In that paper, we reviewed the 66
articles involving statistical testing that accounted for 90 percent of the
research papers published between September 2012 and May 2013 in The
Accounting Review and the Journal of Accounting Research,
two leading journals in the field of accounting. Of these 66 papers, 90
percent relied on regression analysis. Our paper examined ways of improving
the statistical analysis and the need to report the economic importance of
the results.
An
extension of these concerns was included in a commissioned paper included in
the 50th anniversary of Abacus (Dyckman and Zeff 2015). We acknowledge
several accounting academics who are also concerned with these issues,
including Ohlson (2018), Kim, Ji and Ahmed (2018), and Stone (2018), whose
works we cite.
Concerns
about statistical testing led to exploring the advantages of a Bayesian
approach and abandoning null hypothesis tests (NHST) in favor of reporting
confidence intervals. We also suggested the advantages – and limitations –
of meta-analysis that would allow for the inclusion of replication studies
in the assessment of evidence. This approach would replace the typical NHST
process and its reliance on p-values (Dyckman 2016).
A fourth
article which reviewed the first 30 years’ history of the research journal,
Accounting Horizons, continued our concern with the current applications of
statistical testing to accounting research. An additional aspect of this
article was the attention we gave to accounting researchers’ seeming lack of
interest in communicating with an audience of professionals beyond other
like researchers, as if their only role as researchers was to enrich the
research literature and not to contribute to the stock of accounting
knowledge. We submit that accounting academics, because of the academic
reward structure in their universities, tend to write for their peers.
Accounting standard setters and accounting professionals, as well as those
who make business and policy decisions, are all too often relegated to the
sidelines. We argued that accounting research should, in the end, be
relevant to important issues faced by accounting professionals, regulators
and management, and that the research findings should be readable by
individuals in this broader user community (Zeff and Dyckman 2018).
In the
current paper, we expand on the statistical testing issues raised in our
earlier papers, and we identify limitations often overlooked or ignored. Our
experience suggests that many accounting professors, and perhaps those in
other fields, are not familiar with, or equipped to, address them. We take
up the following major topics: Model Specification and Data Carpentry,
Testing the Model, Reporting Results, and Replication Studies, followed by A
Critical Evaluation and A Way Forward.
Model
Specification and Data Carpentry
The
choice of a topic and related theory established the basis for the
hypotheses to be examined and the concepts that will constitute the
independent variables. Accounting investigations often rest only on a story
rather than on a theory. A major problem here is that a story, but not
theory, can be changed or modified, which encourages data mining (Black
1993, 73). Establishing the appropriate relationships require an
understanding of the actual decision-making environment. These ingredients,
along with the research team’s insights and abilities, are critical to
designing the research testing program and the data collection and analysis
process. Failure to take them into account in the data-selection decision
process and analysis was discussed in detail in a recent paper by Gow,
Larcker, and Reiss (2016). There, the authors provided a detailed example
(pp. 502-514) of how the decision environment can reflect its own
idiosyncratic differences that, in turn, influence the data. For example,
even if the business context is essentially the same across companies, data
limitations remain. First, the data will inevitably reflect different sets
of decision makers and different organizations, different time periods,
different information, and, at least, some differences in the definitions of
the variables deemed to be relevant. The interactions between these
variables, and with any relevant but excluded variables, will, as the
authors showed, lead to questionable results. How the selected variables
interact with each other – and with any excluded but relevant variables –
depends on the nature of the contextual environment in which the relation
arises. We note here that careful research designs up front can reduce
interactions among the independent variables. Authors can and should
describe the decision environment and differences, if any, that have a
potential impact upon the analysis and conclusions. A thorough analysis and
description of the decision environments is essential and endows additional
credibility on the research.
Continued in article
April 28, 2019 reply from Ed Scribner
Bob,
Maybe this paper by D&Z will
advance the cause of publishing replications.
Ed
April 28, 2019 reply from Bob Jensen
Hi Ed,
More importantly the
two major Dyckman and Zeff papers will (hopefully) advance academic research
into the various ways to mislead with statistics, albeit the "misleading" is
often done innocently (naively) rather than intentionally. Accountics
scientists over the years grew lazy by buying data (think Compustat, CRSP,
and AuditAnalytics) and feeding that data, sometimes unviewed, into
off-the-shelf statistical inference programs (like stirring the stew and
looking for lumps).
It's really naïve to
assume that replication is not needed when the data like Compustat data are
purchased and, therefore, cannot be "fabricated" by the researchers. Even if
we ignore errors in the purchased data, there are many other ways to lazily
mislead using purchased data --- ways summarized broadly in this Dyckman and
Zeff forthcoming 2019 econometrics paper.
Whenever I was asked to
referee papers using statistical inference my first suspicions were sample
size and non-stationarity. Oddly enough, samples are often too large for
statistical inference in accountics science. With very large samples,
differences are often statistically significant but not substantively
different. I recall pointing this out as an assigned discussant at a
conference before Deirdre McCloskey started writing about this problem ---
https://en.wikipedia.org/wiki/Deirdre_McCloskey
Also see
ttp://www.cs.trinity.edu/~rjensen/temp/DeirdreMcCloskey/StatisticalSignificance01.htm
At the conference the author of the paper did not appear to understand this
point that McCloskey latter became known for in economics.
An even bigger problem
is nonstationary populations from which data is sampled ---
https://en.wikipedia.org/wiki/Stationary_process
The classic example here is the major problem with election polling. The
famous statistician (at the time employed by the NYT) named Nate Silver
predicted the day before the 2010 election (for Ted Kennedy's Senate seat)
that Mass. Attorney General Martha Coakley would womp Republican Candidate
Scott Brown. After Scott Brown became Senator Brown Nate Silver discovered
belatedly that due to various reasons
a huge number of voters changed their minds on election day.
Economic/financial
data, like political poll data, are often sampled from non-stationary
processes where non-stationarity is overlooked by accountics scientists.
Dyckman and Zeff focused on this problem in their earlier (2014) paper.
I think it's important to study their 2014 paper before digging into this
subsequent 2019 paper.
Dyckman, T. R., and S. A.
Zeff. 2014. Some methodological deficiencies in empirical research articles
in accounting. Accounting Horizons 28 (3): 695-712.
Thanks,
Bob
April 28 reply from Paul Polinski
Bob: Here's a related column in the journal
Nature's online site ---
https://www.nature.com/articles/d41586-019-01307-2
Paul
April 28, 2019 reply from Bob Jensen
Hi Paul,
What a great citation.
As a doctoral student at Stanford I was one of the luckiest doctoral
students in the USA. The Graduate School of Business sent me to the School
of Engineering to learn statistical inference as taught to engineers.
Engineers are unique in that they are taught about "power" as the Type 2
error skipped over in nearly every discipline except engineering.
Engineering is unique in that quality control is one of the only sampling
population areas where "operating characteristic curves" can be generated
for Type 2 error measurement ---
https://en.wikipedia.org/wiki/Total_operating_characteristic
Is there any statistical inference study in accounting or social science
(including economics or finance) that measured Type 2 error? The proletariat
are destined to only study Type 1 error in statistical inference.
Thanks,
Bob
P-Value Nonsense
Statisticians clamor for retraction of paper by Harvard researchers they say
uses a “nonsense statistic” ---
https://retractionwatch.com/2019/06/19/statisticians-clamor-for-retraction-of-paper-by-harvard-researchers-they-say-uses-a-nonsense-statistic/#more-100498
Bob Jensen's threads on P-value nonsense
---
http://faculty.trinity.edu/rjensen/theory01.htm#WhatWentWrong
Which economic methods are
in practice statistically more honest than others?
https://marginalrevolution.com/marginalrevolution/2020/09/which-economic-methods-are-in-practice-statistically-more-honest-than-others.html
… our
results suggest that the [instrumental variables] and, to a lesser extent,
[difference-in-difference] research bodies have substantially more p-hacking
and/or selective publication than those based on [randomized controlled
trials] and [regression-discontinuity]…
Cornell University: To Your List of Biases in Meta-Analyses, Add
This One: Accumulation Bias ---
https://replicationnetwork.com/2019/07/05/to-your-list-of-biases-in-meta-analyses-add-this-one-accumulation-bias/
“Studies accumulate over
time and meta-analyses are mainly retrospective. These two characteristics
introduce dependencies between the analysis time, at which a series of
studies is up for meta-analysis, and results within the series.”
“Dependencies introduce
bias — Accumulation Bias — and invalidate the sampling distribution assumed
for p-value tests, thus inflating type-I errors.”
“…by using p-value
methods, conventional meta-analysis implicitly assumes that promising
initial results are just as likely to develop into (large) series of studies
as their disappointing counterparts. Conclusive studies should just as
likely trigger meta-analyses as inconclusive ones. And so the use of p-value
tests suggests that results of earlier studies should be unknown when
planning new studies as well as when planning meta-analyses.”
“Such assumptions are
unrealistic… ignoring these assumptions invalidates conventional p-value
tests and inflates type-I errors.”
“… we argue throughout the
paper that any efficient scientific process will introduce some form of
Accumulation Bias and that the exact process can never be fully known.”
“A likelihood ratio
approach to testing solves this problem … Firstly, it agrees with a form of
the stopping rule principle … Secondly, it agrees with the Prequential
principle … Thirdly, it allows for a betting interpretation …: reinvesting
profits from one study into the next and cashing out at any time.”
“This leads to two main
conclusions. First, Accumulation Bias is inevitable, and even if it can be
approximated and accounted for, no valid p-value tests can be constructed.
Second, tests based on likelihood ratios withstand Accumulation Bias: they
provide bounds on error probabilities that remain valid despite the bias.”
Probably the biggest deal in evaluating research is the importance of
replication by different researchers in both the same and varying circumstances.
**How to Mislead With Statistics
Battle for thermostat: Gender and the effect of temperature on cognitive
performance ---
https://journals.plos.org/plosone/article?id=10.1371/journal.pone.0216362
Jensen Comment
I don't know if this is a misleading conclusion or not, but I'm dubious for a
number of reasons.
Most importantly, psychology is under suspicion in research due to lack of
replication. First there are replications that are as exacting as possible in
terms of settings and tasks. For example, even for studies in the same location
(Berlin) there are differing circumstances regarding time of the year that can
affect how men and women dress, type of temperature control (e.g., forced air
heating versus baseboard heating), variations in heating over different parts of
large rooms, etc.
Second there are related studies under varying circumstances and tasks. For
example, are there studies regarding gender and job performance relative and
temperatures regarding other tasks such as job performances.
The bottom line is that the conclusions of this research are extremely
tenuous until there are more replications over wide-ranging conditions and other
researchers. And the conclusions are tenuous until medical science comes up with
theories to be tested on the physiological reasons for such gender differences
under varying temperatures.
Cognition is so dependent upon major factors such as motivation (some tests
are just more important than others), variations in factors affecting
preparation and alertness, variations in the tests themselves and how much they
rely on short-term versus long-term memory, etc. Somehow, I don't think
variations in test-taking temperature are as critical as a myriad of other
things affecting cognition.
Bob Jensen's threads on the absurd lack of replication in academic
accountancy research are at
http://faculty.trinity.edu/rjensen/TheoryTAR.htm
Positive Economics and the F-Twist ---
https://en.wikipedia.org/wiki/Essays_in_Positive_Economics
Economic Models vs. The Real World ---
https://mises.org/wire/economic-models-vs-real-world
. . .
The fact that people
consciously pursue purposeful actions provides us with definite knowledge,
which is always valid as far as human beings are concerned. This knowledge
sets the base for a coherent framework that permits meaningful assessments
of the state of an economy. In contrast, analysis that rely solely on
statistical correlations is likely to be problematic. So-called pure
statistical analysis can tell us very little about the essence of economic
activity.
Fanciful Assumptions
Similarly, we must reject
comments that are based on "purely" theoretical models, which derive their
foundation from economists' imaginations that are detached from the facts of
reality. A model, which is not derived from reality, cannot possibly explain
the real world.
For example, in order
to explain the economic crisis in Japan, the famous mainstream economist
Paul Krugman employed a model that assumes that people are identical and
live forever and that output is given.
Whilst admitting that these assumptions are not realistic, Krugman
nonetheless argued that somehow his model can be useful in offering
solutions to the economic crisis in Japan.
Conclusion
To be applicable, an
economic theory must emanate from the essence of what drives human conduct.
The key factor here is purposeful action, and the knowledge that people
pursue purposeful actions permits an analyst to make sense of economic data.
Jensen Comment
There's a huge difference between measurement errors versus missing variables.
When a variable is included in a prediction model, measurement error can be
judged according to
robustness of the prediction to measurement error on that variable. Missing
variables are usually much more troublesome because models cannot be improved by
developing more accurate measuring instruments. There are of course exceptions,
but these are few and far between for missing variables. Missing variables
are "missing" for many reasons such as being unknown or unmeasurable or
impractical to include in a model. For example, the many (infinite?) physical
and psychological factors that can affect performance of an athlete are often
unknown or unmeasureable or impractical to include in performance prediction
models. This is why athletic competitions are games of chance. Life is even more
complicated when it comes to predicting the stock market or GDP.
Between measurement error and missing variables we have the problem of
simplifying assumptions among included variables. For example, in multiple
regression it's common to assume independence among predictor variables when in
fact higher order interactions are usually present even if ignored due to
complications these interactions present. Another simplifying assumption is to
discard outliers among variables included in the model. Outliers are
complicating factors in the real world that distort modelling outcomes.
The biggest problem in statistical analysis is the sampling from
non-stationary processes that greatly complicate underlying statistical
assumptions of stationarity. Recovering addicts do well if the world around then
is a stationary process. However, unforeseeable events in the world around them
may present hurdles that some (not all) cannot overcome relative to people
without such addictions.
Bob Jensen's threads on the limits of analytical models built upon
unrealistic assumptions
Mathmatical Analysis in Plato's Cave ---
http://faculty.trinity.edu/rjensen/TheoryTAR.htm#Analytics
**How to mislead with statistics
There Are 79 Jobs With Six Figure Salaries ----
https://247wallst.com/special-report/2019/08/06/there-are-79-jobs-with-six-figure-salaries-2/9/
Jensen Comment
This is among the most misleading rankings I've ever seen.
Firstly, many of the professionals included in the rankings don't have "jobs"
that pay salaries. They are business owners who rely on profits rather than
salaries. Thinks of surgeons who have their own offices, nurses, physician
assistants, receptionists, accountants, etc. They have many expenses, especially
malpractice insurance policies and claims pay out.
Secondly, many have profit sharing and bonus plans that are almost impossible
to predict above and beyond salaries included in this study.
Thirdly, these are averages with enormous standard deviations and skewed
distributions. For example, college professor salaries and physician assistant
salaries are truncated much lower than salaries of lawyers and brain surgeons.
Fourthly, the jobs vary greatly in terms of benefits. College presidents for
example get free housing, huge expense allowances, cars, etc.
Fifthly, salaries are cover varying parts of the year. Professors, for
example, are included in this study at their nine-month base. Those same
professors get added salaries for summer teaching, research, book royalties,
consulting, patent royalties, etc.
Sixthly, some jobs are conducive to added compensation, particularly outside
consulting, book writing, speeches, musical performances, etc.
The bottom line is that these rankings are mostly garbage and very misleading
for career aspirants.
**How to Mislead With Statistics
The No. 1 job in America with the ‘best career opportunities’ pays
$112,000 a year — and it’s not in tech ---
https://www.marketwatch.com/story/the-no-1-job-in-america-with-the-best-career-opportunities-pays-112000-a-year-and-its-not-in-tech-2019-08-14?mod=article_inline
Jensen Comment
There's a lot that can be deceiving in this article. Firstly, being a tax
manager is not an entrylevel job. The left tail is probably truncated at at
least $100,000 which distorts the mean. More importantly, most tax managers make
a lot more than their base salaries with bonus plans and profit sharing that can
easily double or triple the base salary. Hence, there's a lot of missing data in
the study. It would not be uncommon for the base salary of the tax manager to be
less than that of some of the tech specialists who report to her or him. But
they most likely do not share as heavily in the bonuses and profit sharing
compensations.
The job is sometimes filled with IRS senior agents who are very experienced
with IRS tax accounting and tax planning.
The job is also a stepping stone to becoming a Chief Financial Officer or a
Chief Accounting Officer.
But I do not think that on "average" the compensation of a tax manager is
nearly as high as that of a top surgeon and some other types of physicians. But
surgeons most often are not employees. They are entrepreneurships or
partnerships and receive compensation in the form of business profits after
expenses. The biggest problem when comparing careers according to compensation
is that databases like those of the Department of Labor really don't have
provide data on every aspect of compensation.
**How to Mislead With Statistics
Here's the salary breakdown for Yale's MBA class of 2019,
including the industries that are paying its grads the most ---
https://www.businessinsider.com/the-starting-salaries-for-yales-2019-mba-graduates-2019-12#1-law-8
Jensen Comment
One thing that's misleading is the category "Accounting and Finance." This is
more finance than accounting since most MBA programs, including that of Yale, do
not provide nearly enough accounting to sit for the CPA examination or get a job
in auditing or tax accounting. Any accountants graduating from from most MBA
programs took their accounting, auditing, and tax as undergraduates.
Secondly, those $125,000 annual starting salaries are averages,
and averages are distorted by distribution variations, skewness, and outliers.
More importantly, most of those high-paying starting salaries are
in urban centers like Boston, NYC, Chicago, San Francisco, Washington DC, and
Los Angeles. A starting salary of $125,000 in those cities won't go as far as a
$70,000 salary in Des Moines, Topeka, Oklahoma City, and San Antonio. In San
Francisco you may have to live in your van on only $125,000 per year.
This of course does not mean that some of those high-paying
starting salaries do not open the gates to much higher compensation a few years
down the road. But the best opportunities often depend upon the undergraduate
majors. A computer science, Chinese language, or engineering undergraduate
usually faces more opportunities with a Yale MBA diploma than an undergraduate
in art, music, or history having the same Yale MBA diploma.
And we have to ask why Ivy League MBA diplomas are usually worth
more than an MBA diploma from Cactus Gulch State University?
My answer is that it's mostly the high admission standards of the Ivy League,
University of Chicago, Stanford, and other prestigious university MBA programs.
It's the high standards of admission that count more than the top A
grades that most every graduate gets in the prestigious MBA programs.
My main point is that any measure of
central tendency cannot represent the total distribution without being
potentially misleading. It takes a graphic or some table of outcomes showing the
entire distribution.
One of the main distortions is to not
give special consideration to those who remain unemployed after graduation such
as an MBA graduate who elects for a time to be a parent at home with zero salary
or a relatively low salary from part-time employment. People get college degrees
with the long-run in mind, and doing an analysis at a point in time can be
misleading.
I would also like to see a factoring
out of some outliers. Two of my close friends at Stanford University decades ago
were an MBA student and his wife who lived in an apartment next door for a time.
Jerry graduated with an MBA and went to work an enormous salary where he would
have worked had he never gone to college. His father owned what was possibly the
largest car dealership in the State of Minnesota. Jerry started out the day
after graduation as the CEO.
Jerry was an outlier, but there are
likely to be several such outliers each year where graduates go to work at high
salaries in family businesses. Another example of an MBA friend at the time is a
graduate whose father owned the largest department store in Sydney, Australia.
Another example, is one of my former students who today is a billionaire (at
least on paper). He was a CEO of his own company when he commenced at Trinity
University as a freshman at age 18.
And there are bound to be some outliers
of unemployed graduates, including those that are unemployed for reasons other
than parenthood. MBA graduates are commonly not earning much to begin with
because they're commencing their own startups. I recall one Stanford MBA
graduate who partnered with his sister to form an ultimately successful chain of
cookie stores that financed his failed attempt to become a world-famous author.
In the first year of graduation his income was negative.
And there's the issue of salary before
and after getting a degree of any kind. I don't think Jack Palance's Hollywood
income changed because he got a degree from Stanford after he was already a
famous actor.
These are the types of distortions that
I have in mind when I talk about outliers and other aberrations in
distributions.
**How to mislead with statistics
Schools ranked by student/faculty ratio ---
https://oedb.org/rankings/student-faculty-ratio/
This link also suggests why low ratios are expected to help learning.
The first thing to note is that very low student/faculty ratios often are
associated with specialty colleges like seminaries and other specialty college
that have increasingly hard times attracting students.
Secondly, the best (lowest) ratios are in heavily endowed universities (think
Ivy League). But this can be somewhat misleading in terms of exclusion of some
graduate programs from the calculations. For example, Harvard has a low 7/1
ratio overall but certainly not in the MBA or law school programs that are cash
cows with very large classes with high student/faculty ratios.
Thirdly, class sizes are sometimes skewed giving rise to misleading
student/faculty ratios. In flagship universities it's very common to have very,
very large classes for basic core courses in order to have much smaller classes
for majors in junior and senior years. Thus a flagship state university does not
necessarily have very large classes uniformly across the campus. It's extremely
common these days for colleges to have faculty shortages in majors that are the
most popular with students. For example, the many humanities departments may be
rich in faculty numbers relative to the number of majors in humanities such that
senior level seminars may only have three or four students.
But the business school having many more majors may end up
with senior-level courses with 100 or more students because of severe shortage
of faculty in the business school.
Fourthly, it's very difficult to conduct studies on the impact of
student/faculty ratios when comparing universities because there are so many
confounding factors such as admissions standards and grading rigor. Add to this
the impact of varying use of distance education. Distance education is unique in
that students online often have more intense learning relationships with both
teachers and other students. Student/faculty ratios may be less revealing in
online courses.
Fifthly, low student/faculty ratios say nothing about the quality and
dedication of the faculty to teaching. Some colleges and universities have 90%
or higher tenure rates giving rise to job securities that are more independent
of teaching performance than in schools having much lower tenure rates with
faculty being more intensely evaluated as to performance along various criteria,
including teaching.
Sixthly, universities with low student/faculty ratios may be smaller
universities that just do not have many faculty or students. For example, the
Computer Science Department at Cactus Gulch College may only have 12 majors and
two faculty members. Flagship State University may have 800 computer science
majors and 40 faculty in computer science. Where would you like your daughter to
major in computer science? Chances are Flagship State has many more curriculum
options and specialty courses in computer science leading to much better job
prospects relative to Cactus Gulch computer science graduates.
Lastly, low student/faculty ratios are not always best. The Harvard Business
School has very high student/faculty ratios, but most any Harvard MBA graduates
will tell you they learned more from other students than they did from faculty.
This, in part, is due to the Socratic pedagogy of the Harvard Business School
were most courses focus on cases where students rather than faculty solve the
cases in class or in teams of students outside the classroom. Socratic learning
is intended for students to learn more from each other than from faculty who do
not lecture under the Socratic pedagogy --- often faculty who do not even reveal
best answers. Often the cases are so complex there are no "best answers." My
point here is that having higher student/faculty ratios may be better under the
Socratic Pedagogy ---
https://en.wikipedia.org/wiki/Socratic_method
The bottom line here is that the "best" place to go to college is extremely
complicated and multivariate in terms of so many things that student/faculty
ratios can be meaningful in some contexts and extremely misleading in other
contexts. The Harvard Business School and the Wharton Business School
(Pennsylvania) have relatively high student/faculty ratios. But graduates of
those programs end up on uniquely fast tracks to Wall Street employment or
corporate employment that overwhelm almost any other criterion in terms of
students wanting to get on those same employment tracks. At the same time having
a 1/1 student faculty ratio in the classics might be very ideal at Oxford
University if you hope to teach classics at Cambridge University or Harvard
University.
And "size" does matter in many ways, including the non-academic aspect of
college life. The University of Texas at Austin affords many opportunities for
great learning, but when it comes to dormitory living Jester Hall is so enormous
it has two zip codes. Many young people leaving home for the first time do not
want that kind of "bigness." Cactus Gulch may not have all the computer science
opportunities of UT-Austin, but living and learning and extracurricular life at
Cactus Gulch may be better in combination for many students. You don't have to
be NFL material to participate in varsity football at Cactus Gulch. You may
become relatively close to every student living in your Cactus Gulch dorm.
And when you encounter a Cactus Gulch professor while walking on campus that
professor might actually know your name. Don't count on this at UT-Austin.
And you might enjoy the quiet of you Cactus Gulch dorm, a quiet that never
happens at Jester Hall 24/7 with its fast food joints and all the stereos
blaring and residents/non-residents who live by night rather than day amid the
police sirens.
**How to Mislead With Statistics
Double-Counting of Investment
by Robert J. Barro, NBER Working Paper No. 25826
Issued in May 2019, Revised in July 2019
https://www.nber.org/papers/w25826
The national-income accounts double-count investment, which enters once when it
occurs and again in present value as rental income on added capital. The
double-counting implies over-statement of levels of GDP and national income.
Across countries, those with higher propensities to invest artificially look
richer gauged by per capita GDP. There is also exaggeration of capital-income
shares. An alternative measure involves a form of full expensing of gross
investment. In the steady state, revised product and income correspond to
consumption. Outside of the steady state, the measure deviates from consumption
because full expensing applies to the long-run flow of gross investment.
You may purchase
this paper on-line in .pdf format from SSRN.com ($5) for electronic delivery
Also see
https://marginalrevolution.com/marginalrevolution/2019/07/robert-barro-says-we-double-count-investment.html
The Democratic Party will soon be writing a 2020 Election Platform. What I
fear is that this platform will overlook the following question:
What will the Democratic Party do for pension savings?
Like it or not pension savings are very fragile for the USA's hundreds of
millions of city workers, county workers, state workers, hotel workers, auto
workers, teachers, college employees, and nearly all other workers in the public
and private sectors.
The problem is that most every worker's pension savings
balance is dependent upon capital market values (e.g., stock prices, bond
prices, and real estate prices).
The 2020 Democratic Party Platform will likely propose new social spending
programs for green initiatives, free medical care, free medications, student
loan forgiveness followed by free college for everybody, guaranteed annual
income for 350+ USA residents, housing-for all, reparations for African and Native Americans, and
billions for new subsidized housing on top of existing safety nets such as food
stamps and welfare and housing.
Taxes will have to be increased annually by trillions of dollars to pay for
these new social programs.
Stock markets in the USA just reached all-time highs. The question is whether
those increased trillions in taxes will crash the capital markets
and, thereby, wipe out the pension savings of hundreds of
millions or workers.
To date the Democratic Party is vague about how it will fund the trillions of
dollars planned annually for new social programs.
How will pension savings be preserved when trillions in new taxes are
proposed?
What will keep stock markets from crashing?
For example, will free college for students wipe out the pension savings of
their parents in funds like CalPERS, CREF, Fidelity, Vanguard, e
In OECD nations (think Finland, Denmark, Germany, and Norway) that have free
college or free job training, well over half of the Tier 2 graduates are
not even allowed to go to college or receive free job
training paid for by their governments. This makes "free college" or
"free training" affordable by limiting it only to top graduates . . .
https://en.wikipedia.org/wiki/List_of_countries_by_tertiary_education_attainment
Bernie Sanders’s housing-for-all plan, explained
---
https://www.vox.com/2019/9/19/20873224/bernie-sanders-housing-for-all
The Atlantic: But the profits of health
insurers are not that exorbitant compared with other parts of the health-care
system. And in fact, many scholars suggest that American health care is so
dysfunctional because it simply costs too much. That’s the fault of doctors,
drugmakers, and hospitals, too, not just insurers ---
https://www.theatlantic.com/health/archive/2019/07/kamala-harris-blames-health-insurers-she-right/595252/?utm_source=newsletter&utm_medium=email&utm_campaign=politics-daily-newsletter&utm_content=20191101&silverid-ref=NTk4MzY1OTg0MzY5S0
Nancy Pelosi Is 'Not a Big Fan of Medicare For All’ ---
https://townhall.com/tipsheet/juliorosas/2019/11/01/nancy-pelosi-is-not-a-big-fan-of-medicare-for-all-n2555747?utm_source=thdaily&utm_medium=email&utm_campaign=nl&newsletterad=11/02/2019&bcid=b16c6f948f297f77432f990d4411617f&recip=17935167
**How to Mislead With Political False Promises
Updates on Medical Insurance
Leading Leftist Economists Split over Feasibility of
Medicare-for-All
Lawrence Summers ---
https://en.wikipedia.org/wiki/Lawrence_Summers
Paul Krugman ---
https://en.wikipedia.org/wiki/Paul_Krugman
Former Harvard University President and USA Treasury
Secretary under President Obama argues that Medicare-for-All replacement of
private sector coverage is not feasible
---
https://theintercept.com/2019/11/03/joe-biden-larry-summers-elizabeth-warren-medicare-for-all/
Especially look at
https://www.washingtonpost.com/opinions/2019/11/05/warrens-plan-finance-medicare-for-all-pushes-into-dangerous-uncharted-territory/
Also see his comments on a wealth tax intended to partially fund
Medicare-for-All
https://marginalrevolution.com/marginalrevolution/2019/10/summers-on-the-wealth-tax.html
Hillary Clinton Is Not a Fan of Bernie’s or Warren’s Wealth
Taxes ---
Click Here
She thinks they’re “unworkable” and would be “incredibly disruptive.”
Former Princeton Nobel Economist and New York
Times Columnist Paul Krugman argues that Medicare-for-All replacement of
private sector coverage is feasible
---
https://www.nytimes.com/2019/11/01/opinion/did-warren-pass-the-medicare-test-i-think-so.html
Jensen Comment
By the way, the radical Paul Krugman will no longer be subjected to the
editorial restraints of the New York Times--
https://krugman.blogs.nytimes.com/2017/12/06/the-blog-moves-on/?module=BlogPost-Title&version=Blog
Main&contentCollection=Opinion&action=Click&pgtype=Blogs®ion=Body
A message for regular readers of this blog: unless
something big breaks later today, this will be my last day blogging AT THIS
(NYT) SITE. The Times is consolidating the
process, so future blog-like entries will show up at my regular
columnist page. This should broaden the
audience, a bit, maybe, and certainly make it easier for the Times to
feature relevant posts.
It will also, for technical reasons, make my life
simpler — you’d be surprised how many hoops I
have to go through to get these (NYT) things
posted. But that’s not the reason.
Anyway, I expect to be
doing the same sort of thing, mixing regular columns with stuff, usually
wonkish, that doesn’t belong in the regular paper. Old blog posts will
remain available
Paul Krugman
Jensen Comment
One of the things I don't like about Paul Krugman is his
inconsistency in bending his economics to fit his
political agenda.
The "social safety net" includes such things as free medical
care, free education, food stamps, housing subsidies, and welfare.
Open immigration can’t exist with a strong
social safety net; if you’re going to assure healthcare and a decent income to
everyone, you can’t make that offer
global ---
Paul Krugman
https://www.goodreads.com/quotes/724654-open-immigration-can-t-exist-with-a-strong-social-safety-net
But now that Paul Krugman wants Elizabeth Warren or
Bernie Sanders to be President of the USA he changed his tune about a global
offer and promotes a honey pot of safety nets to
anybody who can sneak across the USA border, including
free medical care, free education, food stamps, housing subsidies, and
guaranteed annual income.
You can't have it both ways on global offers Paul.
Elizabeth Warren Finally Says How She'll Pay for Medicare for All
https://www.bloomberg.com/news/articles/2019-11-01/warren-pays-for-medicare-for-all-by-taxing-companies-wealthy?cmpid=BBD110119_BIZ&utm_medium=email&utm_source=newsletter&utm_term=191101&utm_campaign=bloombergdaily
Senator Elizabeth Warren said she would fund her
version of Medicare for All with taxes on large corporations and the
wealthy, a tax evasion crackdown, a reduction in defense spending and by
putting newly legalized immigrants on the tax rolls.
Her advisers also lowered the estimate of Medicare for
All’s price-tag to $20.5 trillion over 10 years from the $34 trillion the
Urban Institute predicted, by using the new Medicare-for-All negotiating
power to slash administrative spending, drug prices and provider payments.
Jensen
Comment
She
also promises that there will be zero taxes on the middle class to pay
for Medicare-for-All, Free College, Guaranteed Annual Income, Reparations, and
on and on and on.
The
promise of zero taxes on the middle class is misleading. Who does she think
ultimately pays for the taxes on large corporations? Large corporations don't
pay taxes. They collect taxes from their customers
which in most cases are the poor and the middle class customers.
And
what happens if you confiscate the wealth of Americans. They have to liquidate
their investments in stocks and real estate, thereby confiscating the pensions
and savings of the poor and middle class.
Notice
that she never says how she will keep pension funds viable when the stock
markets crash!
How to Mislead With Political False Promises
Elizabeth Warren Finally Says How She'll Pay for Medicare for All (Yeah Right!)
https://www.bloomberg.com/news/articles/2019-11-01/warren-pays-for-medicare-for-all-by-taxing-companies-wealthy?cmpid=BBD110119_BIZ&utm_medium=email&utm_source=newsletter&utm_term=191101&utm_campaign=bloombergdaily
Senator Elizabeth Warren said she would fund her
version of Medicare for All with taxes on large corporations and the
wealthy, a tax evasion crackdown, a reduction in defense spending and by
putting newly legalized immigrants on the tax rolls.
Her advisers also lowered the estimate of Medicare for
All’s price-tag to $20.5 trillion over 10 years from the $34 trillion the
Urban Institute predicted, by using the new Medicare-for-All negotiating
power to slash administrative spending, drug prices and provider payments.
Jensen
Comment
She
also promises that there will be zero taxes on the middle class to pay
for Medicare-for-All, Free. Plus she did not factor in the additional trillions
for Green Initiatives, Free College, Guaranteed Annual Income, Reparations, and
on and on and on.
Her
promise of zero taxes on the middle class is misleading. Who does she think
ultimately pays for the taxes on large corporations (think Walmart, Amazon, and
Exxon)? Large corporations don't pay taxes.
They collect taxes in prices to their customers which in
most cases are the poor and the middle class customers. Warren will
even collect from transactions that are exempt from sales tax such as when the
Pentagon pays billions to Boeing for aircraft and Microsoft for cloud services.
And
what happens if you confiscate the wealth of Americans. They have to liquidate
their investments in stocks and real estate, thereby confiscating the pensions
and savings of the poor and middle class.
“80%
of the assets of the rich are publicly traded stocks, bonds, real estate (upon
which most of the USA's pension and savings plans depend) ---
https://www.factcheck.org/2019/06/facts-on-warrens-wealth-tax-plan/
Notice that she never says how she will keep savings
investments pension pension incomes viable when the stock markets crash for
good!
Facts on Warren’s Wealth Tax Plan ---
https://www.factcheck.org/2019/06/facts-on-warrens-wealth-tax-plan/
. . .
How would the (wealth) tax revenues be spent?
Warren
is banking on a $2.75 trillion revenue projection from Zucman and Saez to
fund a host of her priorities. In speeches,
she has laid
out those beneficiaries:
-
Universal child care for every child age 0 to 5.
-
Universal pre-K for every 3- and 4-year old.
-
Raise wages for all child care workers and preschool teachers “to the
professional levels that they deserve.”
-
Free tuition and fees for all public technical schools, 2-year colleges
and 4-year colleges.
-
$50 billion for historically black colleges and universities.
-
Forgive student loan debt for 95% of those with such debt.
-
$100 billion over 10 years to combat the opioid
crisis.
-
“Down
payments” on a Green New Deal and
Medicare for All.
The Warren campaign estimates the first three programs — dealing with child
care and universal pre-K — would cost about $700 billion over 10 years. And
the next three — free public college tuition, money for historically black
colleges and canceling most student loan debt — would cost about $1.25
trillion over 10 years. That would leave more than about $750 billion for
the Green New Deal and Medicare for All, the campaign says. That’s not
enough to fully fund either one, but Warren says it is enough for a “down
payment” on each.
How reliable is Warren’s $2.75 trillion revenue forecast?
Whether Warren’s plan would actually raise $2.75 trillion is a matter of
debate among economists.
The $2.75
trillion forecast comes
from Zucman and Saez. To estimate how much revenue the tax would generate on
wealth over $50 million, the economists used data from the Survey
of Consumer Finances from the Federal Reserve Board and the Distributional National
Accounts recently created by economist Thomas
Piketty,
Saez and Zucman. To estimate the revenue from the tax on billionaires, the
economists used the Forbes 400 list of the richest 400 Americans in 2018.
Zucman and Saez estimated that people would reduce their reported wealth by
15% “through a combination of tax evasion and tax avoidance.” The authors
wrote that “recent research shows that the extent of wealth tax
evasion/avoidance depends crucially on loopholes and enforcement. The
proposed wealth tax has a comprehensive base with no loopholes and is well
enforced through a combination of systematic third party reporting and
audits. Therefore, the avoidance/evasion response is likely to be small.”
But some economists think that assumption is too rosy.
While neither the Tax Policy Center nor the Tax Foundation has yet released
a full analysis of Warren’s plan, economists at both said there is reason to
believe Warren’s revenue estimate is too high.
Kyle Pomerleau,
chief economist and vice president of economic analysis at the nonprofit,
pro-business Tax Foundation, said that the assumption of 15% tax
evasion/avoidance is “actually the average avoidance for the entire U.S. tax
system, which is primarily the income tax and payroll tax. These taxes are,
in principle, much harder to avoid than a wealth tax because the transaction
(income) is hard to game or hide from the tax authorities. There is a good
record of how much you are being paid by your employer.”
“A wealth tax, on the other hand, is much harder to enforce,” Pomerleau
said. “For one, much of the wealth tax base doesn’t have a market price. For
example, we don’t really know how much a particular privately-held business
is worth because equity (stocks) in that company are not regularly traded on
the open market.”
Pomerleau also warned that because the wealth tax is a significant tax on
savings, it will discourage people from holding on to assets. “This effect
will reduce the potential tax base,” Pomerleau said, a trend that was not
accounted for in Warren’s estimate.
Howard Gleckman,
a senior fellow at the nonpartisan Tax Policy Center, has similar concerns.
“First, while her plan anticipates some tax avoidance, it will be very
difficult for the IRS to keep up with the tax planning that highly-paid
lawyers and accountants can devise,” Gleckman told us via email. “With so
much money at risk, the wealthy will have powerful incentives to hire smart
advisers to help avoid, or at least reduce, their tax liability.
“Second, a large share of wealth held by the high net worth taxpayers is in
the form of privately held businesses,” he said. “And these are notoriously
difficult to value. In effect, the IRS would have to prove that a taxpayer’s
valuation is unreasonably low.”
“I suspect she would collect less revenue than she predicts, but I cannot
say how much less,” Gleckman told us.
In an op-ed published
in the Washington Post on April 4,
Lawrence Summers, a Harvard
University professor who was treasury secretary from 1999 to 2001 and an
economic adviser to President Barack Obama in 2009 and 2010, and Natasha
Sarin, an assistant professor of law at the University of Pennsylvania Law
School and an assistant professor of finance at the Wharton School, took
direct aim at the $2.75 trillion estimate.
“Common-sense revenue estimates by economists who are not very deeply
steeped in revenue estimation tend to be overly optimistic,” Summers and
Sarin wrote.
The two looked at the U.S. experience with estate tax data and concluded
Warren’s wealth tax would only raise about 40% of the amount estimated by
Saez and Zucman. And that’s being “maximally optimistic about the wealth
tax’s revenue potential,” Summers and Sarin wrote.
“We suspect that to a great extent it reflects the myriad ways wealthy
people avoid paying estate taxes that in some form will be applicable in any
actually legislated wealth tax,” Summers and Sarin wrote. “These include
questionable appraisals; valuation discounts for illiquidity and lack of
control; establishment of trusts that enable division of assets among family
members with substantial founder control; planning devices that give some
income to charity while keeping the remainder for the donor and her
beneficiaries; tax-advantaged lending schemes; and other complex devices
known only to sophisticated investors. Except for reducing a naive
calculation by 15 percent, Saez and Zucman do not seem to take account of
these devices.”
“If our suspicion is correct, such a wealth tax will not yield the revenue
that its proponents hope for, and that when actual scorekeepers score actual
proposals, their estimates will disappoint advocates,” they concluded.
“In our view, the $2.75T is not realistic,” Sarin wrote to us in an email.
“The closest we get based on extrapolation from the estate tax (which seems
relevant because it involves a very similar population and thus many of the
same evasion incentives and possibilities) is around 40% of this estimate.”
In an email response to FactCheck.org, Saez challenged the Summers and Sarin
use of the estate tax to estimate the effects of Warren’s wealth tax
proposal.
“It is well known that the estate tax is very poorly enforced and that the
rich manage to largely avoid/evade it by giving to heirs before death,
spouses, and charity, using lots of trick to discount assets,” Saez wrote.
“We
have assumed an evasion rate of 15% based on the best literature on the
question (as we discuss in our letter and in more detail here),”
Saez
added.
Saez said the Summers-Sarin estimate that the tax on those with assets worth
more than $50 million would bring in just $25 billion a year implicitly
assumes “that over 90% of the wealth will be hidden.” That’s not reasonable,
Saez said, because
“80% of the assets of the rich are publicly traded stocks, bonds, real
estate for which there are clear market values
Continued in article
Urban Institute: From Incremental to Comprehensive Health Reform: How Various
Reform Options Compare on Coverage and Costs ---
https://www.urban.org/research/publication/incremental-comprehensive-health-reform-how-various-reform-options-compare-coverage-and-costs
Report:
From Incremental to Comprehensive Health
Insurance Reform: How Various Reform Options Compare on Coverage and Costs
Brief:
Comparing Health Insurance Reform Options: From
“Building on the ACA” to Single Payer
Blog Post:
Don’t
Confuse Changes in Federal Health Spending with National Health Spending
Policymakers, including candidates in the 2020 presidential campaign and
members of Congress, have proposed a variety of options to address the
shortcomings of the current health care system. These range from
improvements to the Affordable Care Act to robust single-payer reform.
There are numerous challenging trade-offs when choosing an approach to
health care reform, including covering the uninsured, improving the
affordability of health care, and raising the government funding required to
implement them. The public and policymakers alike need more information
about the potential effects of various health reform proposals.
This study, funded by the Commonwealth Fund, analyzes eight health care
reforms and their potential effects on health insurance coverage and
spending. Each of the analyzed reform proposals makes health insurance
considerably more affordable by reducing people’s premiums and cost sharing.
Some reforms also reduce US health care costs, and all require additional
federal dollars.
Key findings:
·
Within the existing public-private health care system, near universal
coverage and improved affordability could be achieved with moderate
increases in national health spending. Under
one of the plans modeled in the report, which proposes a mix of private and
public health insurance, everyone in the US could be covered except for
undocumented immigrants. The plan would enable workers to opt for subsidized
nongroup coverage instead of their employer’s insurance plan. It would also
improve the ACA’s subsidies to help people afford coverage, cover people in
states that have not expanded Medicaid, require everyone to have insurance
with an auto-enrollment backup, offer a public insurance option, and cap
provider payment rates.
Coverage and costs:
This reform plan achieves universal coverage for people legally present in
the US, covering 25.6 million people who would otherwise be uninsured.
However, the plan leaves 6.6. million undocumented immigrants without
coverage. National spending on health care would decrease modestly, by $22.6
billion or 0.6 percent, compared with current law in 2020. Federal
government spending would increase by $122.1 billion in 2020, or $1.5
trillion over 10 years.
·
One single-payer approach would leave no one uninsured and largely eliminate
consumers’ out-of-pocket medical costs but would require much greater
federal spending to finance. The
modeled “enhanced” single-payer system would cover everyone, including
undocumented immigrants. The reform would include benefits more
comprehensive than Medicare’s—including adult dental, vision, hearing, and
long-term services and supports—with no premiums or cost sharing. All
current forms of insurance for acute care would be eliminated, including
private insurance, Medicaid, and Medicare, and everyone residing in the US
would be covered by a new public insurance program. Providers would be paid
rates closer to Medicare’s. Health spending by employers would be
eliminated, and household and state health spending would decline
considerably while federal spending would increase significantly.
Coverage and costs:
This reform option covers the entire US population. National spending on
health care would grow by about $720 billion in 2020. Federal government
spending would increase by $2.8 trillion in 2020, or $34.0 trillion over 10
years.
·
A second single-payer approach can be constructed with lower federal and
system-wide costs. In
addition to the enhanced single-payer plan above, researchers examined a
single-payer “lite” plan that is similar to the enhanced version but
includes cost sharing for out-of-pocket expenses based on income, adds fewer
new covered benefits, and only covers legally residing US residents.
Single-payer “lite” lowers total national health spending, decreasing health
spending by households, employers, and state governments and increasing
federal government spending by less than the enhanced single-payer reform.
Coverage and costs:
This reform plan achieves universal coverage for people legally present in
the US, covering 25.6 million people who were uninsured. However, the plan
leaves all 10.8 million undocumented immigrants without coverage (due to the
elimination of private insurance). National spending on health care would
decrease by $209.5 billion, or 6 percent, in 2020. Federal government
spending would increase by $1.5 trillion in 2020, or by $17.6 trillion over
10 years. The analysis demonstrates that there is more than one effective
approach to achieving universal health care coverage in the United States
and highlights the trade-offs of different reform strategies.
The analysis demonstrates that there is more than one effective approach to
achieving universal health care coverage in the United States and highlights
the trade-offs of different reform strategies.
Continued in article
Rob
Rrownstein: The Eye-Popping Cost of Medicare for All According to new
figures: more than the federal government will spend over the coming decade on
Social Security, Medicare, and Medicaid combined ---
https://www.theatlantic.com/politics/archive/2019/10/high-cost-warren-and-sanderss-single-payer-plan/600166/?utm_source=newsletter&utm_medium=email&utm_campaign=politics-daily-newsletter&utm_content=20191016&silverid-ref=NTk4MzY1OTg0MzY5S0
The Urban Institute estimates that a single-payer plan
would require $32 trillion in new tax revenue over the coming decade.
How big a lift is it to raise $32 trillion? It’s
almost 50 percent more than the total revenue the CBO projects Washington
will collect from the personal income tax over the next decade (about $23.3
trillion). It’s more than double the amount the CBO projects Washington will
collect over the next decade from the payroll tax that funds Social Security
and part of Medicare (about $15.4 trillion).
Jensen
Comment
And the Medicare for All Spending initiative is a relatively small part of what
most 2020 Presidential Candidates (except for Biden) want to spend on social
programs. To the average $3.2 trillion annual cost of Medicare for All the
annual cost of their Green Initiatives,
free medications, student loan forgiveness followed by free college for
everybody, guaranteed annual income for 350+ USA residents, housing-for all,
reparations for African and Native Americans, and billions for new subsidized
housing on top of existing safety nets such as food stamps and welfare and
housing.
Add to
this the free medical care, free college, housing, and food advertising for poor
people all over the world in cross-over-the-border invitations and you're easily
talking over $20 trillion per year. Whereas President Obama deported over a
million undocumented immigrants, the 2020 candidates are inviting people to
cross over the USA borders.
The
most misleading statement in the October 15, 2019 debates was Elizabeth Warren's
comment that she will not promote any "spending program that taxes the middle
class." But notice that she says nothing about destruction of the middle class
pensions dependent upon stock market prices (think CREF and CalPERS). She's
probably right about middle income retirees not paying more taxes. We won't have
any incomes left to tax if you destroy the stock markets.
And
when the stock markets are destroyed unemployment will soar because business
firms will lose the ability to raise capital necessary for operating businesses.
Businesses can turn to government for capital, but the cupboard will be bare due
to all the social programs draining $20 trillion from the economy.
Why did the number of working class college degrees increase when England
started charging tuition?
https://reason.com/2019/08/22/democrats-love-to-promise-free-college-but-why-did-u-k-recently-started-charging-tuition/
Jensen Comment
In the UK it became a choice of making free college available only to top
students (like in other EU nations) or to make it more widely available at
levels the UK taxpayers could not possibly provide without substantial
tuition supplements.
In OECD nations (think Finland, Denmark, Germany, and Norway) that have free
college or free job training, well over half of the Tier 2 graduates are not
even allowed to go to college or receive free job training paid for
by their governments. This makes "free college" or "free training" affordable by
limiting it only to top graduates . . .
https://en.wikipedia.org/wiki/List_of_countries_by_tertiary_education_attainment
The Democratic Party's 2020 Platform will assuredly not limit
the USA's free college to the very top high school graduates.
Current Democratic Party proposals for free college cannot possibly be sustained
at the number of students they hope to educate or train for free,
“You have to make decisions that you’re going
to reach certain goals, and some of our goals we
think are achievable”
Nancy Pelosi
In Europe and Elsewhere Free College Education Means College is Only for the
Intellectually Elite
Countries that provide more public funding for higher education tend to have
fewer graduates over all (restricting college education or free job training
to only the most intelligent 1/3 or Tier 2 graduates ---
https://www.insidehighered.com/news/2019/08/08/countries-often-sacrifice-postsecondary-attainment-when-they-expand-subsidies?utm_source=Inside+Higher+Ed&utm_campaign=5f76e299a1-DNU_2019_COPY_01&utm_medium=email&utm_term=0_1fcbc04421-5f76e299a1-197565045&mc_cid=5f76e299a1&mc_eid=1e78f7c952
Democratic politicians
-- many of them vying for their party's 2020 presidential nomination --
propose free college programs or other major investments in higher education
that reflect systems in countries like Finland and Sweden. But an American
Enterprise Institute report released
Thursday argues that when developed nations dedicate more public resources
to postsecondary education, they tend to produce fewer graduates.
The institute's customarily contrarian resident fellow, Jason Delisle, and
co-author Preston Cooper, an education research analyst at AEI, compared 35
high-income (gross domestic product per capita above $30,000) member
countries of the Organisation for Economic Co-operation and Development,
which produces statistics on countries’ total institutional spending,
college attainment rates among 25- to 34-year-olds, and government
subsidies. The OECD includes almost all large Western and Central European
countries, Australia, the Baltic states, Chile, Israel, Japan, New Zealand,
North America, Scandinavia, South Korea and Turkey.
Each country makes sacrifices when it prioritizes one aspect of higher
education -- attainment rates, institutional spending and government
subsidies -- over another, Delisle said, a reality he thinks is often
ignored during debates about free college. Politicians in the U.S. like to
suggest America can “learn from other countries and take the good parts” of
their education systems, without considering the impact subsidized education
has on the overall quality and accessibility of college, Delisle said.
“If you have a heavily subsidized system, that leads a country to ration
higher education, leading to a system that’s more selective,” Delisle said. “That’s
not an egalitarian higher education policy, which a lot of policy makers on
the left insist is the case.”
“If you want less college, one way to do that is to make it free,” he
said.
Delisle’s interest in researching international spending on higher education
was piqued during the 2016 presidential campaign, he said, when Senator
Bernie Sanders, the Vermont Independent, began promoting his plan to
eliminate the cost of attending public colleges and universities. More
recently, on June 24, Sanders announced his College
for All Act,
which if passed would eliminate tuition at public institutions and subsidize
learning with 100 percent government funding -- 67 percent from Washington
and 33 percent from individual states.
“[The legislation] makes certain that all Americans, regardless of income,
can get the college education or job training they need to secure
decent-paying jobs by making public colleges, universities and trade schools
tuition-free and debt-free,” Sanders said in a news
release.
However, college admissions would become much more competitive if the U.S.
could not rely on tuition to fund its institutions, Delisle said, though the
goal of free college policy suggestions is to increase the number of
students with degrees.
“The whole public university system in Finland has an admissions rate on par
with elite U.S. colleges,” Delisle said. “Not quite as selective as Harvard
or the [Ivy League colleges], but if you took a Berkeley, or a [University
of Virginia] -- imagine if the entire education system of the U.S. had to
meet UVA-level test scores.”
In the report, Delisle highlights Finland, which ranks first among the 35
countries in government subsidies provided for tertiary education
(international equivalent to an associate degree or higher in the U.S.).
Ninety-six percent of Finland’s higher education resources are public, but
its attainment rate -- the proportion of citizens ages 25 to 34 with a
degree beyond K-12 education -- is less than 45 percent, placing it 25th
among OECD countries. South Korea-based higher education, on the other hand,
gets about 36 percent of its funding from the government and achieves a
70 percent attainment rate, the highest among OECD countries, according to
the report.
The U.S. ranks 31st for subsidies and third when it comes to institutional
resources, which is measured as the amount of money -- a combination of
government funds and private dollars -- spent on each full-time-equivalent
student. These numbers are also adjusted for a country’s GDP per capita, so
as not to penalize countries with smaller economies for spending less.
The report praises more investment in higher education from government and
private sources as positive, suggesting that “generally, institutions with
greater resources have more latitude to offer a high-quality education.”
This could bring criticism from “our colleagues on the right” who prioritize
spending reductions, Delisle said.
“We gave [spending] a positive spin, and we also gave attainment a positive
spin,” Delisle said. “There are definitely people on the right who would
say, ‘We have too many people with college degrees and spend too much on
higher education.’”
The OECD includes subsidized student loan programs in its spending metrics,
so while governments in the U.S., U.K. and Australia are increasingly
providing loans and debt forgiveness, that’s not counted as public funding
in the report, Delisle said. Instead, student loans are considered
individual expenditures on tuition, though they could be paid off by these
governments in the future.
Loans should be kept in mind when reading the report, Delisle said, but they
don’t have enough impact in the U.S. to shift the country’s ranking, since
the government uses more of a “safety net” model for specific groups of
students in need. But forgiven loans make up a higher share of Australia’s
and the U.K.’s subsidies, which can’t be seen in the OECD data, he said.
There are other contextual differences between countries that are also
absent from data in the report, because these differences are vast and
difficult to measure, Delisle said. One variance -- countries’ typical age
range for college attainment -- could affect how the report is read, said
Alex Usher, president of Higher Education Strategy Associates.
While the AEI report analyzes 25- to 34-year-olds who may or may not have
degrees, students in Nordic countries tend to start college later and often
take breaks from their learning to participate in the labor market, Usher
said. Additionally, Nordic countries have a lower wage premium for
college-educated adults than the U.S., he said.
“Those countries tend to look fantastic when you look at adult education --
it’s actually adults who are going back and forth and taking breaks” from
higher ed, Usher said. “Here, it’s normal at age 25 to have a degree. There,
it’s not so normal.”
Continued in article
Sen. Bernie Sanders and Rep. Ilhan Omar on Monday proposed legislation to
cancel all federal and private student-loan debt, carried by about 45 million
Americans ---
https://www.chronicle.com/article/No-Exceptions-No-Questions/246553?utm_source=at&utm_medium=en&cid=at
Wall Street lashes out at Bernie Sanders' plan to pay off student debt
with a securities trading tax ---
https://www.investmentnews.com/article/20190624/FREE/190629961/wall-street-lashes-out-at-bernie-sanders-plan-to-pay-off-student
Jensen Comment
The problem is compounded by the fact that progressives want to spend tens of
trillions needed to fund debt forgiveness and free college in future years,
including spending programs for green initiatives, free medical care, free
medications, student loan forgiveness followed by free college for everybody,
guaranteed annual income for 350+ million USA residents, housing-for-all,
reparations for African and Native Americans, and billions housing-for-all on top of
existing safety nets such as food stamps and welfare and housing.
Bernie Sanders also wants to make you believe banks and brokerages will be
paying the $20 trillion annually. Absolute lie! Business firms don't pay taxes.
They collect taxes from customers. A tax imposed on brokerage transactions hits
pension funds for teachers, firefighters, professors, trash haulers, middle
class investors, and wealthy investors. Taking $100 trillion from brokerage
transactions (even if it were possible) would shut down stock markets and bond
markets and bankrupt pension funds.
The cost student debt forgiveness alone is nearly equal to all $1.7+ trillion
Federal income tax revenue currently used to fund existing government spending
---
https://www.usdebtclock.org/
Vague references are made to are made to taking the $1.6+ trillion
from rich investors, but no mention is made of how the aggregated cost of this
$1.6 trillion added to other new spending programs costing $100 trillion will
crash the stock, bond, and real estate markets.
When combined with free college education for anybody who wants it this will
make funding more difficult for $100 trillion in green initiatives,
Medicare-for-All, free medications for all, free nursing homes, guaranteed
annual income for 350+ million residents, reparations for black and native
Americans, and so on down the 2020 socialist democratic wish list.
My guess is that Sanders would not have backed this in current legislation if
it had a chance of getting the approval of the Senate and President Trump. If it
passed it would greatly complicate his other spending plans, especially
Medicare-for-All.
The ultimate cost of all this spending will be borne by USA pension fund
holders (think CREF and CalPERS) since pension funds depend mostly upon stock,
bond, and real estate markets that will crash if you take
$100+ trillion
from investors in any form whatsoever.
Progressive spenders never talk about how they will save USA's pension
funds for teachers, municipal workers, business workers, etc.
The bottom line is that for most student borrowers
the funding of the student-loan cancellation will wipe out the pension funds of
their parents.
Wall Street lashes out at Bernie Sanders' plan to pay off student debt
with a securities trading tax ---
https://www.investmentnews.com/article/20190624/FREE/190629961/wall-street-lashes-out-at-bernie-sanders-plan-to-pay-off-student
Jensen Comment
The problem is compounded by the fact that progressives want to spend tens of
trillions more on things other than student debt forgiveness and free college in
future years, including spending programs for green initiatives, free medical
care, free medications, student loan forgiveness followed by free college for
everybody, guaranteed annual income for 350+ USA residents, reparations for
African and Native Americans, and billions for new subsidized housing on top of
existing safety nets such as food stamps and welfare and housing.
Bernie Sanders also wants to make you believe banks and brokerages will be
paying the $100 trillion dollars. Absolute lie! Business firms don't pay taxes.
They collect taxes from customers. A tax imposed on brokerage transactions hits
pension funds for teachers, firefighters, professors, trash haulers, middle
class investors, and wealthy investors. Taking $100 trillion from brokerage
transactions (even if it were possible) would shut down stock markets and bond
markets and bankrupt pension funds.
The cost student debt forgiveness alone is nearly equal to all $1.7+ trillion
Federal income tax revenue currently used to fund existing government spending
---
https://www.usdebtclock.org/
Vague references references are made to are made to taking the $1.6+ trillion
from rich investors, but no mention is made of how the aggregated cost of this
$1.6 trillion added to other new spending programs costing $100 trillion will
crash the stock, bond, and real estate markets.
When combined with free college education for anybody who wants it this will
make funding more difficult for $100 trillion in green initiatives,
Medicare-for-All, free medications for all, free nursing homes, guaranteed
annual income for 350+ million residents, reparations for black and native
Americans, and so on down the 2020 socialist democratic wish list.
My guess is that Sanders would not have backed this in current legislation if
it had a chance of getting the approval of the Senate and President Trump. If it
passed it would greatly complicate his other spending plans, especially
Medicare-for-All.
The ultimate cost of all this spending will be borne by USA pension fund
holders (think CREF and CalPERS) since pension funds depend mostly upon stock,
bond, and real estate markets that will crash if you take
$100+ trillion
from investors in any form whatsoever.
Progressive spenders never talk about how they will save USA's pension
funds for teachers, municipal workers, business workers, etc.
The bottom line is that for most student borrowers
the funding of the student-loan cancellation will wipe out the pension funds of
their parents.
When England got rid of free college, enrollment
expanded, expenditure per student expanded, and inequality of access did NOT
increase ---
https://twitter.com/Noahpinion/status/1145783708802097152
Bernie Sanders’s housing-for-all plan,
explained ---
https://www.vox.com/2019/9/19/20873224/bernie-sanders-housing-for-all
How to Mislead With Statistics
Washington Post: Bernie Sanders and other Democrats are embracing free
college. Europe shows it can be done, but there’s a cost.
https://www.washingtonpost.com/world/europe/bernie-sanders-and-other-democrats-are-embracing-free-college-europe-shows-theres-a-cost/2019/06/25/2939047c-8bc4-11e9-b6f4-033356502dce_story.html?utm_term=.fcf29f7bfba6
Jensen Comment
I don't know how often I have to keep repeating something that the NYT,
Washington Post, Time Magazine, and other liberal media won't mention. These
news sources keep repeating the message that college education is free in
Europe. Yes it is free in most European nations, but these news outlets never
mention that it's only free for the intellectually elite. Unless you're in the
top third (or so) of your Tier 2 school (read that high school) you can't even
go to college let alone get a free college education. This is not at all what
Bernie Sanders and Elizabeth Warren have in mind for the USA which is providing
a free college education for any of the 350+ million residents of the USA who
want a college education.
In OECD nations (think Finland, Denmark, Germany, and Norway) that have free
college or free job training, well over half of the Tier 2 graduates are
not even allowed to go to college or receive free job
training paid for by their governments. This makes "free college" or
"free training" affordable by limiting it only to top graduates . . .
https://en.wikipedia.org/wiki/List_of_countries_by_tertiary_education_attainment
No --- Europe has not
shown that free college or free job training paid for by taxpayers can be done
for more than the top third of Tier 2 graduates. And yes this does hit minority
student hard since they are less likely to be in the top third.
And yes the top third of
USA's high school graduates and a nearly all of the USA's top minority students
get substantial financial aid for college. Most of the $1.6 trillion in student
debt is carried by students who were not so intellectually elite. These students
would not be eligible for a free college education or free job training if they
lived in Europe.
And by the way, most of
the job training costs in Europe are paid for by employers rather than
taxpayers.
Why did the number of working class college degrees increase when England
started charging tuition?
https://reason.com/2019/08/22/democrats-love-to-promise-free-college-but-why-did-u-k-recently-started-charging-tuition/
Jensen Comment
In the UK it became a choice of making free college available only to top
students (like in other EU nations) or to make it more widely available at
levels the UK taxpayers could not possibly provide without substantial
tuition supplements.
In OECD nations (think Finland, Denmark, Germany, and Norway) that have free
college or free job training, well over half of the Tier 2 graduates are not
even allowed to go to college or receive free job training paid for
by their governments. This makes "free college" or "free training" affordable by
limiting it only to top graduates . . .
https://en.wikipedia.org/wiki/List_of_countries_by_tertiary_education_attainment
The Democratic Party's 2020 Platform will assuredly not limit
the USA's free college to the very top high school graduates.
Current Democratic Party proposals for free college cannot possibly be sustained
at the number of students they hope to educate or train for free,
“You have to make decisions that you’re going
to reach certain goals, and some of our goals we
think are achievable”
Nancy Pelosi
In Europe and Elsewhere Free College Education Means College is Only for the
Intellectually Elite
Countries that provide more public funding for higher education tend to have
fewer graduates over all (restricting college education or free job training
to only the most intelligent 1/3 or Tier 2 graduates ---
https://www.insidehighered.com/news/2019/08/08/countries-often-sacrifice-postsecondary-attainment-when-they-expand-subsidies?utm_source=Inside+Higher+Ed&utm_campaign=5f76e299a1-DNU_2019_COPY_01&utm_medium=email&utm_term=0_1fcbc04421-5f76e299a1-197565045&mc_cid=5f76e299a1&mc_eid=1e78f7c952
Democratic politicians
-- many of them vying for their party's 2020 presidential nomination --
propose free college programs or other major investments in higher education
that reflect systems in countries like Finland and Sweden. But an American
Enterprise Institute report released
Thursday argues that when developed nations dedicate more public resources
to postsecondary education, they tend to produce fewer graduates.
The institute's customarily contrarian resident fellow, Jason Delisle, and
co-author Preston Cooper, an education research analyst at AEI, compared 35
high-income (gross domestic product per capita above $30,000) member
countries of the Organisation for Economic Co-operation and Development,
which produces statistics on countries’ total institutional spending,
college attainment rates among 25- to 34-year-olds, and government
subsidies. The OECD includes almost all large Western and Central European
countries, Australia, the Baltic states, Chile, Israel, Japan, New Zealand,
North America, Scandinavia, South Korea and Turkey.
Each country makes sacrifices when it prioritizes one aspect of higher
education -- attainment rates, institutional spending and government
subsidies -- over another, Delisle said, a reality he thinks is often
ignored during debates about free college. Politicians in the U.S. like to
suggest America can “learn from other countries and take the good parts” of
their education systems, without considering the impact subsidized education
has on the overall quality and accessibility of college, Delisle said.
“If you have a heavily subsidized system, that leads a country to ration
higher education, leading to a system that’s more selective,” Delisle said. “That’s
not an egalitarian higher education policy, which a lot of policy makers on
the left insist is the case.”
“If you want less college, one way to do that is to make it free,” he
said.
Delisle’s interest in researching international spending on higher education
was piqued during the 2016 presidential campaign, he said, when Senator
Bernie Sanders, the Vermont Independent, began promoting his plan to
eliminate the cost of attending public colleges and universities. More
recently, on June 24, Sanders announced his College
for All Act,
which if passed would eliminate tuition at public institutions and subsidize
learning with 100 percent government funding -- 67 percent from Washington
and 33 percent from individual states.
“[The legislation] makes certain that all Americans, regardless of income,
can get the college education or job training they need to secure
decent-paying jobs by making public colleges, universities and trade schools
tuition-free and debt-free,” Sanders said in a news
release.
However, college admissions would become much more competitive if the U.S.
could not rely on tuition to fund its institutions, Delisle said, though the
goal of free college policy suggestions is to increase the number of
students with degrees.
“The whole public university system in Finland has an admissions rate on par
with elite U.S. colleges,” Delisle said. “Not quite as selective as Harvard
or the [Ivy League colleges], but if you took a Berkeley, or a [University
of Virginia] -- imagine if the entire education system of the U.S. had to
meet UVA-level test scores.”
In the report, Delisle highlights Finland, which ranks first among the 35
countries in government subsidies provided for tertiary education
(international equivalent to an associate degree or higher in the U.S.).
Ninety-six percent of Finland’s higher education resources are public, but
its attainment rate -- the proportion of citizens ages 25 to 34 with a
degree beyond K-12 education -- is less than 45 percent, placing it 25th
among OECD countries. South Korea-based higher education, on the other hand,
gets about 36 percent of its funding from the government and achieves a
70 percent attainment rate, the highest among OECD countries, according to
the report.
The U.S. ranks 31st for subsidies and third when it comes to institutional
resources, which is measured as the amount of money -- a combination of
government funds and private dollars -- spent on each full-time-equivalent
student. These numbers are also adjusted for a country’s GDP per capita, so
as not to penalize countries with smaller economies for spending less.
The report praises more investment in higher education from government and
private sources as positive, suggesting that “generally, institutions with
greater resources have more latitude to offer a high-quality education.”
This could bring criticism from “our colleagues on the right” who prioritize
spending reductions, Delisle said.
“We gave [spending] a positive spin, and we also gave attainment a positive
spin,” Delisle said. “There are definitely people on the right who would
say, ‘We have too many people with college degrees and spend too much on
higher education.’”
The OECD includes subsidized student loan programs in its spending metrics,
so while governments in the U.S., U.K. and Australia are increasingly
providing loans and debt forgiveness, that’s not counted as public funding
in the report, Delisle said. Instead, student loans are considered
individual expenditures on tuition, though they could be paid off by these
governments in the future.
Loans should be kept in mind when reading the report, Delisle said, but they
don’t have enough impact in the U.S. to shift the country’s ranking, since
the government uses more of a “safety net” model for specific groups of
students in need. But forgiven loans make up a higher share of Australia’s
and the U.K.’s subsidies, which can’t be seen in the OECD data, he said.
There are other contextual differences between countries that are also
absent from data in the report, because these differences are vast and
difficult to measure, Delisle said. One variance -- countries’ typical age
range for college attainment -- could affect how the report is read, said
Alex Usher, president of Higher Education Strategy Associates.
While the AEI report analyzes 25- to 34-year-olds who may or may not have
degrees, students in Nordic countries tend to start college later and often
take breaks from their learning to participate in the labor market, Usher
said. Additionally, Nordic countries have a lower wage premium for
college-educated adults than the U.S., he said.
“Those countries tend to look fantastic when you look at adult education --
it’s actually adults who are going back and forth and taking breaks” from
higher ed, Usher said. “Here, it’s normal at age 25 to have a degree. There,
it’s not so normal.”
Continued in article
Alexandria Ocasio-Cortez says her Green New Deal climate plan would cost at
least $10 trillion ---
https://www.businessinsider.com/alexandria-ocasio-cortez-says-green-new-deal-cost-10-trillion-2019-6
Jensen Comment
She forgot to include a few costly items like the cost of networking the USA
with electric high-speed rail that replaces airplanes and airports. She also
fails to mention the cost of wiping out most employee pension funds due to
green-initiative plan costs combined with free medical insurance, free nursing
homes, free medications, free college, guaranteed annual income for 350+ million
residents of the USA, interest on $22+ trillion of national debt, combined with
existing free food stamps, free housing, Social Security benefits,
pensions, and other safety nets you're talking over $100 trillion per year.
Both
the Joe Biden and Elizabeth Warren green-initiative plans draw on the
progressive Green New Deal, prioritize environmental justice, and would be paid
for by closing corporate tax loopholes ---
https://psmag.com/news/green-jobs-and-new-technology-a-look-at-biden-and-warrens-latest-climate-plans?omhide
Jensen
Comment
If you start talking green-initiative plan costs combined with free medical
insurance, free nursing homes, free medications, free college, guaranteed annual
income for 350+ million residents of the USA, interest on $22+ trillion of
national debt, combined with existing free food stamps, housing subsidized,
Social Security benefits, pensions, and other safety nets you're talking over
$100 trillion per year. That cannot possibly be funded by closing corporate tax
loop holes, wealth taxes, or a 100% marginal income tax rate on high salaried
people --- and if you try to do so you will wipe out virtually all pension funds
of the USA.
It's
irresponsible for presidential candidates and their supporting media to promote
spending $100 trillion per year without also showing how this can be done
without destroying the stock markets, bond markets, and real estate markets
--- and the pension funds (think CREF and CalPERS) built almost entirely upon
those investor markets. My favorite example is how free college is
great for students but not if you zero out the pension funds of their parents.
Lets see the presidential candidates generate some
realistic numbers on how to support their new spending programs without
destroying pension savings in the USA.
Bernie Sanders’s housing-for-all plan,
explained ---
https://www.vox.com/2019/9/19/20873224/bernie-sanders-housing-for-all
**How to Mislead with Missing Variables
Young People Support Free College ---
https://www.insidehighered.com/news/2019/05/03/poll-support-free-college-among-young-people?utm_source=Inside+Higher+Ed&utm_campaign=f3e733cb11-DNU_2019_COPY_01&utm_medium=email&utm_term=0_1fcbc04421-f3e733cb11-197565045&mc_cid=f3e733cb11&mc_eid=1e78f7c952
Jensen Comment
This is a perfect example of what we call missing variables analysis. Free
college under Elizabeth Warren's plan will cost over a trillion dollars a year.
Add this to the yearly trillions her other proposed programs will cost.
The 2020 Democratic Party Platform will likely propose new social spending
programs for green initiatives, free medical care, free medications, student
loan forgiveness followed by free college for everybody, guaranteed annual
income for 350+ USA residents, reparations for African and Native Americans, and
billions for new housing-for-all, on top of existing safety nets such as food
stamps and welfare and housing.
The missing variable when young people "support free college" is the capital
market crash (think stock prices, bond prices, and real estate prices). New
annual spending for the above social programs will entail trillions in annual
taxation and most of those trillions will come out of the pockets of capital
markets investors and corporate profits. It's a virtual certainty that stock
markets will crash.
Now think of a young child of a university employee who's now enjoying
reports of record high pension savings in CREF. The USA stock markets are
currently at all-time highs. While that college employee's child is wishing for
free college that same child is not
considering what free college and the other spending programs mentioned will do
to capital markets --- spending that will almost certainly wipe out the value of
his or her parents' pension savings in TIAA/CREF.
Like it or not pension savings are very fragile for the USA's hundreds of
millions of city workers, county workers, state workers, hotel workers, auto
workers, teachers, college employees, and nearly all other workers in the public
and private sectors.
The problem is that most every worker's pension savings
balance is dependent upon capital market values (e.g., stock prices, bond
prices, and real estate prices).
How will pension savings be preserved when trillions in new taxes are
proposed?
What will keep stock markets from crashing at we tax capital market
investors and corporate profits for trillions of more dollars each year?
For example, will free college for all USA students wipe out the pension savings of
their parents in funds like CalPERS, CREF, Fidelity, Vanguard, etc.?
Progressives will counter that other nations manage to provide free college
and still have pension savings.
In OECD nations (think Finland, Denmark, Germany, and Norway) that have
free college or free job training, well over half of the Tier 2 graduates are not even allowed to go to college or receive free
job training paid for by their governments. This makes "free college"
or "free training" affordable by limiting it only to top graduates . . .
https://en.wikipedia.org/wiki/List_of_countries_by_tertiary_education_attainment
The Democratic Party's 2020 Platform will assuredly not
limit the USA's free
college to the very top high school graduates.
“You have to make decisions that you’re going to reach certain goals, and some
of our goals we think are
achievable”
Nancy Pelosi
"Plan for the best, but prepare for the worst"
Bob Jensen's fortune cookie on April 30, 2019 (my fortune cookie really did
say that).
Bernie Sanders’s housing-for-all plan,
explained ---
https://www.vox.com/2019/9/19/20873224/bernie-sanders-housing-for-all
Why did the number of working class college degrees increase when England
started charging tuition?
https://reason.com/2019/08/22/democrats-love-to-promise-free-college-but-why-did-u-k-recently-started-charging-tuition/
Jensen Comment
In the UK it became a choice of making free college available only to top
students (like in other EU nations) or to make it more widely available at
levels the UK taxpayers could not possibly provide without substantial
tuition supplements.
In OECD nations (think Finland, Denmark, Germany, and Norway) that have free
college or free job training, well over half of the Tier 2 graduates are not
even allowed to go to college or receive free job training paid for
by their governments. This makes "free college" or "free training" affordable by
limiting it only to top graduates . . .
https://en.wikipedia.org/wiki/List_of_countries_by_tertiary_education_attainment
The Democratic Party's 2020 Platform will assuredly not limit
the USA's free college to the very top high school graduates.
Current Democratic Party proposals for free college cannot possibly be sustained
at the number of students they hope to educate or train for free,
“You have to make decisions that you’re going
to reach certain goals, and some of our goals we
think are achievable”
Nancy Pelosi
In Europe and Elsewhere Free College Education Means College is Only for the
Intellectually Elite
Countries that provide more public funding for higher education tend to have
fewer graduates over all (restricting college education or free job training
to only the most intelligent 1/3 or Tier 2 graduates ---
https://www.insidehighered.com/news/2019/08/08/countries-often-sacrifice-postsecondary-attainment-when-they-expand-subsidies?utm_source=Inside+Higher+Ed&utm_campaign=5f76e299a1-DNU_2019_COPY_01&utm_medium=email&utm_term=0_1fcbc04421-5f76e299a1-197565045&mc_cid=5f76e299a1&mc_eid=1e78f7c952
Democratic politicians
-- many of them vying for their party's 2020 presidential nomination --
propose free college programs or other major investments in higher education
that reflect systems in countries like Finland and Sweden. But an American
Enterprise Institute report released
Thursday argues that when developed nations dedicate more public resources
to postsecondary education, they tend to produce fewer graduates.
The institute's customarily contrarian resident fellow, Jason Delisle, and
co-author Preston Cooper, an education research analyst at AEI, compared 35
high-income (gross domestic product per capita above $30,000) member
countries of the Organisation for Economic Co-operation and Development,
which produces statistics on countries’ total institutional spending,
college attainment rates among 25- to 34-year-olds, and government
subsidies. The OECD includes almost all large Western and Central European
countries, Australia, the Baltic states, Chile, Israel, Japan, New Zealand,
North America, Scandinavia, South Korea and Turkey.
Each country makes sacrifices when it prioritizes one aspect of higher
education -- attainment rates, institutional spending and government
subsidies -- over another, Delisle said, a reality he thinks is often
ignored during debates about free college. Politicians in the U.S. like to
suggest America can “learn from other countries and take the good parts” of
their education systems, without considering the impact subsidized education
has on the overall quality and accessibility of college, Delisle said.
“If you have a heavily subsidized system, that leads a country to ration
higher education, leading to a system that’s more selective,” Delisle said. “That’s
not an egalitarian higher education policy, which a lot of policy makers on
the left insist is the case.”
“If you want less college, one way to do that is to make it free,” he
said.
Delisle’s interest in researching international spending on higher education
was piqued during the 2016 presidential campaign, he said, when Senator
Bernie Sanders, the Vermont Independent, began promoting his plan to
eliminate the cost of attending public colleges and universities. More
recently, on June 24, Sanders announced his College
for All Act,
which if passed would eliminate tuition at public institutions and subsidize
learning with 100 percent government funding -- 67 percent from Washington
and 33 percent from individual states.
“[The legislation] makes certain that all Americans, regardless of income,
can get the college education or job training they need to secure
decent-paying jobs by making public colleges, universities and trade schools
tuition-free and debt-free,” Sanders said in a news
release.
However, college admissions would become much more competitive if the U.S.
could not rely on tuition to fund its institutions, Delisle said, though the
goal of free college policy suggestions is to increase the number of
students with degrees.
“The whole public university system in Finland has an admissions rate on par
with elite U.S. colleges,” Delisle said. “Not quite as selective as Harvard
or the [Ivy League colleges], but if you took a Berkeley, or a [University
of Virginia] -- imagine if the entire education system of the U.S. had to
meet UVA-level test scores.”
In the report, Delisle highlights Finland, which ranks first among the 35
countries in government subsidies provided for tertiary education
(international equivalent to an associate degree or higher in the U.S.).
Ninety-six percent of Finland’s higher education resources are public, but
its attainment rate -- the proportion of citizens ages 25 to 34 with a
degree beyond K-12 education -- is less than 45 percent, placing it 25th
among OECD countries. South Korea-based higher education, on the other hand,
gets about 36 percent of its funding from the government and achieves a
70 percent attainment rate, the highest among OECD countries, according to
the report.
The U.S. ranks 31st for subsidies and third when it comes to institutional
resources, which is measured as the amount of money -- a combination of
government funds and private dollars -- spent on each full-time-equivalent
student. These numbers are also adjusted for a country’s GDP per capita, so
as not to penalize countries with smaller economies for spending less.
The report praises more investment in higher education from government and
private sources as positive, suggesting that “generally, institutions with
greater resources have more latitude to offer a high-quality education.”
This could bring criticism from “our colleagues on the right” who prioritize
spending reductions, Delisle said.
“We gave [spending] a positive spin, and we also gave attainment a positive
spin,” Delisle said. “There are definitely people on the right who would
say, ‘We have too many people with college degrees and spend too much on
higher education.’”
The OECD includes subsidized student loan programs in its spending metrics,
so while governments in the U.S., U.K. and Australia are increasingly
providing loans and debt forgiveness, that’s not counted as public funding
in the report, Delisle said. Instead, student loans are considered
individual expenditures on tuition, though they could be paid off by these
governments in the future.
Loans should be kept in mind when reading the report, Delisle said, but they
don’t have enough impact in the U.S. to shift the country’s ranking, since
the government uses more of a “safety net” model for specific groups of
students in need. But forgiven loans make up a higher share of Australia’s
and the U.K.’s subsidies, which can’t be seen in the OECD data, he said.
There are other contextual differences between countries that are also
absent from data in the report, because these differences are vast and
difficult to measure, Delisle said. One variance -- countries’ typical age
range for college attainment -- could affect how the report is read, said
Alex Usher, president of Higher Education Strategy Associates.
While the AEI report analyzes 25- to 34-year-olds who may or may not have
degrees, students in Nordic countries tend to start college later and often
take breaks from their learning to participate in the labor market, Usher
said. Additionally, Nordic countries have a lower wage premium for
college-educated adults than the U.S., he said.
“Those countries tend to look fantastic when you look at adult education --
it’s actually adults who are going back and forth and taking breaks” from
higher ed, Usher said. “Here, it’s normal at age 25 to have a degree. There,
it’s not so normal.”
Continued in article
Trump’s Tariffs Only Work If Americans Pay Them
---
http://nymag.com/intelligencer/2019/05/trumps-china-tariffs-only-work-if-americans-pay-them.html
Jensen Comment
Actually Trump's tariffs work better at hurting the
Chinese economy if Americans don't pay them
just like Chinese tariffs (think soybeans) hurt American farmers when the
Chinese refuse to pay.
Demand Curve ---
https://en.wikipedia.org/wiki/Demand_curve
Example, tariffs hurt exporters if foreign customers learn to
live with less or find substitute suppliers. For example, China is learning how
to live with less soybeans. The USA is learning how to live with fewer imported
Chinese goods and in many cases shifting to other foreign suppliers like Chile,
South Korea, Indonesia, and Bangladesh.
American tariffs do work if Americans don't pay them. Chinese
tariffs work if the Chinese don't pay them. The problem is that both nations are
hurt badly with tariff walls. It hurts for Chinese to do with high quality
soybeans from the USA. It hurts to not have as much lithium coming from China
for use in batteries.
The problem is that economic issues in trade talks are turning
into face-saving politics where each nation is shooting itself in the foot with
pride and politics.
For academics, what matters more: journal prestige or readership?
https://www.sciencemag.org/careers/2019/07/academics-what-matters-more-journal-prestige-or-readership
Jensen Comment
The more interesting question is more complicated depending upon what one means
by "journal." It also varies with needs of the academic. Exhibit A is Paul
Krugman who has a Nobel Prize in Economics and a very popular blog in the New
York Times. It's misleading to compare whether a NYT Blog article or an article
in liberal media magazine called Slate or an article in the Journal of
Political Economy matters most to Paul.
Paul Krugman ---
https://en.wikipedia.org/wiki/Paul_Krugman
An occasional publication in a very prestigious and rigorously refereed
article such as the JPE matters a great deal to Paul
for maintaining respect as an economic theorists.
But the following article a choosy popular press magazine (Slate) gets
across an important and controversial message that he wants to be read
worldwide. For example, the following reference is very important to him
because, in defending multinational corporations, he riled the core audience of
the liberal Slate and even riled his core constituency in general.
Publishing this article in the WSJ or JPE would not have had the same emotional
worldwide impact.
"In
Praise of Cheap Labor," by Paul Krugman,
Slate, March 21, 1997 ---
https://slate.com/business/1997/03/in-praise-of-cheap-labor.html
In this article Paul demonstrates academic independence which I'm sure pleased
him even though his core constituency emotionally disagrees with his conclusions
in this article.
But it must please him even more when he stirs up his conservative critics
--- something he does regularly in his NYT blog. Yeah I know that in most blogs
and Websites the publications do not pass through a rigorous refereeing process
that chooses whether to publish or not publish an article. But once published or
cited in a popular blog the article may obtain hundreds or thousands of
commentaries.
Paul Krugman’s Most Evil Idea ---
https://marginalrevolution.com/marginalrevolution/2019/08/paul-krugmans-most-evil-idea.html
Especially note to number and range of commentaries --- including my own comment
published on August 2, 2019:
Never fear. Paul Krugman will swoop down from
Fantasy Heaven and show the USA how to raise $20+ trillion dollars to fund
the Democratic Party platform programs for Green Initiative costs combined
with free Medicare-for-All, free medications, free nursing homes, free
college, guaranteed annual income for 350+ million residents of the USA,
interest on eventual $200+ trillion of national debt, free food, free
housing, Social Security benefits, pensions, and other safety nets. Please
swoop down and save the USA pensions and the rest of the USA economy Paul.
Meanwhile the economy seems to be rolling along
with relatively low unemployment and record stock prices and record pension
fund levels. Those damn Republicans are really killing us Paul --- that is
before you swoop down to make big improvements in our economy and its
incoming hordes of undocumented immigrants.
It never dawned on me that you can raise $20+
trillion just by using the printing presses.
Added Jensen Comment
My added point this morning is that I don't think you can compare whether
journal prestige or readership matters most to an academic. Too much depends
upon circumstances. Whether you are an untenured assistant professor or a Nobel
Prize winner publishing in a prestigious journal that is rigorously refereed is
very important for for respect among your academic peers. Blogging controversial
articles that are widely read around the world is very important if you've
already earned a Nobel Prize. Doing so as an untenured assistant professor is
not at all advisable when the articles are controversial.
Also blogging popular articles daily probably takes too
much time for an untenured assistant professor.
My point is that the importance of journal prestige versus
readership varies considerably with stage of life and emotional attachment to
causes (think politics). I don't think we can really answer the question of
whether a publication in JPE matters more or less to Paul Krugman. relative to
publishing an article in Slate or the NYT. All are vitally important to
him for different reasons. An untenured assistant professor does not get such
luxury.
How to Mislead With Statistics
Do the Rich Get All the Gains from Economic Growth?
https://medium.com/@russroberts/do-the-rich-capture-all-the-gains-from-economic-growth-c96d93101f9c?sk=0e4f1f8aba0dcb0674bdf34af8b3ec08
Jensen Comment
This article pretty well explains how leading economists mislead for political
purposes. It seems so obvious that in the USA virtually everybody has benefited
from economic growth even if all have not shared anywhere near equally in the
bounty of growth. Cubans, on the other hand, would have
shared equally if there had been any significant economic growth.
Why did Cuba
abandon its socialist/communist dream of equality for everybody?
The Guardian: This was the
egalitarian dream of Cuba in the 1960s: For years in Cuba, jobs as varied as
farm workers and doctors only had a difference in their wages of the equivalent
of a few US dollars a month.
https://www.theguardian.com/world/2008/jun/12/cuba
Jensen Comment
Only now is Cuba backtracking from its egalitarian dream by uncapping wages and
legalizing profits while liberals in the USA want to return again to the 1960s
Cuban dream.
May 2019
**How to Mislead With Statistics
Polls Say Biden, Bernie Could Beat Trump. Should You Believe Them?
https://reason.com/2019/04/29/polls-say-biden-bernie-could-beat-trump-should-you-believe-them/
Jensen Comment
What is the most misleading about an traditional political poll?
Answer: It's reported accuracy. For example, the Emerson College Poll claims
93% accuracy on election day.
What this ignores how the poll is at times before election day, especially over
a year before election day.
Polls tend to converge with considerable accuracy
on election day, but they are often way off base long before elections.
Right up to the day of election, the
population from which polls are sampled is usually a non-stationary process
that, in many instances, changes dramatically week to week.
Also the polls can be highly inaccurate in very close races. The 2016
Presidential election is a dramatic illustration of polling errors since
virtually all polls predicted Clinton would beat Trump.
The article pretty well explains why polls are misleading, especially over a
year in advance. One problem is that polls often intentially bias predictions
because they themselves favor certain candidates. They may become less biased
closer to election day in an effort to appear to be more accurate on election
day.
One ranking of poll accuracy ---
https://projects.fivethirtyeight.com/pollster-ratings/
The American Dream: Kurdish Immigrant Becomes a
Billionaire ---
TED Talk: Hamdi Ulukaya: The anti-CEO playbook ---
https://www.ted.com/talks/hamdi_ulukaya_the_anti_ceo_playbook?utm_source=newsletter_weekly_2019-05-24&utm_campaign=newsletter_weekly&utm_medium=email&utm_content=talk_of_the_week_image
Jensen Comment
This video is not as anti-business as it sounds, and the fact that Ulukaya
became a billionaire as a CEO entrepreneur proves it. But he did in a socially
responsible way with hiring of refugees and local workers and the sharing of
corporate equity with employees.
Some things are overlooked in this otherwise inspiring video. Firstly, employees
that have their savings invested in their employer's company need, at some point
like retirement, to liquidate their holdings. In other words,
they need some kind of market for their shares that have
increased in value on paper but not necessarily in liquidity. One way
of achieving liquidity is the cursed IPO when private corporate shares are going
public to get into a cash market for those shares. Then
investors start asking questions like what are the profits and what is the
financial security of this investment?
The bottom line is that this is a pro-capitalism video, and seemingly
anti-socialist if you watch it closely. But it's socially responsible capitalism
to a point of where employees and Ulukay himself (a billionaire on paper) want
to cash in on their shares.
The other thing to note about Ulaukaya's yogurt business is that this is a
labor-intensive business relative to more capital-intensive businesses (think
electric cars and pharmaceuticals) that need to justify "profits" or
"anticipated profits" to get investors to put money into the business.
Hence it's a great video for a business case where there's a lot to debate like
keeping wages relatively low by paying in ownership shares.
How to Mislead With Statistics: Error leads to recall of paper
linking Jon Stewart and election results (the authors later apologized)
---
http://retractionwatch.com/2019/05/14/this-is-how-science-works-error-leads-to-recall-of-paper-linking-jon-stewart-and-election-results/#more-92576
Jensen Comment
The authors' apologies for careless work summarize what happened. Interestingly,
a number of readers got suspicious beforehand.
**How to Mislead With Statistics and Biased Media
Reporting (the externality of motivating the police to do less and less and
less)
Here are the stories about police misconduct uncovered so far by a new
media partnership ---
https://www.latimes.com/local/lanow/la-me-police-files-roundup-20190319-story.html
Jensen Comment
It would also be nice if the media partnership also reported good conduct deeds
by law enforcement.
The real problem about reporting police misconduct is that "no action" can
easily go undetected. For example, in Baltimore police are now suspected of
simply looking the other way in the presence of rising street crimes and traffic
crimes. Or the police might create long delays until a relatively formidable
armed squad can be assembled before entering dangerous public housing complexes
and domestic dispute residences.
And police departments can be simply overwhelmed (think Chicago and
Baltimore) by the number of murders and rapes such that "investigations" become
badly understaffed and underfunded.
Meanwhile minorities are the most impacted by reduced
police protections just like urban school children and their teachers are
subjected to more bullying and gang violence by paranoid school administrators
and security guards. Teachers in NYC now
complain that in some districts inmates have overtaken the asylum ---
https://www.manhattan-institute.org/html/school-discipline-reform-and-disorder-evidence-nyc-schools-10103.html
**How to Mislead With Statistics (missing variables)
American Economic Review: Who Pays for the
Minimum Wage? ---
https://www.aeaweb.org/articles?id=10.1257/aer.20171445&&from=f
Jensen
Comment
This is one of those studies with conclusions that are embedded in a whole lot
of unmentioned caveats. For example:
Does Hungary have anything close to the $2 trillion underground economy that
provides alternatives to the minimum wage for both employers and employees?
Are
there enormous differences between industries such as restaurant workers
versus landscape workers (in Texas there are probably more landscape workers
working in the underground economy than the
economy paying more and providing benefits)?
My own
opinion is that having an enormous underground economy changes everything about
minimum wage conclusions. Interestingly the underground economy may pay much
more than minimum wage, especially when there are skills (think auto mechanics)
or risks (think farm and yard chemicals) or enormous discomforts (think of
working on a metal roof under Arizona's sun). But even when there relatively
high wages there are seldom underground economy benefits like medical insurance
and unemployment compensation and pension contributions.
Bob
Jensen's threads on the underground economy ---
http://www.cs.trinity.edu/~rjensen/temp/TaxNoTax.htm#Poor
**How to Mislead With Statistics (non-stationary data)
Macroeconomics ---
https://en.wikipedia.org/wiki/Macroeconomics
There's only one reliable rule of thumb in macroeconomics (so typical of
economics)---
https://www.themoneyillusion.com/theres-only-one-reliable-rule-of-thumb-in-macro/
In the 1950s, rates began
rising and frequent mild recessions were the new norm.
In the 1960s, one long
“Phillips Curve” expansion was the new norm. We had it all figured out.
In the 1970s, the Phillips
Curve fell apart, and we just had to live with stagflation.
In the 1980s, we didn’t
have to live with stagflation, but big deficits were the new norm.
In the 1990s, we achieved
budget surpluses and a Great Moderation (noninflationary boom), something no
one expected.
In the 2000s, the Great
Moderation collapsed into a deep recession that few expected (certainly not
me or Robert Lucas.) Also, America’s first big housing boom and bust. Also,
bank runs that were supposedly ended by FDIC.
In the 2010s, we had
near-zero interest rates even as the economy recovered and unemployment fell
to moderate levels. Also unexpected.
Every decade produces a new
and unexpected macro situation and the 2020s will be no different. Rules of
thumb don’t hold up over time.
So don’t tell me, “When you
look at history, it’s clear that X will happen.”
Sorry, but there’s only one
reliable rule of thumb in macro:
Things change.
PS. I am reluctant to
hazard a guess as to what will make the 2020s special; perhaps it will
violate the rule of thumb that says, “American expansions never last more
than 10 years.”
PPS. I have a post on the
Steve Moore nomination at
Econlog.
PPPS. But don’t read the
Steve Moore post, read
this one.
Jensen Comment
It is so typical that accountics researchers devoted to multiple regression
ignore non-stationarities where things change.
From Two Former Presidents of the AAA
"Some Methodological Deficiencies in Empirical Research Articles in
Accounting." by Thomas R. Dyckman and Stephen A. Zeff , Accounting
Horizons: September 2014, Vol. 28, No. 3, pp. 695-712 ---
http://aaajournals.org/doi/full/10.2308/acch-50818 (not free)
This paper uses a sample of the regression and
behavioral papers published in The Accounting Review and the Journal of
Accounting Research from September 2012 through May 2013. We argue first
that the current research results reported in empirical regression papers
fail adequately to justify the time period adopted for the study.
Second, we maintain that the statistical analyses used in these papers as
well as in the behavioral papers have produced flawed results. We further
maintain that their tests of statistical significance are not appropriate
and, more importantly, that these studies do not�and cannot�properly address
the economic significance of the work. In other words, significance tests
are not tests of the economic meaningfulness of the results. We suggest ways
to avoid some but not all of these problems. We also argue that replication
studies, which have been essentially abandoned by accounting researchers,
can contribute to our search for truth, but few will be forthcoming unless
the academic reward system is modified.
The free SSRN version of this paper is at
http://papers.ssrn.com/sol3/papers.cfm?abstract_id=2324266
This Dyckman and Zeff paper is indirectly related to the following technical
econometrics research:
"The Econometrics of Temporal Aggregation - IV - Cointegration," by
David Giles, Econometrics Blog, September 13, 2014 ---
http://davegiles.blogspot.com/2014/09/the-econometrics-of-temporal.html
**How to Mislead With Statistics
PBS Nova: How did the polls get it so wrong?
http://www.pbs.org/wgbh/nova/next/body/why-did-the-polls-get-it-wrong/
Forbes: The Science Of Error: How Polling Botched The
2016 Election ---
https://www.forbes.com/sites/startswithabang/2016/11/09/the-science-of-error-how-polling-botched-the-2016-election/#6deb3b337959
Scientific American: Where Are the Real Errors in
Political Polls?
https://blogs.scientificamerican.com/guest-blog/where-are-the-real-errors-in-political-polls/
Examples of misleading statistics and polls ---
https://www.datapine.com/blog/misleading-statistics-and-data/
NYT: Affirmative Action Is an Example of How Polls Can
Mislead
https://www.nytimes.com/2017/08/04/upshot/affirmative-action-and-why-polls-on-issues-are-often-misleading.html
Misleading Charts
---
https://qz.com/580859/the-most-misleading-charts-of-2015-fixed/
The Top 10 Ways to Get Misleading Poll Results (many times these are
intentional mistakes for political purposes) ---
http://www.charneyresearch.com/resources/the-top-10-ways-to-get-misleading-poll-results/
Fake Polls are the Real Problem ---
https://fivethirtyeight.com/features/fake-polls-are-a-real-problem/
**How to Mislead With Statistics
Bogus Straw Stats Popped Up in October 7, 2018 Shark Tank ---
http://reason.com/blog/2018/10/08/bogus-straw-stats-pop-up-in-last-nights
P-Value Nonsense
Statisticians clamor for retraction of paper by Harvard researchers they say
uses a “nonsense statistic” ---
https://retractionwatch.com/2019/06/19/statisticians-clamor-for-retraction-of-paper-by-harvard-researchers-they-say-uses-a-nonsense-statistic/#more-100498
Bob Jensen's threads on P-value nonsense
---
http://faculty.trinity.edu/rjensen/theory01.htm#WhatWentWrong
**How to Mislead With P-Values and Statistical Inference
From David Giles on March 26, 2019
The American Statistical
Association has just published a special
supplementary issue of
The American Statistician,
titled Statistical
Inference in the 21st. Century: A World Beyond p < 0.05.
This
entire issue is
open-access.
In addition to an excellent editorial, Moving
to a World Beyond "p < 0.05" (by Ronald Wasserstein, Allen Schirm,
and Nicole Lazar) it comprises 43 articles with such titles as:
·
The p-Value Requires
Context, Not a Threshold (by Rebecca Betensky)
·
The False Positive Risk:
A Proposal Concerning What to do About p-Values (by David
Colquhoun)
·
What Have we (Not)
Learnt From Millions of Scientific Papers With P Values? (by John
Ioannidis)
·
Three Recommendations for Improving the Use of
p-Values (by Daniel Benjamin and James Berger)
I'm sure
that you get the idea of what this supplementary issue is largely about.
But look
back at its title - Statistical
Inference in the 21st. Century: A World Beyond p < 0.05. It's not
simply full of criticisms. There's a heap of excellent, positive, and
constructive material in there.
Highly
recommended reading!
How Many Ways Can You Misinterpret p-Values, Confidence Intervals,
Statistical Tests, and Power? 25
https://replicationnetwork.com/2019/02/09/how-many-ways-can-you-misinterpret-p-values-confidence-intervals-statistical-tests-and-power-25/
Time to say goodbye to “statistically significant” and embrace
uncertainty, say statisticians ---
https://retractionwatch.com/2019/03/21/time-to-say-goodbye-to-statistically-significant-and-embrace-uncertainty-say-statisticians/
Three years ago, the American Statistical Association (ASA) expressed hope
that the world would move to a “post-p-value
era.”
The statement in which they made that recommendation has been cited more
than 1,700 times, and apparently, the organization has decided that era’s
time has come. (At least one journal had already
banned p values by 2016.)
In an
editorial
in a
special issue
of The American Statistician out today, “Statistical Inference in the 21st
Century: A World Beyond P<0.05,” the executive director of the ASA, Ron
Wasserstein, along with two co-authors, recommends that when it comes to the
term “statistically significant,” “don’t say it and don’t use it.” (More
than 800 researchers signed onto a
piece published in Nature yesterday
calling for the same thing.) We asked Wasserstein’s co-author,
Nicole Lazar of the University of Georgia,
to answer a few questions about the move.
So the ASA wants to say goodbye to “statistically significant.” Why, and why
now?
In the past few years there has been a growing recognition in the scientific
and statistical communities that the standard ways of performing inference
are not serving us well. This manifests itself in, for instance, the
perceived crisis in science (of reproducibility, of credibility); increased
publicity surrounding bad practices such as p-hacking (manipulating the data
until statistical significance can be achieved); and perverse incentives
especially in the academy that encourage “sexy” headline-grabbing results
that may not have much substance in the long run. None of this is
necessarily new, and indeed there are conversations in the statistics (and
other) literature going back decades calling to abandon the language of
statistical significance. The tone now is different, perhaps because of the
more pervasive sense that what we’ve always done isn’t working, and so the
time seemed opportune to renew the call.
Much of the editorial is an impassioned plea to embrace uncertainty. Can you
explain?
The world is inherently an uncertain place. Our models of how it works —
whether formal or informal, explicit or implicit — are often only crude
approximations of reality. Likewise, our data about the world are subject to
both random and systematic errors, even when collected with great care. So,
our estimates are often highly uncertain; indeed, the p-value itself is
uncertain. The bright-line thinking that is emblematic of declaring some
results “statistically significant” (p<0.05) and others “not statistically
significant” (p>0.05) obscures that uncertainty, and leads us to believe
that our findings are on more solid ground than they actually are. We think
that the time has come to fully acknowledge these facts and to adjust our
statistical thinking accordingly.
Continued in article
Bob Jensen's threads on the decline of p-values from favor in statistical
analysis ---
http://faculty.trinity.edu/rjensen/theory01.htm#WhatWentWrong
To p-Value or Not to p-Value? An Answer From Signal Detection Theory ---
https://open.lnu.se/index.php/metapsychology/article/view/871
“In
statistics, Type I errors (false alarms) and Type II errors (misses) are
sometimes considered separately, with Type I errors being a function of
the alpha level and Type II errors being a function of power. An
advantage of signal detection theory is that it combines Type I and Type
II errors into a single analysis of discriminability…”
“…p values
were effective, though not perfect, at discriminating between real and
null effects.”
“Bayes factor
incurs no advantage over p values at detecting a real effect versus a
null effect … This is because Bayes factors are redundant with p values
for a given sample size.”
“When power
is high, researchers using p values to determine statistical
significance should use a lower criterion.”
“… a change
to be more conservative will decrease false alarm rates at the expense
of increasing miss rates. False alarm rates should not be considered in
isolation without also considering miss rates. Rather, researchers
should consider the relative importance for each in deciding the
criterion to adopt.”
“…given that
true null results can be theoretically interesting and practically
important, a conservative criterion can produce critically misleading
interpretations by labeling real effects as if they were null effects.”
“Moving
forward, the recommendation is to acknowledge the relationship between
false alarms and misses, rather than implement standards based solely on
false alarm rates.”
Continued in article
February 6, 2019 Message from Tom Dyckman (now retired from Cornell
University)
Bob:
Here is a new paper you might want to alert your readers too along with
Dave's blog today.
Greenland, S., S. J. Senn, K. R. Rothman, J. B.
Carlin, C. Poole, S. N. Goodman, & D. G. Altman,
2016. Statistical tests, p values, confidence intervals, and power: A guide
to misinterpretations. European Journal of Epidemiology, 31,
337-350.
https://fermatslibrary.com/s/statistical-tests-p-values-confidence-intervals-and-power-a-guide-to-misinterpretations
Abstract
Misinterpretation and abuse of statistical tests, confidence intervals,
and statistical power have been decried for decades, yet remain rampant.
A key problem is that there are no interpretations of these concepts
that are at once simple, intuitive, correct, and foolproof. Instead,
correct use and interpretation of these statistics requires an attention
to detail which seems to tax the patience of working scientists. This
high cognitive demand has led to an epidemic of shortcut definitions and
interpretations that are simply wrong, sometimes disastrously so—and yet
these misinterpretations dominate much of the scientific literature. In
light of this problem, we provide definitions and a discussion of basic
statistics that are more general and critical than typically found in
traditional introductory expositions. Our goal is to provide a resource
for instructors, researchers, and consumers of statistics whose
knowledge of statistical theory and technique may be limited but who
wish to avoid and spot misinterpretations. We emphasize how violation of
often unstated analysis protocols (such as selecting analyses for
presentation based
on the
P values
they produce) can lead to small P values even if the declared test
hypothesis is correct, and can lead to large P values even if that
hypothesis is incorrect. We then provide an explanatory list of 25
misinterpretations of P values, confidence intervals, and power. We
conclude with guidelines for improving statistical interpretation and
reporting.
Continued in article
**How to Mislead With Statistics
How
to Mislead With P-Values
When You’re Selecting Significant Findings, You’re Selecting Inflated
Estimates ---
https://replicationnetwork.com/2019/02/16/goodman-when-youre-selecting-significant-findings-youre-selecting-inflated-estimates/
How Many Ways Can You Misinterpret p-Values, Confidence Intervals,
Statistical Tests, and Power? 25
https://replicationnetwork.com/2019/02/09/how-many-ways-can-you-misinterpret-p-values-confidence-intervals-statistical-tests-and-power-25/
Jensen Comment
The sad thing is that journal editors of leading accounting research journals
seem to not care --- they're addicted to P-values
Bob Jensen's
threads on the recent p-value saga ---
http://faculty.trinity.edu/rjensen/theory01.htm#WhatWentWrong
David Johnstone from Australia gave me permission to broadcast his reply to
the AECM
Dear Sudipta and Bob, thanks for
sending this Sudipta, it was actually written up in the local newspaper
(Sydney Morning Herald) the other day. There has also been a series of
articles on economic modelling that starts with the conclusion and works
back to the argument. People are waking up to rorts slowly but inevitably,
it seems.
There are multi-million dollar
industries (e.g. “accounting research”) that depend on p-levels and would
need a big clean out and recanting/retraining if the tide were to turn. I
think that the funding bodies (e.g. taxpayers) are starting to smell rats,
so life is going to be different for younger researchers in 10 years I
suspect. Much more scepticism about supposed “research”.
I have been toying with writing a book
on the P-level problem. I used to be excited about this stuff, I thought it
was deeply interesting and other people would also find it interesting. I
didn’t realize that most researchers are not intrinsically interested in the
techniques they use, and I also didn’t realize that most will resist
bitterly anything that makes their lives less glamorous and their self-image
less wonderful. This is what I see as the “positive theory of accounting
researchers”.
Great to have a couple of old
fashioned academics to talk to on this.
By the way, all the young
statisticians schooled in Bayesian theory know about the issues with
P-levels, and they are breeding up in computer science and elsewhere.
Tom Dyckman’s paper on P-levels is
coming out in Abacus 2nd issue 2016. In that same issue is an excellent
survey paper by Jeremy Bertomeu on cost of capital etc, which will give that
issue further credibility and hopefully prompt some extra readers to see
Tom’s paper.
David Johnstone
Jensen Comment
Note that the following article has enormous implications for what is taught in
most Ph.D. programs in the social sciences, business, accounting, finance, and
other academic disciplines. Regression analysis has become the key to the
kingdom of academic research, a Ph.D. diploma, journal article publication,
tenure, and performance rewards in the Academy. Now the sky is falling, and soon
researchers skilled mostly at performing regression analysis are faced with the
problem of having to learn how to do real research.
Regression Analysis ---
https://en.wikipedia.org/wiki/Regression_analysis
Richard Nisbett ---
https://en.wikipedia.org/wiki/Richard_E._Nisbett
"The Crusade Against Multiple Regression Analysis A Conversation With Richard
Nisbett," Edge, January 21, 2016 ---
http://edge.org/conversation/richard_nisbett-the-crusade-against-multiple-regression-analysis
A huge range of science projects are done
with multiple regression analysis. The results are often somewhere between
meaningless and quite damaging. ...
I hope that in the future, if I’m successful in
communicating with people about this, that there’ll be a kind of upfront
warning in New York Times articles: These data are based on multiple
regression analysis. This would be a sign that you probably shouldn’t read
the article because you’re quite likely to get non-information or
misinformation. RICHARD NISBETT is a professor of psychology and co-director
of the Culture and Cognition Program at the University of Michigan. He is
the author of Mindware: Tools for Smart Thinking; and The Geography of
Thought.
Richard Nisbett's Edge Bio Page.
THE CRUSADE AGAINST MULTIPLE REGRESSION ANALYSIS
The thing I’m most interested in right now has become a kind of crusade
against correlational statistical analysis—in particular, what’s called
multiple regression analysis. Say you want to find out whether taking
Vitamin E is associated with lower prostate cancer risk. You look at the
correlational evidence and indeed it turns out that men who take Vitamin E
have lower risk for prostate cancer. Then someone says, "Well, let’s see if
we do the actual experiment, what happens." And what happens when you do the
experiment is that Vitamin E contributes to the likelihood of prostate
cancer. How could there be differences? These happen a lot. The
correlational—the observational—evidence tells you one thing, the
experimental evidence tells you something completely different.
The thing I’m most interested in right now has
become a kind of crusade against correlational statistical analysis—in
particular, what’s called multiple regression analysis. Say you want to find
out whether taking Vitamin E is associated with lower prostate cancer risk.
You look at the correlational evidence and indeed it turns out that men who
take Vitamin E have lower risk for prostate cancer. Then someone says,
"Well, let’s see if we do the actual experiment, what happens." And what
happens when you do the experiment is that Vitamin E contributes to the
likelihood of prostate cancer. How could there be differences? These happen
a lot. The correlational—the observational—evidence tells you one thing, the
experimental evidence tells you something completely different.
In the case of health data, the big problem is
something that’s come to be called the healthy user bias, because the guy
who’s taking Vitamin E is also doing everything else right. A doctor or an
article has told him to take Vitamin E, so he does that, but he’s also the
guy who’s watching his weight and his cholesterol, gets plenty of exercise,
drinks alcohol in moderation, doesn’t smoke, has a high level of education,
and a high income. All of these things are likely to make you live longer,
to make you less subject to morbidity and mortality risks of all kinds. You
pull one thing out of that correlate and it’s going to look like Vitamin E
is terrific because it’s dragging all these other good things along with it.
This is not, by any means, limited to health
issues. A while back, I read a government report in The New York Times on
the safety of automobiles. The measure that they used was the deaths per
million drivers of each of these autos. It turns out that, for example,
there are enormously more deaths per million drivers who drive Ford F150
pickups than for people who drive Volvo station wagons. Most people’s
reaction, and certainly my initial reaction to it was, "Well, it sort of
figures—everybody knows that Volvos are safe."
Continued in article
Drawing Inferences From Very Large Data-Sets
David Johnstone wrote the following:
Indeed if you hold H0 the same and keep
changing the model, you will eventually (generally soon) get a significant
result, allowing "rejection of H0 at 5%", not because H0 is
necessarily false but because you have built upon a false model (of which
there are zillions, obviously).
"Drawing Inferences From Very Large Data-Sets," by David Giles, Econometrics
Beat: Dave Giles� Blog, University of Victoria, April 26, 2013 ---
http://davegiles.blogspot.ca/2011/04/drawing-inferences-from-very-large-data.html
. . .
Granger (1998;
2003 ) has
reminded us that if the sample size is sufficiently large, then it's
virtually impossible not to reject almost any hypothesis.
So, if the sample is very large and the p-values associated with
the estimated coefficients in a regression model are of the order of, say,
0.10 or even 0.05, then this really bad news. Much,
much, smaller p-values are needed before we get all excited about
'statistically significant' results when the sample size is in the
thousands, or even bigger. So, the p-values reported above are
mostly pretty marginal, as far as significance is concerned. When you work
out the p-values for the other 6 models I mentioned, they range
from to 0.005 to 0.460. I've been generous in the models I selected.
) has
reminded us that if the sample size is sufficiently large, then it's
virtually impossible not to reject almost any hypothesis.
So, if the sample is very large and the p-values associated with
the estimated coefficients in a regression model are of the order of, say,
0.10 or even 0.05, then this really bad news. Much,
much, smaller p-values are needed before we get all excited about
'statistically significant' results when the sample size is in the
thousands, or even bigger. So, the p-values reported above are
mostly pretty marginal, as far as significance is concerned. When you work
out the p-values for the other 6 models I mentioned, they range
from to 0.005 to 0.460. I've been generous in the models I selected.
Here's another set of results taken from a second, really nice, paper by
Ciecieriski et al. (2011) in the same issue of
Health Economics:
Continued in article
Jensen Comment
My research suggest that over 90% of the recent papers published in The
Accounting Review use purchased databases that provide enormous sample sizes
in those papers. Their accountics science authors keep reporting those
meaningless levels of statistical significance.
What is even worse is when meaningless statistical significance tests are
used to support decisions.
"Statistical Significance - Again " by David Giles, Econometrics
Beat: Dave Giles� Blog, University of Victoria, December 28, 2013 ---
http://davegiles.blogspot.com/2013/12/statistical-significance-again.html
Statistical Significance -
Again
With all of this
emphasis on "Big Data", I was pleased to see
this post on the Big Data
Econometrics blog, today.
When you have a sample that
runs to the thousands (billions?), the conventional significance
levels of 10%, 5%, 1% are completely inappropriate. You need to
be thinking in terms of tiny significance levels.
I discussed this in
some detail back in April of 2011, in a post titled, "Drawing
Inferences From Very Large Data-Sets".
If you're of those (many) applied
researchers who uses large cross-sections of data, and then
sprinkles the results tables with asterisks to signal
"significance" at the 5%, 10% levels, etc., then I urge
you read that earlier post.
It's sad to encounter so many
papers and seminar presentations in which the results, in
reality, are totally insignificant!
How Standard Error Costs Us Jobs,
Justice, and Lives, by Stephen T. Ziliak and Deirdre N. McCloskey (Ann
Arbor: University of Michigan Press, ISBN-13: 978-472-05007-9, 2007)
http://www.cs.trinity.edu/~rjensen/temp/DeirdreMcCloskey/StatisticalSignificance01.htm
Page 206
Like scientists today in medical and economic and
other sizeless sciences, Pearson mistook a large sample size for the definite,
substantive significance---evidence s Hayek put it, of "wholes." But it was as
Hayek said "just an illusion." Pearson's columns of sparkling asterisks, though
quantitative in appearance and as appealing a is the simple truth of the sky,
signified nothing.
pp. 250-251
The textbooks are wrong. The teaching is wrong. The
seminar you just attended is wrong. The most prestigious journal in your
scientific field is wrong.
You are searching, we know, for ways to avoid
being wrong. Science, as Jeffreys said, is mainly a series of approximations to
discovering the sources of error. Science is a systematic way of reducing wrongs
or can be. Perhaps you feel frustrated by the random epistemology of the
mainstream and don't know what to do. Perhaps you've been sedated by
significance and lulled into silence. Perhaps you sense that the power of a
Roghamsted test against a plausible Dublin alternative is statistically speaking
low but you feel oppressed by the instrumental variable one should dare not to
wield. Perhaps you feel frazzled by what Morris Altman (2004) called the "social
psychology rhetoric of fear," the deeply embedded path dependency that keeps the
abuse of significance in circulation. You want to come out of it. But perhaps
you are cowed by the prestige of Fisherian dogma. Or, worse thought, perhaps
you are cynically willing to be corrupted if it will keep a nice job
Bob Jensen's threads on the often way analysts, particularly accountics
scientists, often cheer for statistical significance of large sample outcomes
that praise statistical significance of insignificant results such as R2
values of .0001 ---
The Cult of Statistical Significance: How Standard Error Costs Us Jobs, Justice,
and Lives ---
http://www.cs.trinity.edu/~rjensen/temp/DeirdreMcCloskey/StatisticalSignificance01.htm
Those of you interested in tracking The Accounting Review's trends in
submissions, refereeing, and acceptances'rejections should be interested in
current senior editor Mark L.
DeFond's annual report at
http://aaajournals.org/doi/full/10.2308/accr-10477
This has become a huge process involving 18 editors and hundreds of referees.
TAR is still the leading accountics science journal of the American Accounting
Association. However, there are so many new specialty journals readers are apt
to find quality research in other AAA journals. TAR seemingly still does not
publish commentaries and articles without equations and has not yet caught on
the intitiatives of the Pathways Commission for more diversification in
research in the leading AAA research journal. Virtually all TAR editors still
worship p-values in empirical submissions.
"Not Even Scientists Can Easily Explain P-values," by Christie
Aschwanden, Nate Silver's 5:38 Blog, November 30, 2015 ---
http://fivethirtyeight.com/features/not-even-scientists-can-easily-explain-p-values/
P-values have taken quite a beating lately. These
widely used and commonly misapplied statistics have been blamed for giving a
veneer of legitimacy to dodgy study results,
encouraging
bad research practices
and promoting
false-positive study results.
But after writing about p-values again and again,
and recently issuing a correction on a
nearly year-old story over some erroneous
information regarding a study’s p-value (which I’d taken from the scientists
themselves and
their report), I’ve
come to think that the most fundamental problem with p-values is that no one
can really say what they are.
Last week, I attended the inaugural
METRICS conference at Stanford, which brought
together some of the world’s leading experts on meta-science, or the study
of studies. I figured that if anyone could explain p-values in plain
English, these folks could. I was wrong.
Continued in article
Jensen Comment
Why all the fuss? Accountics scientists have a perfectly logical explanation.
P-values are numbers that are pumped out of statistical analysis software
(mostly multiple regression software) that accounting research journal editors
think indicate the degree of causality or at least suggest the degree of
causality to readers. But the joke is on the editors, because there aren't any
readers.
November 30, 2015 reply from David Johnstone
Dear
Bob, thankyou for this interesting stuff.
A big
part of the acceptance of P-values is that they easily give the look of
something having been found. So it’s an agency problem, where the
researchers do what makes their research outcomes easier and better looking.
There
is a lot more to it of course. I note with young staff that they face enough
hurdles in the need to get papers written and published without thinking
that the very techniques that they are trying to emulate might be flawed.
Rightfully, they say, “it’s not my job to question everything that I have
been shown and to get nowhere as a result”, nor can most believe that
something so established and revered can be wrong, that is just too
unthinkable and depressing. So the bandwagon goes on, and, as Bob says, no
one cares outside as no one much reads it.
I do
however get annoyed every time I hear decision makers carry on about
“evidence based” policy, as if no one can have a clue or form a vision or
strategy without first having the backing of some junk science by a
sociologist or educationist or accounting researcher who was just twisting
the world whichever way to get significant p-values and a good “story”. This
kind of cargo-culting, which is everywhere, does great harm to good or
sincere science, as it makes it hard for an outsider to tell the difference.
One
thing that does not get much of a hearing is that the statisticians
themselves must take a lot of blame. They had the chance to vote off P
values decades ago when they had to choose between frequentist and Bayesian
logic. They split into two camps with the frequentists in the great majority
but holding the weakest ground intellectually. The numbers are moving now,
as people that were not born when de Finetti, Savage, Lindley, Kadane and
others first said that p-values were ill-conceived logically. Accounting, of
course, being largely ignorant of there being any issue, and ultimately just
political, will not be leading the battle of ideas.
January 28, 2016 reply from Paul Williams
Bob,
Thank you for this. In accounting the problem is
even worse because at least in other fields it is plausible that one can
have "scientific" concepts and categories. Archival research in accounting
can only deal with interpretive concepts and the "scientific" categories are
often constructed for the one study in question. We make a lot of s... up so
that the results are consistent with the narrative (always a neoclassical
economic one) that informs the study. Measurement? Doesn't exist. How can
one seriously believe they are engaged in scientific research when their
"measurements" are the result of GAAP? Abe Briloff described our most
prestigious research (which Greg Waymire claimed in his AAA presidential
white paper "...threatens the discipline with extinction."). as simply "low
level financial statement analysis." Any research activity that is reduced
to a template (in JAE the table numbers are nearly the same from paper to
paper) you know you are in trouble. What is the scientific value of 50
control variables, two focus independent variables (correlated with the
controls), and one dependent variable that is always different from study to
study? This one variable at a time approach can go on into infinity with the
only result being a huge pile of anecdotes that no one can organize into any
coherent explanation of what is going on. As you have so eloquently and
relentlessly pointed out accountants never replicate anything. In archival
research it is not even possible to replicate since the researcher is unable
to provide (like any good scientist in physics, chemistry, biology, etc.) a
log book providing the detailed recipe it would take to actually replicate
what the researcher has done. Without the ability to independently replicate
the exact study, the status of that study is merely an anecdote. Given the
Hunton affair, perhaps we should not be so sanguine about trusting our
colleagues. This is particularly so since the leading U.S. journals have a
clear ideological bias -- if your results aren't consistent with the
received wisdom they won't be published.
Paul
Bob Jensen's threads on statistical mistakes ---
http://www.cs.trinity.edu/rjensen/temp/AccounticsScienceStatisticalMistakes.htm
How Accountics Scientists Should Change:
"Frankly, Scarlett, after I get a hit for my resume in The Accounting Review
I just don't give a damn"
http://www.cs.trinity.edu/~rjensen/temp/AccounticsDamn.htm
One more mission in what's left of my life will be to try to change this
http://www.cs.trinity.edu/~rjensen/temp/AccounticsDamn.htm
"A Scrapbook on What’s Wrong with the Past, Present a nd Future of
Accountics Science," by Bob Jensen, Working Paper 450.06, Date Fluid ---
http://www.cs.trinity.edu/~rjensen/temp/AccounticsWorkingPaper450.06.pdf
The purpose of this paper is to make a case that
the accountics science monopoly of our doctoral programs and publish ed
research is seriously flawed, especially its lack of concern about
replication and focus on simplified arti ficial worlds that differ too much
from reality to creatively discover findings of greater relevance to
teachers of accounting and practitioners of accounting. Accountics
scientists themselves became a Cargo Cult.
Gaming for Tenure as an Accounting Professor ---
http://faculty.trinity.edu/rjensen/TheoryTenure.htm
(with a reply about tenure publication point systems from Linda Kidwell)
**How to Mislead With Statistics and Visualization
The Economist is one of the moat respected magazines in economics:
Here it owns up to some of its mistakes in data
visualization ---
https://medium.economist.com/mistakes-weve-drawn-a-few-8cdd8a42d368
Jensen Comment
Owning up to mistakes is what sometimes make scholars legendary and journals
ever more respected
Mistake: Truncating the scale
Mistake: Choosing the wrong visualisation method
Mistake: Taking the “mind-stretch” a little too far
Mistake: Confusing use of colour
Mistake: Including too much detail
Mistake: Lots of data, not enough space
Bob Jensen's threads on Data Visualization ---
http://faculty.trinity.edu/rjensen/352wpvisual/000datavisualization.htm
**How to Mislead With Statistics
Timing is Everything: Evidence from College Major Decisions ---
http://www.econweb.umd.edu/~pope/westpointtiming.pdf
Jensen Comment
Based on my own anecdotal experience across 40 years of being on the faculty of
four universities I'm suspicious about the conclusions of this study on
causality.
Personally, I think that student choices of major in many, certainly not all,
instances is primarily impacted by parents and/or other relatives for very close
family friends. This is not necessarily the case at the start of the first
semester in college where students still tend to leave their options only. But I
think deep in the backs of their minds the wishes of parents and family friends
come to surface.
I admit to being wrong in many instances and this article often rings true.
Our minister has ten very loving and tightly-knit children. What emerged is a
loved leader among the children named Lauren. She graduated from high school
(all were home schooled) and entered nursing school. She's now a popular cardiac
nurse in the Eastern Main Medical Center in Bangor. Lauren influenced her
younger brother Landon's decision to attend the same nursing school. I'm sure he
was partly influenced by all the job opportunities that opened up to his older
sister. But along the way in college Landon was greatly influenced by a required
course in psychology. Landon changed majors and is now a psychology major bent
on becoming a clinical psychologist. Job opportunities are much more limited
(competitively) as a new graduate in psychology. Go figure!
The accounting profession was greatly worried as virtually all the 50 states
commenced requiring 150 credits to sit for the CPA examination, which for most
aspiring CPAs is tantamount to requiring a masters degree. What would this alone
do to the number of undergraduate accounting majors? We'll never know. The
reason is that at the same time CPA firms and business firms offset this new
academic requirement with greatly expanded undergraduate internship programs. It
turns out in accounting and other academic majors it really helps to have
internships available to most students in a discipline and, get this,
internships that lead to job offers before students even enter their masters
programs (with the job offers being contingent upon getting the masters
degrees).
My point student decisions regarding majors are
probably too variable, complicated, and serendipitous to neatly summarize.
Certainly ranking key factors is extremely misleading.
There are too many interacting variables.
Roundup ---
https://en.wikipedia.org/wiki/Roundup_(herbicide)
Questions
Who pays for multimillion settlements regarding the cancer scare of Roundup
weed killer?
https://www.consumersafetywatch.com/non-hodgkin-lymphoma-roundup/?adwords&gclid=EAIaIQobChMInpnk3vap4QIVgV6GCh3_XgRsEAAYAiAAEgKnF_D_BwE
Jensen Comment
It's a bit like cigarette manufacturer settlements when customers in the future
pay for past settlements. And since farmers and homeowners around the world will
continue to use this product or its equivalent Roundup's legal settlements will
be paid by future customers.
However, there's a huge difference relative to cigarette consumers. Farmers around the world say they will
still spray Roundup or its equivalent on growing crops ---
https://www.wsj.com/articles/despite-rulings-farmers-remain-loyal-to-roundup-11553175429
This means that virtually all consumers (from meat eaters to bread lovers to
vegetarians) will pay for the legal settlements regarding Roundup.
Big companies do not pay for legal settlements as long as they continue in
business. Their customers pay for those settlements. Exhibit A is how asbestos
settlement dollars are factored into the prices paid by customers for insulation
today.
How long will the Roundup lawsuits keep piling up?
The lawsuits will be slowed down when appeals courts greatly scale back the
damage awards. And lawsuits "might" eventually cease as publicity and product labels
make users of Roundup more responsible for knowingly taking on risks. The link
between Roundup and food consumers, to my knowledge, has never been
scientifically proven. Much awaits more scientific
study on this matter of food risks from Roundup use.
Suppose a link between Roundup and bread or hamburger eventually is proven.
This alone does will not necessarily put an end to Roundup or its equivalent.
I've pointed out previously that use of Roundup will then become a bit like the
Trolley Problem in philosophy ---
https://en.wikipedia.org/wiki/Trolley_problem
The fact of the matter is that until safer herbicides become as effective as
Roundup people around the world will surely pay much more for food and many
people will starve due to lower crop yields providing food without Roundup use.
**How to Mislead With Statistics
These are the 29 countries with the highest taxes on profits for corporations
(supposedly from PwC) ---
https://www.businessinsider.com/these-are-the-29-countries-with-the-highest-taxes-for-corporations-2019-3
Firstly, the outcomes reported in this study do not jive
with other studies looking only at profits taxes. Take Sweden for example. The
above article says the corporate rate for Sweden is 49.1%. Other studies put
that rate at 22% and headed for 21.4% ---
https://www.businessinsider.com/these-are-the-29-countries-with-the-highest-taxes-for-corporations-2019-3#13-sweden-491-17
Even PwC puts the tax rate at 21.4% ---
http://taxsummaries.pwc.com/ID/Sweden-Corporate-Taxes-on-corporate-income
The reason for the difference between 49.1% and 21.4% is
that the Business Insider (World Bank) ranking adds "social contribution" to the
corporate income tax rates. But it is not clear just what constitutes social
contribution and how consistent the "social contribution" add on for each
nation. I think that the definition of "social contribution" is dubious.
Obviously the VAT tax plays a huge role in all of this. But nations vary greatly
in terms of VAT tax relief to companies.
Comparing tax rates between nations is a lot like
comparing poverty between nations. The definitions of "tax" and "poverty" are
different for each nation. I suspect the definition of "social contribution"
also suffers from the same ambiguities.
Also there's a huge problem for multinational companies
since they pay multiple income tax rates, VAT rates, and multiple social
contributions over the nations in which they do business.
You can learn more about the PwC study by going to the PwC
site at
https://www.pwc.com/gx/en/services/tax/publications/paying-taxes-2019/overall-ranking-and-data-tables.html
Also see
https://www.pwc.com/gx/en/services/tax/publications/paying-taxes-2019.html
You can download the report at the above site.
Obviously the VAT tax plays a huge role in all of this.
But nations vary greatly in terms of VAT tax relief and income tax relief to
companies.
In fairness, the full PwC report delves much more into the
difficulties of making tax comparisons between nations. This is not a garbage
study. But some of the summaries like the Business Insider rankings are garbage
aggregations that gloss over difficulties in making rankings and comparisons.
For example, consider Argentina that according the
Business Insider ranking claims Argentina corporations pay profit and social
contribution rates totaling 106%. Obviously, it would
be foolhardy to invest in corporate equity in Argentina unless there was some
way to get a return on investment.
The same problem arises when trying to compare personal
tax rates between nations such as comparing what people pay in taxes in Sweden
versus the USA. One of the big added problems here is failing to compare the
differences in what taxpayers get in return for their taxes. For example, do
those taxes cover basic health care, long-term health care, housing subsidies,
energy subsidies, education for some, education for all, etc.
My point is that sometimes comparing nations by statistics
and charts is worse than having no information --- it's terribly misleading
information.
Students at Rice University are petitioning to prevent Vice President Mike
Pence from speaking at a campus event, citing his "violent intolerance of LGBTQ+
identities."
https://docs.google.com/forms/d/e/1FAIpQLSdGK2ZypQmJsVhvrN9D4JzdBNUN-xJoHmfRqy34cNBMA-ZlYA/viewform?fbzx=-7748057991678917981&fbclid=IwAR3_HuIcbJ8blHXLvE22M-ZAezpJX1caf_75crDbQ6tWAAxEO6SU9S0UkXY&cid=db
Jensen Comment
Mike Pence is a heart beat away from becoming the President of the USA. Rice
students would rather remain ignorant about his domestic and foreign policies
than to let one issue draw a curtain around their learning more about this
leader.
Don't they realize that they could more rigorously campaign against the
re-election of Mike Pence if they learned a few things more about him and his
policies.
Would Rice University students have done the
same thing years ago if Albert Einstein was intolerant of LGBTQ identities?
Political Correctness in Universities Never Quits
I think political
correctness can lead to some kind of paralysis where you don't address reality.
Juan William before he was fired after a distinguished career on NPR.
http://townhall.com/columnists/GuyBenson/2010/10/21/npr_finally_finds_an_excuse_to_fire_juan_williams
The Washington Post:
Conservatives say campus speech is under threat.
That’s been true for most of history ---
https://www.washingtonpost.com/outlook/conservatives-say-campus-speech-is-under-threat-thats-been-true-for-most-of-history/2017/08/11/6aa959fa-7c4b-11e7-9d08-b79f191668ed_story.html?utm_term=.a02b7a26615d
Beloit College: The incident (a pro-capitalism speaker) was
the latest in a string of free expression occurrences on college campuses where
students have intentionally drowned out speakers whose views they find
distasteful ---
Click Here
Capitalism is such a dangerous topic that mention of it should be banned in all
colleges and universities
Black Pro-Life Speaker Disinvited From Cornell ---
https://townhall.com/tipsheet/briannaheldt/2019/03/27/black-prolife-speaker-disinvited-from-cornell-n2543853?utm_source=thdaily&utm_medium=email&utm_campaign=nl&newsletterad=03/28/2019&bcid=b16c6f948f297f77432f990d4411617f&recip=17935167
Jensen Comment
I've repeatedly proclaimed that I'm an economics conservative who favors
progressiveness in abortion rights (including late-term abortions) and gay
rights. And I'm utterly against political correctness in the media and on
campus.
My threads on political correctness ---
http://faculty.trinity.edu/rjensen/HigherEdControversies2.htm#PoliticalCorrectness
When Grading Less Is More
https://www.insidehighered.com/news/2019/04/02/professors-reflections-their-experiences-ungrading-spark-renewed-interest-student?utm_source=Inside+Higher+Ed&utm_campaign=aed948ff1a-DNU_2019_COPY_01&utm_medium=email&utm_term=0_1fcbc04421-aed948ff1a-197565045&mc_cid=aed948ff1a&mc_eid=1e78f7c952
When it comes to grading, less is more. So say a number of scholars who have
shared their recent experiments with “ungrading” in blog posts and on other
social media, sparking renewed discussions about the practice.
“My core hypothesis was
that student learning would actually be improved by eliminating instructor
grading from the course,” Marcus Schultz-Bergin, assistant lecturer
of philosophy at Cleveland State University, wrote
of going gradeless this
semester in a personal blog post that has since been shared on the popular
philosophy site Daily Nous.
“My
hope” for students, Schultz-Bergin continued, “is that the reflection they
engaged in, and the discussions we had, will lead to a significant
commitment in the second half of the course to really achieve what they set
out for themselves so that when they tell me they earned an A they can
really mean it.”
Thus far, he added, the experiment in his undergraduate philosophy of law
course "has had its ups and downs. There are definitely some things I will
change going forward, but I do think the gradeless approach can work well in
a course like this.”
Experts in ungrading say it’s still relatively rare in higher education, due
in part to inertia with respect to pedagogical innovation, the culture of
assessment and professors’ anxieties about going gradeless. How will
students respond? What will colleagues say? What will administrators think?
Continued in article
Jensen Comment
I would've loved my 40 years of teaching more if I never had to assign grades
(other than maybe Pass/Fail).
But I would've felt that in assigning only a P or an F I was less
professional. Grading is important at most any level of education. Personally, I
worked harder to learn from the fifth grade onward in courses where teachers
were harder graders. Part of it was probably my competitive nature. But mostly I
wanted to bring home report cards to make my parents proud of me when they
signed each report card.
I don't think I would've liked having to write a letter of performance for
each student who never took an exam. Sure I could write about innovative ideas
students had in essays, but it's very hard to compare innovative ideas for each
and every student since innovative ideas are often impractical with unachievable
goals.
My own experience in as a teacher in college is that competitive grades were
the main motivating factor for my better students and often even my struggling
students who dug in harder to improve their grades as each semester progressed.
How many students really take a pass/fail course so they won't have to work
as hard in that course?
Grades are a way that students can demonstrate ability when they tend to do
poorly on standardized tests. You may not be doing
minority students any favors when you take away course grades that show deeper
work ethics and abilities.
Some colleges force high schools to choose the top 10% of each graduating
class such as the 10% rule for admissions for automatic admission in to
state-supported Texas universities ---
https://en.wikipedia.org/wiki/Texas_House_Bill_588
How do you select the top 10% of a high school's graduating class if there are
no course grades?
Many graduate schools (including medical schools and law schools) claim they
are looking more heavily into grades to counter poor standardized test scores
like the GRE, GMAT, MCAT, LSAT, etc. Without grades it would seem to me that
they become more reliant on standardized tests. Letters of recommendation from
former professors are either hard to get in this age of lurking lawyers and in
this age where class sizes are so huge that professors really don't get to know
all their students very well. Letters of recommendations rarely say anything
negative such that if their are 3,000 applicants to fill 400 slots in a medical
school, those letters of recommendation from Lake Wobegon are of little help in
the screening process ---
https://en.wikipedia.org/wiki/Lake_Wobegon
I'm not saying that students should not be allowed to take an occasional
Pass/Fail course, especially if it's outside their major field of study. What I
am saying is that pass/fail should not go mainstream.
Bob Jensen's treads on assessment are at
http://faculty.trinity.edu/rjensen/assess.htm
**How to Mislead With Statistics and Biased Media Reporting
(the externality of motivating the police to do less and less and less)
Here are the stories about police misconduct uncovered so far by a new
media partnership ---
https://www.latimes.com/local/lanow/la-me-police-files-roundup-20190319-story.html
Jensen Comment
It would also be nice if the media partnership also reported good conduct deeds
by law enforcement. The real problem about reporting misconduct is that "no
action" can easily go undetected. For example, in Baltimore police are now
suspected pf simply looking the other way in the presence of rising street
crimes and traffic crimes. Or the police might create long delays until a
relatively formidable armed squad can be assembled before entering dangerous
public housing complexes and domestic dispute residences.
And police departments can be simply overwhelmed (think Chicago and
Baltimore) by the number of murders and rapes such that "investigations" become
badly understaffed and underfunded.
Meanwhile minorities are the most impacted by reduced
police protections just like urban school children and their teachers are
subjected to more bullying and gang violence.
Teachers in NYC now complain that in some districts inmates have overtaken the
asylum ---
https://www.manhattan-institute.org/html/school-discipline-reform-and-disorder-evidence-nyc-schools-10103.html
**How to Mislead With "Unvetted" Forecasts/Predictions
Elon Musk ---
https://en.wikipedia.org/wiki/Elon_Musk
The Securities and Exchange Commission says an "unvetted"
tweet Elon Musk sent in February claiming that Tesla would produce 500,000
vehicles in 2019 was a "blatant violation" of a court settlement between
himself, Tesla, and the agency ---
https://www.businessinsider.com/sec-responds-to-elon-musk-in-contempt-of-court-claim-2019-3
·
The Securities and Exchange Commissionsays a tweet Elon
Musk sent in February claiming that Tesla would produce 500,000 vehicles
in 2019 was a "blatant violation" of a court settlement between himself,
Tesla, and the agency.
·
Among other things, that settlement requires Tesla to
appoint a "Twitter czar" who vets Musk's tweets for information material
to Tesla before publishing.
·
The SEC, citing Musk's own words, accuses him of not
doing that and says "there was never any good faith effort to comply
with the Court's order."
·
Musk's lawyers criticized the SEC's latest filing on
Monday, accusing the agency of making new allegations against the Tesla
CEO.
Continued in article
Jensen Comment
Musk keeps trying to manipulate Tesla's stock and bond market prices with
dubious forecasts (although in its best week Tesla did produce 7,000 vehicles
before laying off workers to reduce expenses).
It's not so much that 500,000 per year is entirely unreachable. The issue is
that Musk agreed in court to have such predictions "vetted" before making them
public.
This is no longer limited to a dispute between the SEC and Elon Musk. It's now a
contempt of court violation --- which is a much more scary violation for Musk to
face up to in court.
Ironically, no enforcement agency requires that President Trump's tweets be
vetted, although the national media seems to have taken on that job.
Trump and Musk seem to be in competition to see how
long tweeted lies will be tolerated --- by voters (in the case of
Trump) and by investors (in the case of Musk).
The SEC's mandate is to protect investors from fraud and market manipulations.
From the CFO Journal's Morning Ledger on
February 27, 2019
The latest
legal action between U.S. securities regulators and
Tesla
Inc. Chief Executive Elon Musk highlights the challenge facing regulators
and boards when it comes to reining in a wealthy chief executive whose
identity is closely tied to the value of the company he or she leads, CFO
Journal’s Tatyana Shumsky and Nina Trentmann report.
Round two.
The Securities and Exchange Commission on Monday asked a federal judge
to hold Mr. Musk in contempt of court
over
social-media messages he made last week about Tesla’s projected production
volumes. The regulator said the tweets violated the terms of a fraud
settlement he reached with the SEC in September because they weren’t
preapproved by Tesla officials. U.S. District Judge Alison Nathan on Tuesday
ordered Mr. Musk to respond
to the claims by March 11.
|
Crime and punishment.
Mr.
Musk’s personal wealth, estimated in the billions, could
cushion the impact of potential financial penalties. And
any action that curtails his
leadership responsibilities
risks hurting the value of Tesla because Mr. Musk’s identity
is closely intertwined with the company’s value, says Bonnie
Hancock, executive director of the Enterprise Risk
Management Initiative at the North Carolina State University
Poole College of Management.
Effective measures.
Mr. Musk’s settlement deal with the SEC in part required
that Tesla officials preapprove statements from him that
could affect the company’s stock price. Steven Peikin,
co-director of the SEC’s division of enforcement, said in
October that the regulator deployed one of its most
effective tools—a tailor-made directive—to prevent potential
harm to investors caused by a lack of oversight of Mr.
Musk’s communications. |
|
|
“The SEC has bent over backwards to allow
Tesla to continue to get the benefits of
Musk’s creative genius, but they have also
attempted to put in place procedures and
methodologies to prevent shareholders from
being misled by his tweets.” |
|
— Harvey Pitt, former chairman of the SEC. |
|
|
|
Consumer Reports
no longer recommends buying a Model 3 --- because it's too unreliable.
How far does the First Amendment protect the right of CEOs to manipulate market
prices (bonds and stocks) ---
ELON MUSK (think Tesla) FILES HIS DEFENSE: Says SEC seeks to violate his
First Amendment rights, and its filing 'smacks of retaliation and censorship'
---
https://www.businessinsider.com/musk-response-to-contempt-of-court-2019-3
Jensen Comment
There's a real threat to capital markets if he wins on this one. At risk is the
scaring off of investors in the markets, investors who fear market manipulation
beyond which the SEC can fight these days.
But there's a second risk --- should he be allowed to defy a court order?
I think there's huge risk in using the First Amendment to defend against
contempt of court.
**How to Mislead With Statistics
Gini Coefficient of Poverty
Jensen Comment
The Gini Coefficient is one of the most misleading statistics in economics. It
supposedly measures the gap between the rich and poor in any nation. However,
the terms "rich" and "poor" are highly relative. For example, the USA has a high
Gini Coefficient indicating a gap between the rich and poor. However, South
Sudan has very nearly the same Gini Coefficent where the poor of the USA would
be considered well off in South Sudan. Think of how rich a person would be in
the South Sudan with housing subsidies, food stamps, Medicaid, vehicles, HDTV,
and welfare.
Chile is a high Gini Coefficient nation with about the same score as Zambia,
but the poor in Chile are not nearly as desperate as the poor in Zambia. The
level of income for the poor in Chile is the highest in all of Latin and South
America ---
http://en.wikipedia.org/wiki/Miracle_of_Chile
At one point Canada and North Korea had about the same Gini Coefficient,
although the index is no longer computed for North Korea ---
http://en.wikipedia.org/wiki/List_of_countries_by_income_equality#List
"Countries With the Widest Gap Between Rich and Poor," by Alexander
E.M. Hess, Vince Calio and Thomas C. Frohlich, Business Insider, May 20,
2014 ---
http://247wallst.com/special-report/2014/05/20/countries-with-the-widest-gap-between-rich-and-poor/?utm_source=247WallStDailyNewsletter&utm_medium=email&utm_content=MAY212014A&utm_campaign=DailyNewsletter
Jensen Comment
Denmark has the lowest (best) Gini Coefficient but its public education and
health care systems are lacking and rank below those of Morocco ---
http://www.cs.trinity.edu/~rjensen/temp/SunsetHillHouse/SunsetHillHouse.htm
Other measures of inequality and poverty ---
http://web.worldbank.org/WBSITE/EXTERNAL/TOPICS/EXTPOVERTY/EXTPA/0,,contentMDK:20238991~menuPK:492138~pagePK:148956~piPK:216618~theSitePK:430367,00.html
Measuring Poverty Around the World ---
https://www.amazon.com/Measuring-Poverty-around-Anthony-Atkinson/dp/0691191220/ref=sr_1_1?crid=3U3VG9LDKEH9M&keywords=measuring+poverty+around+the+world&qid=1559895304&s=gateway&sprefix=measuring+poverty+arou%2Caps%2C118&sr=8-1/marginalrevol-20
**How to Mislead With Statistics
Research: Better-Managed Companies Pay Employees More Equally ---
https://hbr.org/2019/03/research-better-managed-companies-pay-employees-more-equally?utm_medium=email&utm_source=newsletter_monthly&utm_campaign=finance_not_activesubs&referral=00209&deliveryName=DM31879
Jensen Comment
This article is a mixed bag. It does a poor job of defining "better managed." On
the other hand, it does a good job in admitting and explaining that does
not understand reasons for the findings.
What is also misleading is that it does not explain that organizations vary a
great deal regarding pay needed for expertise. There's a huge difference between
Apple Corporation that depends upon expensive engineers in a huge R&D operation
versus Blue Cross needing a much greater proportion of lower-paid employees
processing insurance claims. It also does not account for different types of pay
structures such when pay varies a great deal within a category of employment due
to sales commissions and related pay schemes where doctors and lawyers in a firm
are paid according to the fees they generate.
As to the results of the article itself I like Reason Number 3 for explaining
the differences. Some firms that limit wages and benefits by outsourcing both
high-end and low-end employees. I worked at a university that outsourced its
cleaning services. In the case of teaching courses it also outsourced some of
the most expensive teachers such as accounting teachers and computer science
teachers. Such outsourcing leads to compression of outlier labor expenses thus
making it look (misleadingly) like there;s a smaller difference between
high-paid and low paid-workers.
I might add that outsourcing itself can be misleading.
Hiring an adjunct to teach tax accounting or PERL programming in a college is
not the same as having tenured faculty teach those courses. Tenured faculty
serve other missions of the university such as research and service that adjunct
faculty do not usually serve. Hence cheaper experts are not always better
experts in terms of all missions of the organization.
My point here is that outsourcing the highest and
lowest paid workers in an organization is not optimal for the good of society if
the only thing it does is make it look like you are reducing the gap between
highest and lowest paid employees.
**How to Mislead With Governmental Accounting
"How Much Do We Really Owe?," by John Goodman, Forbes, August 7,
2014 ---
http://www.forbes.com/sites/johngoodman/2014/08/07/how-much-do-we-really-owe/
First the good news: the official federal deficit
is only 3% of GDP – way below the 10% figure it reached only a few years
ago. Now the bad news: The real deficit is more than ten times that amount.
The U.S. government’s deficit is expected to be
$514 billion this year, according to the
Congressional
Budget Office (CBO). That’s the number you get
when you look at cash flow. It means the government will spend $514 billion
more than it takes in during the 2014 fiscal year.
But this kind of accounting ignores federal
government liabilities that will become due in future years. For example,
over the course of a year millions of people earn Social Security and
Medicare benefits as well as other government entitlement benefits that will
have to be paid in future years. When you total all that up (and subtract
expected future revenues to pay those benefits), we added $5 trillion in
debt last year according to Boston University economist
Larry Kotlikoff.
Another way to look at the problem is to consider
not just one year’s deficit, but the total amount of debt that government
has accumulated. US debt held by the public is currently $12.6 trillion, or
about 75% of the size of our economy the way the CBO measures things. But in
arriving at that number, the CBO doesn’t recognize promises to pay Social
Security checks and medical bills as real obligations.
Take a senior citizen who is expecting an interest
payment on a government bond next month and who is also expecting a Social
Security check. The way the CBO looks at the world, the interest payment on
the bond is a real obligation of the government. But the Social Security
check isn’t.
That’s a strange way of accounting and Kotlikoff
and his colleagues reject it. Instead they project the value of all the
promises we have made under Social Security and other entitlement programs –
benefits that ordinary citizens believe they have earned – and subtract
expected future revenues, given the current tax law. The difference is an
unfunded liability that is every bit as real as promises to make future
interest payments on bonds and Treasury bills.
Calculating obligations in this way, Kotlikoff
estimates that the total unfunded liability of the federal government is
$210 trillion, or about 12 times the size of our economy. Writing in The New
York Times, Kotlikoff says:
“The fiscal gap — the difference between our
government’s projected financial obligations and the present value of all
projected future tax and other receipts — is, effectively, our nation’s
credit card bill. Eliminating it, would require an immediate, permanent 59
percent increase in federal tax revenue. An immediate, permanent 38 percent
cut in federal spending would also suffice. The longer we wait, the worse
the pain. If, for example, we do nothing for 20 years, the requisite federal
tax increase would be 70 percent, or the requisite spending cut, 43
percent.”
And the tax increase, by the way, doesn’t work
unless the money is sequestered and invested. It can’t just be deposited in
the Treasury’s bank account and spent on other things.
Bob Jensen's threads on the USA's entitlements disaster ---
http://www.trinity.edu/rjensen/Entitlements.htm
Bob Jensen's threads on the sad state of governmental accounting ---
http://www.trinity.edu/rjensen/Theory02.htm#GovernmentalAccounting
**How to Mislead With Voting Laws
Colorado Will Allocate Their Electoral College Delegates Based On National
Popular Vote Winner ---
Click Here
Jensen Comment
Since Colorado only has about 1.5 % of the voters that determine the popular
vote outcome in the USA it's not clear why a candidate from either party would
even visit Colorado or invest in trying to win votes in Colorado. More
importantly voters in Colorado lose any clout in influencing candidates on
matter particular to Colorado. For example, Colorado is particularly fond on
legalization of marijuana. Suppose one of both candidates declares wanting to
step of Federal enforcement of marijuana laws. Voters in Colorado have given up
entirely on trying to influence a presidential candidate's position of marijuana
law enforcement.
In Iowa, Illinois, Nebraska, and other corn-growing states there is strong
support for increasing ethanol content of gasoline. In fact former candidate Al
Gore said his main reason for supporting ethanol legislation was to get the
Midwest vote when he was running for the presidency. If the corn-growing states
did what Colorado just did with the Electoral College, those states would have
virtually zero impact on presidential candidates supporting their wishes.
What makes matters worse is that Colorado just passed the power of electing a
president of the USA to the high-population states like California, New York,
Texas, etc.
Why do Colorado voters want to lose any influence on electing the President?
Of course it's possible that the popular vote could be divided by a only a small
number of votes such that Colorado's rubber stamp helps elect the winner. The
important thing to note, however, is that Colorado voters most likely did not
decide the winner. Colorado's rubber stamp went to the voters in California,
Texas, New York, and other highly populated states of the USA.
Farmers in the USA and Australia say they will continue to spray crops
with Roundup in spite of recent lawsuits ---
https://geneticliteracyproject.org/2019/03/25/many-farmers-endorse-glyphosate-as-safe-weed-killer-while-bayer-battles-roundup-cancer-lawsuits/
Jensen Comment
Lawsuits like the recent huge jury awards in California will probably get scaled
back significantly after appeals.
Jensen Comment
Suppose there is no herbicide that can be deemed totally risk free. Further
suppose that herbicides enormously add yield to food crops around the world.
This becomes a classic case for student debates about ethics and morality. It's
an extension of the classic Trolley Problem in philosophy ---
https://en.wikipedia.org/wiki/Trolley_problem
I might add that the cancer risk concerning Roundup is still hotly debated in
science.
The debate becomes even more interesting if the competition becomes between
nations. The USA is a land of lawyers where too many large lawsuits can end use
of a product. But in many (most?) other nations lawyers have much less societal
power. It may well boil down to a world in which USA farm productivity is
greatly curtailed relative to farm productivity in the rest of the world.
**How to Mislead
With Statistics
Epic miscalls
and landslides unforeseen: The exceptional catalog of polling failure ---
https://theconversation.com/epic-miscalls-and-landslides-unforeseen-the-exceptional-catalog-of-polling-failure-146959
**How to Mislead With Statistics
Paul Krugman Rejected by His Peers ---
Click Here
http://townhall.com/columnists/johncgoodman/2015/01/17/paul-krugman-rejected-by-his-peers-n1944174?utm_source=thdaily&utm_medium=email&utm_campaign=nl&newsletterad=
Questionable Integrity of Paul Krugman: How to Mislead With Statistics
"Paul Krugman's Interesting Semantic And Statistical Dodge On Tax Rates,"
by Tim Worstall, Forbes, September 26, 2014 ---
http://www.forbes.com/sites/timworstall/2014/09/26/paul-krugmans-interesting-semantic-and-statistical-dodge-on-tax-rates/
Nobel Laureate economist and political activist Paul Krugman is sometimes
known to cherry pick data or even invent data in order to make a political point
---
Paul Krugman ---
http://en.wikipedia.org/wiki/Paul_Krugman
. . .
Krugman's columns have drawn criticism as well as
praise. A 2003 article in The Economist[ questioned Krugman's
"growing tendency to attribute all the world's ills to George Bush," citing
critics who felt that "his relentless partisanship is getting in the way of
his argument" and claiming errors of economic and political reasoning in his
columns. Daniel Okrent, a former The New York Times ombudsman, in his
farewell column, criticized Krugman for what he said was "the disturbing
habit of shaping, slicing and selectively citing numbers in a fashion that
pleases his acolytes but leaves him open to substantive assault.
"The Missing Data in Krugman’s German Austerity Narrative" Daniel J.
Mitchell, Townhall, February 25, 2014 ---
http://finance.townhall.com/columnists/danieljmitchell/2014/02/25/the-missing-data-in-krugmans-german-austerity-narrative-n1800047?utm_source=thdaily&utm_medium=email&utm_campaign=nl
There’s an ongoing debate about
Keynesian economics, stimulus spending, and
various
versions of fiscal austerity,
and regular readers know I do everything possible to explain that you can
promote added prosperity by reducing the
burden of government spending.
. . .
But here’s the problem with his article. We know
from the (misleading) examples above
(not quoted here) that he’s complained about supposed
austerity in places such as the United Kingdom and France, so one would
think that the German government must have been more profligate with the
public purse.
After all, Krugman wrote they haven’t “imposed a
lot of [austerity] on themselves.”
So I followed the advice in Krugman’s “public
service announcement.” I didn’t just repeat what people have said. I dug
into
the data to see what
happened to government spending in various nations.
And I know you’ll be shocked to see that Krugman
was wrong. The Germans have been more frugal (at least in the sense of
increasing spending at the slowest rate) than nations that supposedly are
guilty of “spending cuts.”
"About Those Income Inequality Statistics An answer to Paul Krugman,"
by Bret Stephens, The Wall Street Journal, January 3, 2014 ---
http://online.wsj.com/news/articles/SB10001424052702304325004579298502492870522?mod=djemEditorialPage_h
Let me do something
New York Times
NYT -0.13% columnist
Paul Krugman isn't exactly famous for doing, at
least not graciously: acknowledge a mistake.
In my Dec. 31 column on income inequality, I used a
data set from the U.S. Census Bureau to make the case that incomes in the
U.S. have been growing across the board, even if the incomes of the wealthy
have grown faster than those of others further down the income scale. But I
wrote those lines looking at a set of numbers that had not been adjusted for
inflation.
Professor Krugman, in a post on his New York Times
blog, takes me to task for this. Had I done so looking at the
inflation-adjusted table, it would have shown the incomes of the bottom 20%
essentially stagnating since 1979 (and long before then, too), though it
also would have shown incomes for the top 20% rising far less dramatically.
That was an error, roughly of the kind the Nobel
Laureate economist made last August when he confused an x for a
1/x. As is his charming wont, Mr. Krugman accuses me not of making an
honest mistake, but of "pulling a fast one."
My mistake is all the more unfortunate because
the basic point I was making is right: Americans are getting richer across
the entire income spectrum, even if they are getting richer at very
different rates. That much is confirmed by data from the Congressional
Budget Office. The CBO finds that between 1979 and 2007 income for poor
households grew by 18%, for the middle classes by nearly 40%, and for the
top 81-99% by 65%. It's the top 1% who have made out very handsomely, with a
jump of 275% over nearly three decades.
The difference between the Census Bureau and CBO
data comes down to the complicated (and ultimately subjective) way in which
"income" is defined. The Census Bureau data relies on a definition of income
that is pre-tax but post-transfer cash income. But it also excludes the
non-cash benefits that go to many of the poor, such as food stamps,
Medicaid, CHIP (children's Medicaid) and housing subsidies. (and now
more free or subsidized medical care and medications)
By contrast, the CBO numbers measure after-tax,
after-transfer income. It also includes non-cash transfers. Those benefits
may not be fungible, but they do have value. And they vindicate my core
point: "The richer have outpaced the poorer in growing their incomes, just
as runners will outpace joggers who will, in turn, outpace walkers." What
mattered, I said, was that "the walking man walks."
My column also noted that President Obama erred
when he said the top 10% take half of aggregate income; in fact, it's the
top 20% who take half the income, according to Census Bureau data. Mr.
Krugman takes issue with this, too, saying the Census Bureau figures are
pretty much worthless when it comes to quantifying the aggregate incomes of
the very rich. Much better, he says, is data from a controversial study by
two left-wing French economists, Emmanuel Saez and Thomas Piketty, which is
in line with President Obama's contention.
Talk about a fast one. As Greg Mankiw, chairman of
the Harvard Economics department, notes, Saez-Piketty has its own set of
very large problems: "The data are on tax units rather than households, they
do not include many government transfer payments, they are pre-tax rather
than post-tax, they do not adjust for changes in household size, and they do
not include nontaxable compensation such as employer-provided health
insurance."
Ultimately, debates about income inequality are
never going to be settled because both "income" and "inequality" are very
hard to measure. Is the best measure of inequality wage inequality,
income inequality, or consumption inequality? If a poor family today can now
afford a car, an air conditioner, a computer and other goods unaffordable or
unavailable to the poor of 35 years ago, can they really be said to have
stagnated economically? How do changes in the tax code affect the ways in
which income can be reported, sheltered and measured? What is the true money
value of health insurance?
And so on and on. The argument I made in my column
is that inequality should only matter to Americans if, Russia-like, the rich
are getting richer at the expense of the poor.
Neither the Census Bureau nor the CBO figures show
that.
None of this is to excuse the fact that I goofed in
my use of data. My apologies. As for Mr. Krugman, he should bear in mind
something the public editor of the New York Times once said about him: "Paul
Krugman has the disturbing habit of shaping, slicing and selectively citing
numbers in a fashion to please his acolytes but leaves him open to
substantive assaults."
"Is Paul Krugman Leaving Princeton In Quiet Disgrace?" by Ralph Benki,
Forbes, July 14, 2014 ---
http://www.forbes.com/sites/ralphbenko/2014/07/14/is-paul-krugman-leaving-princeton-in-quiet-disgrace/
Professor Paul Krugman is
leaving Princeton. Is he leaving in disgrace?
Not long, as these things go, before his departure
was announced Krugman thoroughly was indicted and publicly eviscerated for
intellectual dishonesty by Harvard’s Niall Ferguson in a hard-hitting
three-part series in the Huffington Post, beginning
here, and with a coda in
Project Syndicate, all
summarized at Forbes.com. Ferguson, on
Krugman:
Where I come from … we do not fear bullies. We
despise them. And we do so because we understand that what motivates
their bullying is a deep sense of insecurity. Unfortunately for Krugtron
the Invincible, his ultimate nightmare has just become a reality. By
applying the methods of the historian – by quoting and contextualizing
his own published words – I believe I have now made him what he richly
deserves to be: a figure of fun, whose predictions (and proscriptions)
no one should ever again take seriously.
Princeton, according to
Bloomberg News, acknowledged Krugman’s
departure with an extraordinarily tepid comment by a spokesperson. “He’s
been a valued member of our faculty and we appreciate his 14 years at
Princeton.”
Shortly after Krugman’s departure was announced
no less than the revered Paul Volcker, himself a Princeton alum, made a
comment — subject unnamed — sounding as if directed at Prof. Krugman. It
sounded like “Don’t let the saloon doors hit you on the way out. Bub.”
To the
Daily Princetonian (later reprised by the
Wall Street Journal, Volcker
stated with refreshing bluntness:
The responsibility of any central bank is price
stability. … They ought to make sure that they are making policies that
are convincing to the public and to the markets that they’re not going
to tolerate inflation.
This was followed by a show-stopping statement:
“This kind of stuff that you’re being taught at Princeton disturbs me.”
Taught at Princeton by … whom?
Paul Krugman, perhaps? Krugman, last year, wrote
an op-ed for the New York Times entitled Not
Enough Inflation. It betrayed an
extremely louche, at best, attitude toward inflation’s insidious
dangers. Smoking gun?
Volcker’s comment, in full context:
The responsibility of the government is to have
a stable currency. This kind of stuff that you’re being taught at
Princeton disturbs me. Your teachers must be telling you that if you’ve
got expected inflation, then everybody adjusts and then it’s OK. Is that
what they’re telling you? Where did the question come from?
Is Krugman leaving in disgrace? Krugman really
is a disgrace … both to Princeton and to the principle of monetary
integrity. Eighteenth century Princeton (then called the College of New
Jersey) president John Witherspoon, wrote, in his
Essay on Money:
Let us next consider the evil that is done by
paper. This is what I would particularly request the reader to pay
attention to, as it was what this essay was chiefly intended to show,
and what the public seems but little aware of. The evil is this: All
paper introduced into circulation, and obtaining credit as gold and
silver, adds to the quantity of the medium, and thereby, as has been
shown above, increases the price of industry and its fruits.
“Increases the price of industry and its fruits?”
That’s what today is called “inflation.”
Inflation is a bad thing. Period. Most of all it
cheats working people and those on fixed incomes who Krugman pretends to
champion. Volcker comes down squarely, with Witherspoon, on the side of
monetary integrity. Krugman, cloaked in undignified sanctimony, comes down,
again and again, on the side of … monetary finagling.
Krugman consistently misrepresents his
opponents’ positions, constructs fictive
straw men, addresses marginal figures, and
ignores inconvenient truths set forward by figures of probity such as the
Bank of England and the
Bundesbank,
thoughtful work such as that by Member of
Parliament (with a Cambridge Ph.D. in economic history) Kwasi Kwarteng, and,
right here at home, respected thought leaders such as
Steve Forbes and
Lewis E. Lehrman (with whose
Institute this
writer has a professional affiliation).
Continued in article
Bob Jensen's threads on professors who cheat ---
http://www.trinity.edu/rjensen/Plagiarism.htm#ProfessorsWhoPlagiarize
**How to Mislead With Statistics
There's a
Lake Wobegon Effect Inside Every New York K-12 School
"Cuomo’s Grade Inflation," by Alysia Finley, The Wall Street Journal,
December 22, 2014 ---
http://www.wsj.com/articles/political-diary-cuomos-grade-inflation-1419279956?tesla=y&mod=djemMER_h&mg=reno64-wsj
Nothing quite motivates New York Gov. Andrew Cuomo
like bad publicity. Last Thursday—mere days after the state’s new and
putatively improved teacher-evaluation system was exposed as a sham—a top
aide to Mr. Cuomo revealed the Democratic governor’s heretofore undetected
interest in aggressive school reform.
Earlier in the week, the state Board of Regents had
reported that nearly 96% of teachers statewide were rated “effective”
(53.7%) or “highly effective” (41.9%) under New York’s new evaluation
system. Fewer than 1% of teachers were deemed “ineffective.” Grades for
principals were similarly inflated, with 93.5% receiving good marks.
New York’s teacher evaluations were widely panned:
How could so many teachers and principals be excelling when, according to
the state, only 34.8% of students are proficient in math and 31.4% in
English?
Mr. Cuomo’s director of state operations, Jim
Malatras, shot off a missive to state Education Commissioner John King and
Board of Regents Chancellor Merryl Tisch calling the failing status quo
“unacceptable. “How is the current teacher evaluation system credible when
only one percent of teachers are rated ineffective?” Mr. Malatras wrote.
Last year the governor hailed the new teacher
evaluations as “one of the strongest in the country.” Yet school districts
receive wide latitude on how to assess teachers. Only 20% of the evaluation
must be based on student learning.
But don’t blame Mr. Cuomo for the “unacceptable”
state of schools. “As you know, the Governor has little power over
education, which is governed by the Board of Regents,” wrote Mr. Malatras.
Ostensibly, that’s why Mr. Cuomo is soliciting the Board’s input before
pursuing “an aggressive legislative agenda” next year.
Mr. Malatras asked Mr. King and Ms. Tisch for their
thoughts about removing bad teachers; changing teacher training; providing
financial incentives for high-performing teachers; overhauling teacher
tenure; raising the charter school cap; and modifying mayoral control of New
York City schools.
Asking for feedback is all very well, but Mr. Cuomo
here is merely looking for cover. The governor would win more credit as a
leader if he weren’t always punting decisions (tax reform, fracking) to
state bureaucrats to avoid leaving political fingerprints. One might
describe his governing style as an invisible hand.
Continued in article
Bob Jensen's threads on grade inflation ---
http://faculty.trinity.edu/rjensen/assess.htm#RateMyProfessor
**How to mislead with statistics
Media Misrepresents Poverty Rate of US Children by More Than Double ---
http://www.breitbart.com/big-government/2015/01/20/media-misrepresents-poverty-rate-of-us-children-by-more-than-double/
In a breathless, Drudge Report-linked headline, the Washington Post
reported last week that the “Majority
of U.S. public school students are in poverty.”
A Huffington Post piece by Rebecca Klein, published 12 minutes
earlier, sported a similar headline, “More
Than Half Of American Schoolchildren Now Live In Poverty.”
. . .
In 2013, some 19.9 percent of children in America
were in families with income at the poverty line or below—in 2014, the
income threshold was $23,850 for a family of four. (Among the native-born of
all ages, the poverty rate was 13.9 percent while among non-citizens, the
rate was 22.8 percent while naturalized residents had a poverty rate of 12.7
percent.)
So, how does 19.9 percent become 51 percent?
Continued in article
While a
move is underway to destroy the American Dream of rags to riches (by taxing away
the riches) the Chinese dream is on the rise.
The Chinese Dream
How a Chinese billionaire went from making $16 a month in a factory to being one
of the world's richest self-made women with an $8.3 billion real-estate empire
---
https://www.businessinsider.com/worlds-richest-self-made-woman-wu-yajun-net-worth-2019-2
Top 50 Billionaires in China ---
https://en.wikipedia.org/wiki/List_of_Chinese_by_net_worth
Jensen
Comment
The question for students to critically debate is why a
supposed communist country allows so many billionaires to rise up from poverty.
That's supposed to happen in the USA where a child growing up in deep
poverty (think Oprah Winfrey or Howard Shultz) became a multi-billionaires.
But is it also supposed to happen under communism? If
so, why?
**How to Mislead With Statistics
How past income tax rate cuts on the wealthy affected the economy ---
https://www.politico.com/interactives/2017/gop-tax-rate-cut-wealthy/
Jensen Comment
This article makes three huge statistical mistakes and one huge economic
mistake. The economic mistake is that it assumes that the purpose of tax
decreases or increases is importantly analyzed in GDP correlations. The GDP is
only one of many statistics of importance in the economy, and the GDP index has
many, many dangers ---
https://en.wikipedia.org/wiki/Gross_domestic_product#Limitations_and_criticisms
Distinctions must be kept in mind between quantity and quality of growth,
between costs and returns, and between the short and long run. Goals for
more growth should specify more growth of what and for what.
Secondly, the article pretends that correlation is causation --- a Statistics
101 enormous error.
Thirdly, it ignores the lags in impact of most any measures used to stimulate
the economic exist and can be quite variable in terms of whether the stimulus
impacts take months versus years. For example, it is speculated that Clinton
benefited far more from the Reagan tax cuts than Reagan.
Thirdly, the relationship between economic performance (however measured on the
y-axis) is a multivariate process with enormous multicollinearity,
heteroscedasticity, non-stationarity, and most everything you can think of that
can go wrong about multivariate analysis in terms of regression and graphics.
Rather than do regression-graphic time series analysis like you see in this
article I would rather do a crowd-sourcing analysis.
There must be some reason why virtually all developed nations reduced their tax
cuts on the wealthy over three decades following the early 1970s.
Were all nations, including all of Scandinavia, badly mistaken in choosing to
hugely reduce tax rates on the wealthy?
For example, lot's of bad things happened in Sweden in the 1960s and 1970s when
the Swedes were trying to confiscate almost everything from it's highest income
earners.
Especially look at
http://www.econlib.org/library/Enc/MarginalTaxRates.html
For more details see
http://www.cs.trinity.edu/~rjensen/temp/TaxNoTax.htm
*Most certainly the benefit of these tax cuts on the wealthy were not all
identical across so many nations and across such a long period of time.
And most certainly the above Politico analysis is
superficial in looking at only one nation (rather than a hundred) and one
predictor (the highest tax rate) variable of GDP.
Shame on Politico (a very biased outfit to say the least).
**How to
Mislead With Statistics
China’s economy is about 12 per cent smaller than official figures indicate, and
its real growth has been overstated by about 2 percentage points annually in
recent years, according to research ---
https://marginalrevolution.com/marginalrevolution/2019/03/china-non-fact-of-the-day.html
Guess how Nate Silver ranks the 16 Democratic candidates for the 2020
presidential election as of March 2019?
https://fivethirtyeight.com/features/is-beto-orourke-overrated-or-underrated/
Jensen Comment
The winner to date (Kamela Harris) is also the one who promises to spend the
most on green initiatives, free health care, guaranteed income for all
Americans, housing-for-all, and on and on and on.
The betting odds place her ahead of Bernie Sanders and Joe Biden at this point
in time.
Bernie Sanders’s housing-for-all plan,
explained ---
https://www.vox.com/2019/9/19/20873224/bernie-sanders-housing-for-all
The fleet of Democratic Party candidates are active in promoting $100+
trillion dollar government spending but are vague or silent on taxation.
What they don't like is how Nordic countries tax the middle class ---
http://reason.com/blog/2019/03/06/low-tax-socialists-medicare-for-all-gnd
Consider how taxation works in the nordic countries
that many American socialists describe as their models. Yes, taxes are high
on the rich. But as the Tax Foundation noted during Sanders' last
presidential campaign, they are also high on the middle class. The 70
percent top marginal tax rate floated by Ocasio-Cortez would apply to income
earned over $10 million, affecting only about 16,000 Americans each year. In
countries like Denmark, Sweden, and Finland,
marginal tax rates of near 60 percent hit earners deep
into the middle class. Denmark's 60 percent
marginal rate applies to income over 1.2 times the national average, which
in the U.S. would hit earners making just $60,000 a year—not exactly
millionaires and billionaires. These countries also typically rely on
value-added taxes that are inherently regressive, placing a bigger burden on
the poor and middle class than on the rich.
The New York Times' David Brooks: ‘Medicare for All’: The Impossible
Dream ---
https://www.nytimes.com/2019/03/04/opinion/medicare-for-all.html?action=click&module=Opinion&pgtype=Homepage
Jensen Comment
This is one of the more sensible articles about Medicare-for-All. I recommend
reading it carefully.
In my viewpoint the estimated cost of slightly over $3 trillion per year is
greatly underestimated.
Firstly, it underestimates the extra cost added by
covering long-term care (think nursing homes) that is not presently covered in
Medicare.
Nursing Homes ---
https://en.wikipedia.org/wiki/Nursing_home_care
How to Mislead With Statistics (distortions)
Median prices per month for nursing homes in all 50 states ---
https://www.businessinsider.com/nursing-home-private-room-monthly-median-price-by-state-2019-3#10-delaware-10950-per-month-1
Secondly, it ignores the attraction that free
medical care will have in attracting millions and millions of sick people,
especially older people in need of free nursing homes,
to enter into the USA.
The New York Times: Border at ‘Breaking Point’ as
More than 76,000 Migrants Cross in a Month ---
https://www.nytimes.com/2019/03/05/us/border-crossing-increase.html
That extrapolates to nearly a million a year before we attract millions more
with free medical care, housing, education, food stamps, and guaranteed income.
The good news is that, with exponential growth,
there will soon be enough to bury the Republican party forever. Exhibit A is
California
Let's face facts
We've lost the wars on both drugs and "undocumented immigration." Exhibit A is
California that's surrendering in fighting both wars.
Face recognition software is now illegal in the
sanctuary city of San Francisco where police are duty-bound to protect
"undocumented" migrants from being deported.
How do
you deport a helpless person dropped off and lying 10 feet inside the USA
border?
The fleet of Democratic Party candidates are active in promoting $100+
trillion dollar government spending but are vague or silent on taxation.
What they don't like is how Nordic countries tax the middle class ---
http://reason.com/blog/2019/03/06/low-tax-socialists-medicare-for-all-gnd
Consider how taxation works in the nordic countries
that many American socialists describe as their models. Yes, taxes are high
on the rich. But as the Tax Foundation noted during Sanders' last
presidential campaign, they are also high on the middle class. The 70
percent top marginal tax rate floated by Ocasio-Cortez would apply to income
earned over $10 million, affecting only about 16,000 Americans each year. In
countries like Denmark, Sweden, and Finland,
marginal tax rates of near 60 percent hit earners deep
into the middle class. Denmark's 60 percent
marginal rate applies to income over 1.2 times the national average, which
in the U.S. would hit earners making just $60,000 a year—not exactly
millionaires and billionaires. These countries also typically rely on
value-added taxes that are inherently regressive, placing a bigger burden on
the poor and middle class than on the rich.
Finland’s government collapses over failed health care reform ---
https://www.politico.eu/article/finlands-government-collapses-over-failed-health-care-reform/?fbclid=IwAR3ZUM2rsGzcoIVMFVHwwTfE15MAxpo_9poClu2d7pjzFdrz84WORKZTSX0
Bernie Sanders: "You’re Damn Right We’re Going to Destroy Private Health
Insurance" ---
Click Here
Reason Magazine's Really Important Concerns about Medicare-for-All"
The Contradiction at the Heart of Bernie Sanders' Medicare for All Plan ---
https://reason.com/2019/04/24/the-contradiction-at-the-heart-of-bernie-sanders-medicare-for-all-plan/
There is a huge
contradiction at the heart of Bernie Sanders' Medicare for All plan.
On the
one hand, Sanders not only wants to expand government-provided coverage to
everyone in the country, he wants that coverage to be significantly more
generous than Medicare, private insurance, or comparable government-run
systems in other countries. On the other hand, he wants to drastically cut
payments to hospitals, many of which lose money on Medicare right now,
making up for the program's relatively low payments by charging much higher
prices to private insurers.
What
Sanders is proposing, in other words, is that the government finance a
significant increase in government services while also radically reducing
the amount it pays for those services. Even making generous assumptions,
it's almost impossible to see how his plan could work.
Let's
start with the promises Sanders makes about Medicare for All. No networks,
premiums, deductibles, or copayments. Under his plan, essentially all
non-cosmetic services would be free at the point of care for everyone.
Sanders calls this
Medicare for All, but what he's describing isn't Medicare as we now know it.
As
The New York Times
noted
earlier this year upon the release of a Sanders-inspired Medicare for All
bill in the House, the new program would "drastically reshape Medicare
itself," changing both what it pays for and how. In many ways, it would be a
completely different program. Medicare for All, in other words, isn't really
Medicare.
And that
program would be far more expansive and expensive than nearly any other
comparable system. It would cover more, and require less direct financial
outlays (not including taxes), than either today's Medicare or typical
private insurance plans in the U.S.
It would also be substantially more generous
than the national health systems set up in other countries. Sanders likes to
unfavorably contrast America's mixed public-private health care system with
foreign systems where the government is more directly involved. When he
announced the 2017 version of his Medicare for All plan, for example, he
bemoaned
the state of affairs in the United States "a time when every other major
country on earth guarantees health care to every man, woman, and child."
Discussions about health care policy on social media often include some
variant of the question, "If every other country with a developed economy
can do it, why can't the United States?"
The problem with this line of questioning is
that what Sanders is proposing
isn't what other
countries do. Canada, for example, has a
single-payer system, but it doesn't cover dental care, vision, drugs, or any
number of other services. A majority of Canadians carry private insurance in
order to cover those services. In Britain, which offers a fully socialized
medical system where health care providers are government employees, many
resident still buy private coverage. Sanders, on the other hand, would
effectively wipe out
private coverage in the space of just four
years.
There are
similar limitations on coverage in other countries, like the Netherlands.
It's also true in Australia, where patients typically pay a percentage of
the cost of specialty services. It's true that in these countries,
government plays a more central role in health care financing. But their
systems have also reckoned with costs and tradeoffs in a way that Sanders,
after so many years, has not.
Indeed,
the main trade-off that Sanders seems willing to discuss is the elimination
of insurance companies, which he portrays as greedy middlemen driving up the
cost of health care. Wiping out the industry in one fell swoop, as Sanders
has proposed, would be a unprecedented and disruptive move that would have
significant economic repercussions, including the probable loss of thousands
of insurance industry jobs. But it still wouldn't do much to bring down the
cost of health care, because so much money in the nation's health care
system is tied up in provider payments, especially hospitals.
And
therein lies the
(first)
contradiction.
Most
people probably think of hospitals as places where you go to get health care
services. Politically and economically, however, they also fulfill another
role: They are hubs for stable middle-class jobs, paying reasonably good
wages to thousands of highly trained workers, most of whom are not doctors
or specialists earning stratospheric salaries.
To
acquire the revenue to pay for all these jobs, hospitals rely on a mix of
private and public payments. Public payments make up a somewhat larger share
of total hospital budgets, but private payers are typically charged much
higher prices.
Hospitals
like to argue that Medicare and Medicaid payments are too low to cover their
costs, and that as a result, higher private payments effectively subsidize
public health coverage. Critics (with some evidence) often respond that
hospitals either overstate or don't really understand their own costs, and
that this is just a ploy to extract more money from government health
programs and private payers.
But when
considering Medicare for All, the particulars of this debate are largely
beside the point, because there is simply no question that eliminating
private insurance and payment for all services would drastically reduce the
amount of revenue for hospitals.
Yet that
is exactly what Sanders wants to do. His plan calls for paying for health
care services at Medicare rates, which means that, practically overnight,
hospitals would end up with far, far less revenue. Exactly how much is
unclear, but one estimate indicated that payments could drop by as much as
40 percent.
That would leave hospitals with a couple of
difficult choices. They could eliminate services. They could try to force
some employees to take pay cuts. They could fire large numbers of workers.
Or they could simply shut down. As a recent
New York Times
report
on how Medicare for All would affect hospitals noted, rural hospitals—many
of which are already struggling to stay afloat—would be particularly at risk
of closing.
Whatever
ended up happening, there is simply no way most hospitals would or could
continue operating as they do now under the payment regime that Sanders
envisions. Lots of middle class jobs would disappear. Services would be
eliminated or cut back.
Yet Sanders not only imagines that hospitals
would continue to operate as they do now, but that they would expand their
services to
even more people, since more people would have coverage. And since he
also imagines a system with no deductibles or copays, those people would
almost certainly end up dramatically increasing utilization of hospital
services.
Studies of health insurance have consistently
shown
that expansions of health insurance result in increased demand for (and use
of) health care services; more people with coverage means more people lining
up to get care. (Relatedly, introducing even very small copays—on the order
of just a few dollars—can reduce the number of visits to doctors and
hospitals.) Greater utilization of health care services does not necessarily
translate into
measurably better
physical health outcomes. But it does
increase the strain on the health care delivery system—which is to say, it
puts a huge amount of pressure on hospitals.
Continued in article
Jensen Comment
Another contradiction is that to pay for Medicare-for-All program Bernie Sanders
wants to tax most of what high-income workers earn, and the highest income
professionals in the USA on average are physicians. There is currently a
shortage of physicians. This shortage will become critical as medical care
becomes virtually free and often overused as a free service by hundreds of
million residents of the USA.
Here's the second contraction
Taxing physician income at 70% or more will discourage students from becoming
physicians and will give existing physicians incentives to retire early or work
at leisurely part-time doctoring. Far better work two days per week and pay a
30% income tax rate than to be a 60--hour week highly stressed, and overworked
physician being taxed at 70% of every extra dollar earned.
Medicare-for-All is a Tragedy of the Commons ---
https://en.wikipedia.org/wiki/Tragedy_of_the_commons
Great
Debate Topic
Would Tesla be better off if employees had ownership control of the entire
company?
Bernie Sanders calls for employee
ownership control of big companies ---
https://www.vox.com/2019/5/29/18643032/bernie-sanders-communist-manifesto-employee-ownership-jobs
Jensen
Comment
This is one of the topics that sounds great in theory, but it's not sustainable
in real life.
First
and foremost employees have never been denied investment in the companies traded
in public, and having the public trade those securities adds liquidity to stock
owned by employees and other investors. Indeed many companies have employee
stock option and other stock ownership plans ---
https://en.wikipedia.org/wiki/Employee_stock_ownership
But employee ownership of traded stock is enormously different from corporate
ownership restricted only to employees. Employee-only ownership is a little like
when a professor personally invests/builds a nice home on campus lots leased to
employees by Stanford University for $1 per year. This is wonderful while you're
working at Stanford, but at some point you may want to sell that home you own
for whatever reason (you changed jobs, you retired and want to move elsewhere,
you want to move into assisted living, you died and your children aren't allowed
to own the home, etc.). The thing is that when you want to sell a Stanford
campus home you're are limited to only buyers to work for
Stanford, thereby, excluding all other prospective buyers If you
bought a home off campus in 1971 instead of on the Stanford Campus
your capital gain will be tens of millions of dollars because you can sell
to anybody in the world who wants to buy a home in or near Palo Alto rather than
only having that subset of buyers who work for Stanford. In economics it's
called the law of supply and demand, and restricted demand means lower prices.
Of
course employees can have ownership control without owning 100% of the voting
stock of a company, but ownership control changes everything in the investment
world. Outside investors are dubious about investing in a company when they know
employee ownership interest have priority over outside-investor interests. The
game for outside investors is rigged from the start, and many outside investors
can avoid labor-controlled investments.
Actually Chrysler was once owned heavily by employees.
Bernie won't tell you how that worked out since employee shares in the
"Old Chrysler" became worthless when new capital stock in the "New Chrysler" was
issued in bankruptcy ---
https://www.heritage.org/government-regulation/report/the-chrysler-bail-out-bust
This
illustrates where employee ownership can be bad for employee savings portfolios.
For most employees in an employee-controlled company the employer company's
shares are virtually the only stock in their savings portfolios. In that case
employee portfolios are not diversified. Employees can have their entire savings
wiped out if those shares become valueless --- as was the case when Chrysler
went bankrupt and needed a government bailout.
There
are successful employee-controlled companies ---
https://www.nceo.org/articles/employee-ownership-100
But these are not large companies relative to the USA's largest companies owned
by public investors or in a few cases families.
The
bottom line is that employee control of all the USA's large companies is a
recipe for economic disaster of the USA. Bernie knows this, because his long run
hope is that government will eventually take over those companies in his
long-run quest for a socialist USA in which government owns all the big
companies.
The Bernie Sanders Paradox: When Socialism
Grows Old ---
https://libcom.org/library/bernie-sanders-paradox-when-socialism-grows-old
**How to Mislead With Statistics
Here's how much money doctors across the US make ---
https://www.businessinsider.com/how-much-money-do-doctors-make-gender-pay-gap-doximity-study-2019-3
Jensen Comment
This article is a great example of how statistical reports can be misleading if
they only focus on mean averages without added information about standard
deviations and skewness and missing variables. For example, consider
neurosurgery. My wife's spine surgeon in Boston is what he calls a "big-back"
surgeon. He performs spinal surgeries that 95+% of the back surgeons in the USA
refuse to perform. He actually broke Erika's spine into three pieces and then
attached four rods from her hips to her neck. Afterwards, however, she can still
pick up a tissue off of the floor when bending her spine. Needless to say his
rates, sometimes exceeding tens of thousands of dollars per surgery, are greater
than the rates of "little-back" surgeons who also work out his office. By the
way, he's not on the faculty of the Harvard Medical School. However, every time
I've spoken with him he was followed by two or three Harvard Medical School
neurosurgery residency physicians who were what I called his "puppies."
By the way, it might be interesting to study details of his malpractice
insurance premiums and lawsuits. He's amazing because he has the guts to be a
"last-chance" neurosurgeon in spite of the circling lawyers. By last chance I
mean when patients can no longer find a neurosurgeon who will operate on their
spines he's their "last chance." Erika had over a dozen spine surgeries before
she at last found this "big-back" surgeon in Boston.
There are also many other troubles with the above article. For example,
malpractice insurance is very high priced in the USA relative to all other
nations. And malpractice insurance costs vary greatly with specialties such as
being very high for obstetrics (lawyers sue for every bad baby) versus
neurosurgery versus psychiatry versus primary care physicians.
Let's consider an example. According to the study the average pay for a
neurosurgeon is $617,000. But that does not account for differences in whether
that salary is net of malpractice insurance premiums. Such netting out is
complicated because many neurosurgeons make this much or much more without
having to pay malpractice insurance premiums. My wife's spine surgeon who
installed her morphine pump is an employee of the Dartmouth Hitchcock
Medical Center that pays malpractice insurance for virtually all employees and
medical school faculty. However, many neurosurgeons who operate in that same
medical center are not employees and must pay their own malpractice insurance.
Similarly, there's a nearby Veterans Hospital where VA neurosurgeons do not have
to pay their own malpractice insurance. But if the VA has to outsource a
particular type of surgery that surgeon's bill to the VA will include
malpractice insurance.
Incomes of many specialists vary when they must pay for their own staff
versus have no expenses for staff. For example, the Dartmouth Hitchcock Medical
Center pays for all staff such as receptionists, nurses, technicians,
accountants, etc. It even pays for lawyers when needed. The
private-practice physicians who may also perform surgeries at this medical
center must pay for their own office space and staff. How do you compare a
salaried employee of that medical center with the profits of a private-practice
physician?
I might point out a political problem related to all of this. There's an old
saying: "Show me a bad doctor, and I'll show you a rich professional." The
point is that even at the lowest end of the income distribution medical doctors
in the USA are well paid.
The Democratic candidates for the 2020 presidential nomination have created a
paradox.
Most, not all, students are drawn to medical school in anticipation of
relatively high after-tax incomes. The
politicians advocating Medicare-for-All want to fund this $30+ trillion cost
with greatly increased taxes (think 70% of a physician's income). At the same
time more than twice as many physicians will be needed to staff
Medicare-for-All, especially with 76,000 new patients crossing the border each
month at current rates estimated by the NYT ---
https://www.nytimes.com/2019/03/05/us/border-crossing-increase.html
Eventually, the progressives will also legislate free medical school education.
But how many students will flock to medical schools even if they are free? My
guess is very few if you are gong to tax or regulate away 70% of their income
when they at long last begin to practice medicine.
The problem with becoming a physician is not just the cost of
medical school. The problem is the ordeal --- those years of education and
training needed to become masters of their crafts. The time needed varies with
specialties, but you don't become a neurosurgeon without years of ordeal in
training before you can bill your first paying patient. And there's a lot of
blood, sweat, and tears in those training years. Even worse is that there's a
lot of weekly tension and risk of burn out in the years of practice that follow.
Tell that to the advocates of Medicare-for-All combined with soaring taxes.!
If you want to double the number of physicians in the USA you not only have
to make medical school free; You have to let them be the highest paid
professionals on average after taxes.
PS
You can read more about Erika's ordeal with pain and surgeries at
http://www.cs.trinity.edu/rjensen/Tidbits/ErikaBob/ErikaPain/Set01/Set01.htm
I might add that the electronic pain stimulator installed eventually proved to
be worthless. The same surgeon who installed it removed it and replaced it with
a morphine pump. The pump is no magic bullet, but its more effective than the
electronic wiring up and down her spine.
Canadian doctors still make dramatically less than U.S. (and UK and
German) counterparts: study ---
https://nationalpost.com/news/canada/canadian-doctors-still-make-dramatically-less-than-u-s-counterparts-study
Canadian doctors make less than the OECD average, although they do not pay
nearly as much as USA physicians for malpractice insurance, office space, and
labor assistants like office nurses ---
https://en.wikipedia.org/wiki/Physicians_in_Canada
. . .
Canada
should not ignore the wage gap, as a sudden shortage of certain specialists
in the States could trigger a drain from here, said Dr. John Haggie,
president of the Canadian Medical Association. Canada saw a net loss of
doctors to the U.S. in the 1990s, as provinces instituted doctor pay caps
and tried to rein-in fee increases as a way to corral health costs.
But
Dr. Haggie voiced no particular envy Tuesday at the statistics just
published in the journal
Health Affairs
Jensen Comment
I read where there are 72,000 physicians employed in the Canadian health system.
The population of Canada is 37+ million spread over nearly 4 million square
miles.
In the USA
Patients experience long waits (months) for doctor appointments largely due to
the shortage of Canadian physicians. Delays for elective procedures such as knee
and hip replacements are so long that many Canadians use their own savings to
get such surgeries performed in the USA.
In the USA there are over 950,000 physicians who, on average, are the
highest paid professionals in the USA..
https://en.wikipedia.org/wiki/Physicians_in_the_United_States#Demographics
Also see
https://247wallst.com/special-report/2017/03/08/states-with-the-highest-and-lowest-paid-doctors/
The population of the USA is nearly 10 times that if Canada if you include the
undocumented immigrants. USA residents are spread over roughly the same number
of square miles as Canada, although the distribution is not as skewed as that of
Canada is skewed toward the south.
Bernie Sanders: "You’re Damn Right We’re Going to Destroy Private Health
Insurance" ---
Click Here
Politico: Progressives want a government-managed single payer insurance
program to replace (in two years) all USA private sector medical insurance
companies ---
https://www.politico.com/story/2019/02/26/house-democrats-medicare-for-all-1189139
Here's
one of the problems as they also plan to cut back on what hospitals, drug
companies, physicians earn in the USA ---
https://www.businessinsider.com/highest-paying-job-in-every-us-state-2019-2
Related
to the above problem is will be the shortage of physicians and hospitals to
serve the expected increase in services expected by wider coverage and the
attraction of hordes undocumented immigrants primarily coming to the USA for
needed medical services like dialysis and transplants.
How do you attract
more students to become physicians (especially in rural USA) when you plan to
cut back on what physicians earn with caps on billings and higher taxes on the
earnings of physicians.
With
physicians the problem is huge because of the long ordeal it takes to become a
licensed specialist and the likelihood of early burnout.
I'm especially aware of this problem because one of our top regional
hospital general surgeons, frightfully overworked, in these mountains just
flamed out before reaching the age of 50.
Support
for Medicare-for-All will evaporate once voters become aware that confiscating
the wealthy and high earners will only pay a tiny fraction
for the cost and that, when combined with other progressive programs like
the green initiative, guaranteed income, student loan forgiveness, housing
subsidies, free college, cash reparations to African and Native Americans, etc.
the price tags aggregate way over $100 trillion on
top of the existing $100+ trillion in contracted entitlements for Medicaid,
Medicare, Veterans Benefits, Social Security, Disability Payments, unfunded
pensions, etc.
How to Mislead With Statistics
Three reasons why people fall for politicians’ lies about statistics ---
https://theconversation.com/3-reasons-why-people-fall-for-politicians-lies-about-statistics-110014
Jensen Comment
A reason for being misled (related to letting emotions rule) is hoping that the
politician will become powerful enough to make the lie come true. For example,
many people are falling for statistics cited and the promises made by promises
of guaranteed income for everybody in the USA (think AOC and Kamela Harris).
Nancy Pelosi warns of the hazards of believing those lies.
The Democratic Party is Split
“You have to make decisions that you’re going to reach certain goals, and some
of our goals we think are
achievable”
Nancy Pelosi (when criticizing Alexandria's Green New Deal and
Basic (Guaranteed) Income Medicare-for-All)
Click Here
Added
Jensen Comment
I suspect progressives will eventually make
medical schools much cheaper. However, this will not solve the problem since
these same progressives also want to tax what physicians make at 70+% and put
severe caps on what they can charge for medical services (makes me think of rent
control disasters). It's like making physicians pay their own fees
https://www.businessinsider.com/highest-paying-job-in-every-us-state-2019-2
What progressives can't do much about is to
take what discourages medical students the most ---
the years of ordeal it takes to master their crafts.
One almost certain solution for the USA
will be what my biologist colleague calls the "French solution" --- which
Jagdish tells us is also the "Indian solution." Physicians commence medical
school within one year out of high school (or in some instances zero years after
high school). Medical students don't have "waste" 3-5 years as undergraduates.
Johns Hopkins has a small experimental program something like the French
solution.
Another possible help to physicians that
progressives are divided over is malpractice insurance and lawsuit pots of gold.
The Canadians virtually cut the lawyers out of the equation (except in outlier
instances) that makes malpractice insurance in Canada almost nothing compared to
the USA. Medical boards in Canada pay victims for damages but no punitive damage
awards.
Amazingly, however, the State of Texas
passed a constitutional amendment severely capping punitive damages. The NYT
reported that almost immediately medical school graduates started seeking jobs
in Texas.
What will make malpractice insurance relief
difficult is that most of our USA federal and state legislators are lawyers. It
amazed me that the lawyers in Texas let the punitive-damage pot of gold slip
through their fingers in the Lone Star State.
The WSJ reports that progressive support
for eliminating private sector medical insurance companies is waning due to the
massive cost of replacing it with a government bureaucracy. Physicians and
hospitals have barely had a chance to fight but will fight tooth and nail if
Medicare-for-All ever becomes a threat to them.
The real test is Bernie Sanders.
He still favors eliminating the private sector in medical insurance and ignores
the fact that even Medicare and Medicaid outsource insurance claims to the
private sector that's currently geared up
with the trained employees and software to process such claims.
It's not so much that Bernie Sanders is a
threat as the threat that hordes of socialists are also elected to the House and
Senate if Bernie becomes wildly popular. The reason progressives like Bernie are
currently vague about funding Medicare-for-All is that
they know that they will lose millennial support
once it's revealed that middle income and maybe even poor people will be taxed
for their medical coverage or copays will be charged (as they are in many other
nations like Canada).
Or some nations like Germany greatly limit
what's covered in the national plan, thereby forcing those who can afford it to
buy secondary medical insurance from the private sector to pay for better
services (like not having to wait years for a knee or hip replacement).
Animated Visualization of the United States’ Exploding Population Growth
Over 200 Years (1790 – 2010) ---
A Visualization of the United States’ Exploding Population Growth Over 200 Years
(1790 – 2010)
USA Debt Clock
--- http://www.usdebtclock.org/ ubl
In September 2017 the USA National Debt exceeded $20 trillion for the first time
---
http://www.statedatalab.org/news/detail/national-debt-surpasses-20-trillion-for-the-first-time-in-us-history
Human Population Over Time on Earth ---
https://www.youtube.com/watch?v=PUwmA3Q0_OE
**How to Mislead With Cherry
Picking
Debunking the Capitalist Cowboy ---
http://bostonreview.net/class-inequality/nan-enstad-debunking-capitalist-cowboy
Jensen Comment
This article is an example of politically-motivated cherry picking.
The article focuses on the long-ago past of robber barons. It totally ignores
such "cowboys" as Bill Gates, Steve Jobs, Howard Shultz, Mike
Bloomberge, Jeff Bezos, Elon Musk, and the other billionaires
who rose to great wealth more ethically.
The article totally ignores the
rags to riches stories of the many billionaire capitalists in modern China.
While a
move is underway to destroy the American Dream of rags to riches (by taxing away
the riches) the Chinese dream is on the rise.
The Chinese Dream
How a Chinese billionaire went from making $16 a month in a factory to being one
of the world's richest self-made women with an $8.3 billion real-estate empire
---
https://www.businessinsider.com/worlds-richest-self-made-woman-wu-yajun-net-worth-2019-2
Top 50 Billionaires in China ---
https://en.wikipedia.org/wiki/List_of_Chinese_by_net_worth
Jensen
Comment
The question for students to critically debate is why a
supposed communist country allows so many billionaires to rise up from poverty.
That's supposed to happen in the USA where a child growing up in deep
poverty (think Oprah Winfrey or Howard Shultz) became a multi-billionaires.
But is it also supposed to happen under communism? If
so, why?
Hint: Billionaires can afford risky investments and are the source
of much venture capital as long as they are not restrained by taxes and endless
regulations such as in the European Union. Also billionaires make choices that
may not be domestically popular. For example, Kamala Harris wants to tax the
billionaires to pay for a $25,000 raise for each and every teacher in the USA.
This is a worthy cause, but it could destroy billionaire efforts (think Bill
Gates and Warren Buffett) to eradicate polio and other diseases throughout the
entire world. . It also could greatly eliminate venture capital (think
worm toilets) that has become part and parcel to the economic engine of the USA.
**How to Mislead With Statistics
Rand Study of Medicare-for-All --- A Look at the Fine Print ---
https://www.rand.org/blog/2018/10/misconceptions-about-medicare-for-all.html
Misconception 1: Health care would be free
Care would
not
be free in a single-payer system—it would be paid for differently.
Instead of paying insurance premiums, people would pay taxes,
which would be
collected by a government agency
and used to pay for health care
on behalf of the population.
Some in higher tax brackets might pay more under a single-payer system than
under the current system, while others might pay less.
Many
single-payer proposals, including Sen.
Bernie Sanders' “Medicare for All” proposal,
cover a comprehensive range of services with no or very low co-pays and
deductibles. While common
in many proposals (PDF),
a single-payer system would not necessarily eliminate all out-of-pocket
expenses. In fact, the current Medicare program, which some consider a form
of single payer,
has deductibles and co-pays.
Misconception 2: Health care spending would dramatically increase (or
decrease).
A single-payer
system
could push health spending up or down,
or not have much effect. Spending could increase if a national single-payer
system expanded coverage to more people, leading to higher use of health
services. If the single-payer plan cuts deductibles and co-pays, currently
insured people would also
use more services.
But a single-payer system might also
reduce or eliminate administrative expenses,
such as insurer marketing, billing and claims processing, which would push
spending down. A single-payer plan could also cut spending by negotiating
lower prices with providers and drug companies.
Two recent
studies estimated that in a single-payer system, total spending could
decline by a few percentage points.
Share on Twitter
Two recent
studies, a national-level
analysis by the Mercatus Center
and
RAND's analysis
of a single-payer proposal for New York state, estimated that total spending
could decline by a few percentage points. Regardless of whether total
spending goes up or down, federal spending would almost surely increase,
because the government would be responsible for paying the bills.
Misconception 3: People with employer insurance would have fewer benefits
covered.
If the United
States adopted a single-payer plan, employer-sponsored insurance would
become less relevant because people would have an alternative source of
coverage. As a result, many
employers would drop health insurance coverage (PDF).
However,
workers would not lose access to insurance—they would have coverage through
the single-payer plan. Many single-payer plans, including Sanders' “Medicare
for All” proposal, cover more than most current employer insurance plans,
which have an
average deductible of $1,573
for single coverage.
Some
single-payer proposals
explicitly prohibit employers and private insurers
from offering health insurance coverage, to avoid a two-tiered system in
which wealthier people have access to more services and providers. Other
proposals would allow private insurance to offer
coverage for services not included in the single-payer plan
(such as elective surgeries), or to provide faster or improved services for
those who wish to supplement their benefits.
For example,
in Australia (and Germany), all
residents are eligible for
basic health services
provided through a single payer, but those with higher income are encouraged
to buy additional, private coverage that provides access to
private providers and hospitals.
Misconception 4: Doctors would become government employees.
None of the
leading Medicare for All proposals require that doctors and other health
care professionals become government employees, as is the case in the
United Kingdom's National Health Service.
Under Sanders' Medicare for All proposal,
private practices and hospitals
would continue to operate independently. Other single-payer proposals
require hospitals to
convert to nonprofit status (PDF),
but could remain privately run.
Misconception 4: People would lose access to their doctors.
Enrollees
generally would be able to choose among providers participating in the
program, and—if all providers participated—there would be no need to worry
about out-of-network charges. However, changes in payment rates under a
single-payer system could affect
doctors' willingness to supply services,
and could make it more difficult to get appointments.
We see this
effect in our current system—in 2015, only
45 percent of primary care physicians
accepted Medicaid patients,
due in part to Medicaid's relatively low payment rates. In contrast, 72
percent of primary care physicians accepted new Medicare patients and 80
percent accepted new commercial patients.
Even if overall provider payment levels were reduced, payments to each
individual provider would depend on their existing mix of patients. Payment
might go up for some providers, such as those who see Medicaid patients, and
could be about the same for those who see Medicare patients.
Jodi L. Liu is
an associate policy researcher at the nonprofit, nonpartisan RAND
Corporation. Christine Eibner is the Paul O'Neill-Alcoa chair in policy
analysis at RAND and a professor at the Pardee RAND Graduate School.
This
commentary originally appeared on USA Today on October 26, 2018.
Commentary gives RAND researchers a platform to convey insights based on
their professional expertise and often on their peer-reviewed research and
analysis.
Jensen Comment
Many (most?) people in the USA are not aware that current Medicare and Medicaid
government insurance claims are processed in the private sector rather than by
government agencies. This is important, since there will be an enormous cost for
a new government bureaucracy in the USA to be formed to process medical
insurance claims if the government does not outsource Medicare-for-All claims
processing. I don't think researchers to date have confronted the issue of the
huge startup cost of having the government process Medicare-for-All claims.
There also is the issue of the many places in the USA where medical care is
substandard due to lack of physicians and hospitals and other providers.
Everybody keeps saying the government will not have to build hospitals in these
places and provide a sufficient number of providers to run these hospitals.
Don't count on that when the lawyers start suing over unequal quality of medical
care across the USA. Eventually the Federal government will have to finance new
hospitals and provide health care providers in those hospitals.
Many (most?) people in the USA are not aware that they might lose their
employer-provided medical insurance under Medicare-for-All insurance. Medical
insurance would no longer be a fringe benefit provided by employers.
Medicare patients currently must pay 20% of their medical bills or pay for
supplemental private insurance to pay part of this 20%. Costs of such
supplemental insurance vary with the degree of coverage desired. For Erika and
me the supplemental insurance is over $1,200 per month for our premium
supplemental plans plus we have to pay over $200 per month for our Medicare
Insurance itself. Even though we were taxed for Medicare since 1965 until we
retired at 65 years of age, Medicare is not free in our retirement years. Most
people in the USA think that Medicare coverage is free after retirement.
That is a serious misconception.
Of course there are variations of the Medicare-for-All plan. 2020
Presidential Candidate
Kamela
Harris proposed eliminating all private medical insurance contracts and then
quickly reversed herself when learning how many of the 177 million insured
people in the USA were happy with their private sector insurance companies. She
then proposed that public sector insurance contracts only be made available as
an option in competition with private sector plans that
often give more choices in choosing doctors and hospitals.
Physicians and hospitals do not have to
accept Medicare Patients, Medicaid patients, Obamacare patients, or any patients
wanting to pay with insurance. Medicaid and Obamacare patients are likely to
have a tougher time finding physicians and hospitals than Medicare patients due
primarily to severe fee restrictions on for Medicaid and Obamacare patients.
Many hospitals complain that they lose money for every Medicaid patient and
Obamacare patient.
Major Chicago Hospitals Not In 2017 Obamacare
Marketplace Plans ---
https://www.wbez.org/shows/wbez-news/major-chicago-hospitals-not-in-2017-obamacare-marketplace-plans/f55d6c23-d9b1-452f-8c75-73635bd83d07
Some of Chicago’s largest hospitals said they will not be part of any Cook
County Affordable Care Act marketplace plans in 2017.
University of Chicago Medical Center and Rush University Medical Center both
said they don’t plan to be in network for any Obamacare marketplace plans
next year.
The change means patients with doctors at those hospitals will either need
to find a plan off the marketplace, and lose Obamacare subsides, or find a
new doctor.
Northwestern Memorial Hospital said it will also be out of the marketplace,
but will have exceptions for some of its partner hospitals.
Continued in article
Personally, I think Medicare-for-All will significantly increase what is paid
for medical services in the USA. Primarily this is because there is a $2+
trillion underground economy where workers are paid unreported cash for services
that are not subjected to payroll taxes or income taxes. Much of this is for
part-time work (think house cleaners and unregistered day care providers)
although there are many full-time workers whose services are not reported to the
government. I lived in San Antonio for 24 years where there are various street
corners where employers meet with workers taken to jobs day-after-day such as
roofing jobs, construction jobs, landscaping jobs, etc. Such workers save
(illegally) on paying income and payroll taxes but also
receive no benefits such as medical insurance, unemployment insurance, and
Social Security contributions. This begs the question of why law
enforcement does not move in to end this enormous illegal practice. The
suspected reason is that closing it down those street corner opportunities will
hurt millions of families with children across the USA who are vitally dependent
upon such cash-payment jobs. Many of those workers, certainly not all, are
undocumented immigrants who find it harder to find traditional jobs with
benefits or expose themselves to ICE deportations.
Presumably millions of workers in the $2+ trillion underground economy who do
not presently have health insurance would be covered under Medicare-for-All.
Unreliable stimates of the undocumented immigrants in the USA are reported to be
around 11 million, but realistic estimates run much higher than that. Certainly
many undocumented workers do not depend upon the underground economy for jobs,
but a huge proportion rely upon that underground economy.
What is not clear is whether physicians and hospitals could refuse
Medicare-for-All patients. Health care providers are allowed pick and choose
what insurance they will accept at the moment, and many refuse Medicaid and
Obamacare patients. When we lived in San Antonio we had
an outstanding dermatologist that did not accept any insurance plans.
Patients paid their own bills and then were on their own when appealing for
reimbursements from their insurance plans.
What nobody, including the Rand study above, seems to want to discuss is the
wide range of cost possibilities for Medicare-for-All coverage. For example, the
800-lb gorilla lurking in the shadows is the cost of long-term-nursing care.
Currently Medicare does not cover long-term nursing care claims. Medicaid does
cover long-term nursing care but severely limits what will be paid for each day
of care. As a result many Medicaid patients must accept
pretty lousy nursing homes or pretty lousy home-care providers. Medicare-for-All
costs will explode exponentially if long-term care is provided in quality
nursing homes. Presently long-term nursing care insurance plans are
very expensive luxuries.
One of the big worries is the magnetic attraction Medicare-for-All will have
on very expensive long-term treatment patients. For example, one can imagine the
many dialysis patients around the world who will seek to cross the USA borders
just for free free kidney dialysis treatments for the rest of their lives. One
can imagine all the people in the world who cannot get organ transplants or
brain surgeries without crossing into the USA.
Howard Schultz
One interesting political event of the times is the interview with
multibillionaire Howard Schultz on CBS Sixty minutes ---
https://www.cbs.com/shows/60_minutes/video/MD3ISxVkJXgLBsH4lNDrLYsRQWmCJy_X/howard-schultz-small-satellites-big-data-jerry-and-marge-selbee/
Schultz (think Starbucks) was always viewed as a liberal
Democrat. But now he's scaring Democrats by threatening to use his billions to
run for President as an independent. One of the major
reasons he gave for possibly running is the math of Medicare-for-All. He views
Medicare-for-All as an economic disaster for the USA along with other
wild spending schemes now contemplated by Maxine Waters like trillions for
reparations for blacks and native Americans, free college education for all,
massive spending on subsidized housing, zero-carbon regulations, open borders,
etc. etc.
All these are good causes, but those politicians
advocating those causes understand the math the least.
A Federal Shutdown Is an Annoyance (that can
be solved) — Interest on $22 Trillion in Debt Is a Problem (that cannot be
solved) ---
https://www.cato.org/publications/commentary/federal-shutdown-annoyance-interest-22-trillion-debt-problem
The U.S. Treasury is set to borrow $1 trillion
for a second year to finance the government's unprecedented budget deficit ---
https://www.bloomberg.com/news/articles/2019-01-28/another-year-another-1-trillion-in-new-debt-for-u-s-to-raise?cmpid=BBD012819_BIZ&utm_medium=email&utm_source=newsletter&utm_term=190128&utm_campaign=bloombergdaily
FiveThirtyEight Blog: The Young Left’s
Anti-Capitalist Manifesto: Its goal is to remake our economic system — and the
Democratic Party ---
https://fivethirtyeight.com/features/the-young-lefts-anti-capitalist-manifesto/
In my opinion, Schultz does not want to run for President.
He just wants to scare the Democratic Party to come to its senses on the math.
I think he Shultz will threaten to run until the
Democratic platform becomes more math sensible.
The bottom line is that the USA needs some taxpayer funded medical coverage
across the USA. The worry is that, like climate change proposals, that we will
become committed to programs that end up being self-defeating. It's like the
family that keeps borrowing and borrowing for the big house, expensive cars,
luxury cruises, etc. etc. until the day comes when they find themselves in
bankruptcy court.
Modern
Monetary Theory (MMT) ---
https://en.wikipedia.org/wiki/Modern_Monetary_Theory
How to
Mislead with MMT Theory
Alexandria Ocasio-Cortez is a fan of a geeky economic theory called MMT:
Here's a plain-English guide to what it is and why it's interesting and can
bring down national economies (think Zambia and Venezuela) ---
https://www.businessinsider.com/modern-monetary-theory-mmt-explained-aoc-2019-3
Jensen Comment
There are huge problems with simply printing money to pay off government debt
and fund government programs ---
Firstly and foremost it leads to expensive entitlements that are
virtually impossible to roll back such as national healthcare, guaranteed
(basic) income for everybody, reparations for minorities, giving a $25,000
annual raise to every teacher, etc
Secondly, virtually all Democratic candidates for the 2020 presidency are
all in a race to see who can spend the most on social programs. Virtually
none are intent of spending restraints and saving the economic engine that
brought the USA to greatness. This leads to "self dealing" that brought down
the German Economy after World War 1 and more recently Zimbabwe and
Venezuela ---
https://en.wikipedia.org/wiki/Hyperinflation_in_Zimbabwe
Thirdly, it leads to fear and distrust of investors of the world who no
longer trust holding any investments in a MMT nation.
This could be a disaster for the USA economy and the
engine that drives the USA economy.
MMT is opposed by both conservative and liberal (progressive) academic
economists around the world ---
https://en.wikipedia.org/wiki/Modern_Monetary_Theory#Criticisms
Functional Finance ---
https://en.wikipedia.org/wiki/Functional_finance
**How to Mislead With Economics
Printing Money: What’s Wrong With Abba Lerner's Functional Finance?
---
https://www.nytimes.com/2019/02/12/opinion/whats-wrong-with-functional-finance-wonkish.html
This article may not be free much longer
Jensen Comment
Abba Lerner had in mind printing money to create money. Most nations do not
create money in this manner. For example, the USA Treasury printed the
greenbacks in your wallet. But the USA Treasury as a rule does not create money
in the USA money supply. Commercial banks create money in the money supply.
Suppose you go to the bank to get a $10,000 loan for a new swimming pool. When
the bank credits your checking account for $10,000 the bank has created money.
You can spend that money without ever converting it into greenbacks. You can
simply write checks to the people who build your pool. Those people can in turn
deposit your checks into their accounts and spend it without ever converting
that $10,000 into greenbacks. But suppose the company that built your pool
needed $100 in petty cash. That company could've converted $100 its checking
account into $100 in greenbacks. In economics we say that the company simply has
made a $100 liquidity preference decision.
My point is that the USA Treasury prints money to satisfy liquidity
preferences regarding money that was created previously by commercial banks.
But commercial banks cannot go wild like Zimbabwe when creating money ---
https://en.wikipedia.org/wiki/Money_supply
Quantitative easing is a controversial exception that I won't go into here
---
https://en.wikipedia.org/wiki/Quantitative_easing
Abba Lerner's theoretical "Functional Finance" is an entirely different way
of creating money and a very risky way for governments to create money ---
https://en.wikipedia.org/wiki/Functional_finance
7**How to Mislead With Statistics
Alexandria Ocasio-Cortez says that $3 billion in tax credits should be given
to Queens NYC residents, not Amazon — and a new poll shows that nearly half of
Americans agree ---
https://www.businessinsider.com/poll-most-dont-support-amazon-hq2-style-deal-2019-2
Jensen Comment
For argument's sake suppose that there are 2.5 million Queens residents give or
take. I don't know how many of those residents file NY tax returns, but for
argument sake suppose that 2 million residents will file NY tax returns. This is
a high estimate since some people who do not currently file tax returns
(including children) might file for the tax credit if it exceeds the value of
being exemptions on their parents' returns.
It's not clear how long the $3 billion would benefit Amazon, but a number
thrown out is 25 years ---
https://ny.curbed.com/2018/11/16/18098589/amazon-hq2-nyc-queens-long-island-city-explained
Dividing $3 billion by 25 years averages out to $120 million per year.
Dividing $120 million by 2 million tax filers works out to be $60 per person per
year. Oops that's probably not enough for some children to give up their value
of being exemptions on their parents' tax returns. So let's divide $120 million
by 1 million taxpayers to get $120 per year. How wonderful for Queens!
Yeah Right!
Will $120 per year tax credit for each Queens taxpayer have the same impact
as the Amazon deal will have on Queens?
https://ny.curbed.com/2018/11/16/18098589/amazon-hq2-nyc-queens-long-island-city-explained
According to the state, Amazon will generate $27.5
billion in state and city revenue over 25 years, a 9:1 ratio of revenue to
subsidies—an arrangement Cuomo called “the highest rate of return for an
economic incentive program the state has ever offered.”
Even if we complicate the analysis with time value of money
Alexandria's
proposal is what I call Democratic Socialist economics.
She never would've allowed Silicon Valley to be developed.
NY State Budget Director on Amazon ---
https://marginalrevolution.com/marginalrevolution/2019/02/ny-state-budget-director-on-amazon.html
The
open letter on Amazon
from Robert Mujica, New York State’s Budget Director,
is on fire. It shines an unflattering light on many people involved in the
Amazon decision but it’s analysis of twitter mobs goes well beyond Amazon.
In my 23 years in the State
Capitol, three as Budget Director, Amazon was the single greatest economic
development opportunity we have had. Amazon chose New York and Virginia
after a year-long national competition with 234 cities and states vying for
the 25,000-40,000 jobs. For a sense of scale, the next largest economic
development project the state has completed was for approximately 1,000
jobs. People have been asking me for the past week what killed the Amazon
deal. There were several factors.
First, some labor unions
attempted to exploit Amazon’s New York entry. The RWDSU Union was interested
in organizing the Whole Foods grocery store workers, a subsidiary owned by
Amazon, and they deployed several ‘community based organizations’ (which
RWDSU funds) to oppose the Amazon transaction as negotiation leverage. It
backfired.
…Organizing Amazon, or Whole
Foods workers, or any company for that matter, is better pursued by allowing
them to locate here and then making an effort to unionize the workers,
rather than making unionization a bar to entrance. If New York only allows
unionized companies to enter, our economy is unsustainable, and if one union
becomes the enemy of other unions, the entire union movement – already in
decline – is undermined and damaged.
Second, some Queens
politicians catered to minor, but vocal local political forces in opposition
to the Amazon government incentives as ‘corporate welfare.’ Ironically, much
of the visible ‘local’ opposition, which was happy to appear at press
conferences and protest at City Council hearings during work hours, were
actual organizers paid by one union: RWDSU. (If you are wondering if that is
even legal, probably not). Even more ironic is these same elected officials
all signed a letter of support for Amazon at the Long Island City location
and in support of the application. They were all for it before Twitter
convinced them to be against it.
…Furthermore, opposing
Amazon was not even good politics, as the politicians have learned since
Amazon pulled out. They are like the dog that caught the car. They are now
desperately and incredibly trying to explain their actions. They cannot.
…Third, in retrospect, the
State and the City could have done more to communicate the facts of the
project and more aggressively correct the distortions. We assumed the
benefits to be evident: 25,000-40,000 jobs located in a part of Queens that
has not seen any significant commercial development in decades and a giant
step forward in the tech sector, further diversifying our economy away from
Wall Street and Real Estate. The polls showing seventy percent of New
Yorkers supported Amazon provided false comfort that the political process
would act responsibly and on behalf of all of their constituents, not just
the vocal minority. We underestimated the effect of the opposition’s
distortions and overestimated the intelligence and integrity of local
elected officials.
Incredibly, I have heard city and state elected officials who were opponents
of the project claim that Amazon was getting $3 billion in government
subsidies that could have been better spent on housing or transportation.
This is either a blatant untruth or fundamental ignorance of basic math by a
group of elected officials. The city and state ‘gave’ Amazon nothing. Amazon
was to build their headquarters with union jobs and pay the city and state
$27 billion in revenues. The city, through existing as-of-right tax credits,
and the state through Excelsior Tax credits – a program approved by the same
legislators railing against it – would provide up to $3 billion in tax
relief, IF Amazon created the 25,000-40,000 jobs and thus generated $27
billion in revenue. You don’t need to be the State’s Budget Director to know
that a nine to one return on your investment is a winner.
The seventy percent of New
Yorkers who supported Amazon and now vent their anger also bear
responsibility and must learn that the silent majority should not be silent
because they can lose to the vocalminority and self-interested politicians.
…Make no mistake, at the end
of the day we lost $27 billion, 25,000-40,000 jobs and a blow to our
reputation of being ‘open for business.’ The union that opposed the project
gained nothing and cost other union members 11,000 good, high-paying jobs.
The local politicians that catered to the hyper-political opposition hurt
their own government colleagues and the economic interest of every
constituent in their district. The true local residents who actually
supported the project and its benefits for their community are badly hurt.
Nothing was gained and much was lost. This should never happen again.
Even if you
think the end result was fine, as I do, this was a political fiasco for New
York. Amazon was wise to exit when they did because the pecking of the
chickens would only have intensified as they sunk investments.
Alexandria the Economist: Bill de Blasio: Alexandria Didn't
Understand Amazon Deal...at All ---
https://townhall.com/tipsheet/leahbarkoukis/2019/02/18/bill-de-blasio-aoc-didnt-understand-amazon-dealat-all-n2541634?utm_source=thdailypm&utm_medium=email&utm_campaign=nl_pm&newsletterad=&bcid=b16c6f948f297f77432f990d4411617f&recip=17935167
New York
City Mayor Bill de Blasio suggested Sunday that Democratic Rep. Alexandria
Ocasio-Cortez (NY) had no idea what she was talking about when arguing that
Amazon pulling out of its deal to build a new office complex in Long Island
City would’ve freed up money to fix the subway system and hire more
teachers.
In an
interview with NBC’s Chuck Todd, the host said the tax breaks offered to
Amazon weren’t “money you had over here. And it was going over there.”
“Correct,”
de Blasio replied. “And that $3 billion that would go back in tax incentives
was only after we were getting the jobs and getting the revenue.”
To clarify,
Todd said, “There not $3 billion in money…”
“There’s no
money—right,” de Blasio said.
Todd played a clip of Ocasio-Cortez’s reaction to the news Amazon was
backing out of its deal to build the complex. Continued in article
Alexandria the Politician: Amazon winners and losers ---
https://marginalrevolution.com/marginalrevolution/2019/02/amazon-winners-and-losers.html
Jensen Comment
Alexandria is a big winner in Amazon's surrender, because
this way she keeps her low-income voter support that might've been diluted by
higher wage earners
It logically follows since so many poor and middle class people were driven
out of their homes in East Palo Alto, San Jose, and surrounding communities that
Silicon Valley should never have been allowed to happen since it raised real
estate prices so dramatically. Innovation and technology and jobs are just not
that important. Is that the way you think Alexandria?
The Young Left’s
Anti-Capitalist Manifesto: Its goal is to remake our economic system — and the
Democratic Party ---
https://fivethirtyeight.com/features/the-young-lefts-anti-capitalist-manifesto/
**How
to Mislead With Statistics
Inequality is higher in some states like New York
and Louisiana because of corporate welfare (financial incentives to invest in
and create jobs)
https://theconversation.com/inequality-is-higher-in-some-states-like-new-york-and-louisiana-because-of-corporate-welfare-126406
Jensen Comment
This article provides teachers with an illustration of flawed and biased
statistical analysis. Inequality variation among the 50 USA states, like cancer,
is horribly complicated with many complex and interactive causes. The title
alone is a warning: "Inequality in New York and Louisiana is higher
because of corporate welfare (incentives given to
corporations to invest in new jobs).
I begin with a warning about cancer:
How to Interpret News About Cancer Causes ---
https://www.cancer.org/cancer/cancer-causes/general-info/does-this-cause-cancer.html
It's quite easy to assume simplistic cancer causes
analogous to simplistic attributions of poverty causes or inequality causes.
First I stress than inequality in and of
itself is not a bad thing.
Exploring Wealth Inequality: Poverty Matters, Not Wealth Inequality ---
https://www.cato.org/publications/policy-analysis/exploring-wealth-inequality
Second I stress that "corporate welfare itself" as
defined in this study leaves out a lot of stuff that can cause inequality and
poverty. A wonderful example is the following quotation from the above article
"But the amount of
incentives states offer can vary significantly. For example, New Hampshire
spent just $9.9 million on incentives, or
75 cents for every state resident, per
year from 1999 to 2014, while Louisiana paid out an average of $1.2 billion
a year, or $267 per capita.
I absolutely know that New Hampshire really spent
more than 75 cents for every state resident on corporate incentives. Firstly,
New Hampshire has no state income tax or sales tax. That's why Walmart spends
tens of millions of dollars building super stores just inside the borders of New
Hampshire. For example, Walmart built a relatively new enormous super store in
New Hampshire's rural Woodsville (population 1,176). Walmart did not locate in
Woodsville because of any financial incentives offered by Woodsville or the
State of New Hampshire. Walmart invested millions in
the Woodsville store because Woodsville sits on the Connecticut River border
between New Hampshire and Vermont. Vermont citizens (and Canadians)
stream across the bridge into Woodsville for two reasons: One is cheaper
prices at Walmart, and two is avoidance of the Vermont sales tax. The above
study leaves out the "corporate welfare" of not having a state sales tax like
all the states surrounding New Hampshire. Walmart isn't about to build a store
in the high tax state of Vermont.
Not having a sales tax costs the state of New
Hampshire more than "75 cents" per capita. But a gain to New Hampshire
arises from the jobs that Walmart stores create regionally in relatively rural
towns that would otherwise have much higher rates of unemployment.
By the way, the NH Walmart stores are so popular
with out-of-state residents (and Canadians) that new hotels are often built
across from the Walmart stores in New Hampshire. Exhibit A is the large Hampton
Inn that was built directly across the street from the Littleton, NH Walmart
store. I cannot think of any other attraction to stay in this particular hotel
other than the attraction for out-of-state shoppers to get Walmart prices and no
sales taxes. Walmart invests zero for new stores in the high tax state of
Vermont. Many of the cars in the Hampton Inn parking lot are pulling trailers
for Walmart shopping.
But my main objection with the above article is how
inconsistent the conclusions are with the data that was used in the study. The
author obviously has a political bias that is stretched to the limit. The first
bias is in the unmentioned limitations of the Gini Coefficient upon which the
entire analysis is based. Read the following at
https://en.wikipedia.org/wiki/Gini_coefficient#Limitations
The Gini coefficient is a
relative measure. Its proper use and interpretation is controversial. It is
possible for the Gini coefficient of a developing country to rise (due to
increasing inequality of income) while the number of people in absolute
poverty decreases. This is because the Gini coefficient measures relative,
not absolute, wealth. Changing income inequality, measured by Gini
coefficients, can be due to structural changes in a society such as growing
population (baby booms, aging populations, increased divorce rates, extended
family households splitting into nuclear families, emigration, immigration)
and income mobility. Gini coefficients are simple, and this simplicity can
lead to oversights and can confuse the comparison of different populations;
for example, while both Bangladesh (per capita income of $1,693) and the
Netherlands (per capita income of $42,183) had an income Gini coefficient of
0.31 in 2010, the quality of life, economic opportunity and absolute income
in these countries are very different, i.e. countries may have identical
Gini coefficients, but differ greatly in wealth. Basic necessities may be
available to all in a developed economy, while in an undeveloped economy
with the same Gini coefficient, basic necessities may be unavailable to most
or unequally available, due to lower absolute wealth.
Different income
distributions with the same Gini coefficient
(think California, Mississippi, New Mexico, and Louisiana all having about
the same Gini Coefficient for vastly different reasons)
Even when the total income of a population is
the same, in certain situations two countries with different income
distributions can have the same Gini index (e.g. cases when income Lorenz
Curves cross). Table A illustrates one such situation. Both countries have a
Gini coefficient of 0.2, but the average income distributions for household
groups are different. As another example, in a population where the lowest
50% of individuals have no income and the other 50% have equal income, the
Gini coefficient is 0.5; whereas for another population where the lowest 75%
of people have 25% of income and the top 25% have 75% of the income, the
Gini index is also 0.5. Economies with similar incomes and Gini coefficients
can have very different income distributions. Bellù and Liberati claim that
to rank income inequality between two different populations based on their
Gini indices is sometimes not possible, or misleading.
Extreme wealth
inequality, yet low income Gini coefficient
(think of New York City versus Woodsville, NH)
A Gini index does not
contain information about absolute national or personal incomes. Populations
can have very low income Gini indices, yet simultaneously very high wealth
Gini index. By measuring inequality in income, the Gini ignores the
differential efficiency of use of household income. By ignoring wealth
(except as it contributes to income) the Gini can create the appearance of
inequality when the people compared are at different stages in their life.
Wealthy countries such as Sweden can show a low Gini coefficient for
disposable income of 0.31 thereby appearing equal, yet have very high Gini
coefficient for wealth of 0.79 to 0.86 thereby suggesting an extremely
unequal wealth distribution in its society. These factors are not assessed
in income-based Gini.
Small sample bias
(think of New Hampshire versus New York state)
– sparsely populated regions more likely
to have low Gini coefficient
Gini index has a downward-bias for small
populations. Counties or states or countries with small populations and less
diverse economies will tend to report small Gini coefficients. For
economically diverse large population groups, a much higher coefficient is
expected than for each of its regions. Taking world economy as one, and
income distribution for all human beings, for example, different scholars
estimate global Gini index to range between 0.61 and 0.68.
As with other inequality coefficients, the Gini coefficient is influenced by
the
granularity
of the measurements. For example, five 20% quantiles (low granularity) will
usually yield a lower Gini coefficient than twenty 5% quantiles (high
granularity) for the same distribution. Philippe Monfort has shown that
using inconsistent or unspecified granularity limits the usefulness of Gini
coefficient measurements.
The Gini coefficient measure gives different
results when applied to individuals instead of households, for the same
economy and same income distributions. If household data is used, the
measured value of income Gini depends on how the household is defined. When
different populations are not measured with consistent definitions,
comparison is not meaningful.
Deininger and Squire (1996) show that income
Gini coefficient based on individual income, rather than household income,
are different. For example, for the United States, they find that the
individual income-based Gini index was 0.35, while for France it was 0.43.
According to their individual focused method, in the 108 countries they
studied, South Africa had the world's highest Gini coefficient at 0.62,
Malaysia had Asia's highest Gini coefficient at 0.5, Brazil the highest at
0.57 in Latin America and Caribbean region, and Turkey the highest at 0.5 in
OECD countries.
Inability to value benefits and
income from
informal economy
affects Gini coefficient accuracy
(New York City is full of welfare benefits whereas there are relatively none
in Woodsville, NH)
Some countries distribute benefits that are
difficult to value. Countries that provide subsidized housing, medical care,
education or other such services are difficult to value objectively, as it
depends on quality and extent of the benefit. In absence of free markets,
valuing these income transfers as household income is subjective. theoretical model of Gini coefficient is limited to accepting correct or
incorrect subjective assumptions.
In subsistence-driven and informal economies, people may have significant
income in other forms than money, for example through
subsistence farming
or
bartering.
These income tend to accrue to the segment of population that is
below-poverty line or very poor, in emerging and transitional economy
countries such as those in sub-Saharan Africa, Latin America, Asia and
Eastern Europe. Informal economy accounts for over half of global employment
and as much as 90 per cent of employment in some of the poorer sub-Saharan
countries with high official Gini inequality coefficients. Schneider et al.,
in their 2010 study of 162 countries,
report about 31.2%, or about $20 trillion, of world's
GDP
is informal. In developing countries, the informal economy predominates for
all income brackets except for the richer, urban upper income bracket
populations. Even in developed economies, between 8% (United States) to 27%
(Italy) of each nation's GDP is informal, and resulting informal income
predominates as a livelihood activity for those in the lowest income
brackets.
The value and distribution of the incomes from informal or underground
economy is difficult to quantify, making true income Gini coefficients
estimates difficult. Different assumptions and quantifications of these
incomes will yield different Gini coefficients.
Gini has some mathematical limitations as well.
It is not additive and different sets of people cannot be averaged to obtain
the Gini coefficient of all the people in the sets.
Continued in article
I could go on and on and on about how really bad is the analysis
that concludes:
"Inequality is higher in some states like New York and Louisiana
because of corporate welfare" (incentives to
business firms to invest in facilities and create jobs).
Rep. AOC (Alexandria) naively fought against having the second Amazon
headquarters, warehouses, and jobs in NYC. The leftist Governor Cuomo and Mayor
de Blasio were furious with her for good reason ---
Bill de Blasio corrects Ocasio-Cortez's claim about spending
Amazon tax break money ---
https://www.foxnews.com/politics/de-blasio-ocasio-cortex-claim-spending-amazon-tax-break-money
Will $120 per year tax credit for each Queens taxpayer have the same impact
as the Amazon deal will have on Queens?
https://ny.curbed.com/2018/11/16/18098589/amazon-hq2-nyc-queens-long-island-city-explained
According to the state, Amazon will generate $27.5
billion in state and city revenue over 25 years, a 9:1 ratio of revenue to
subsidies—an arrangement Cuomo called
“the highest rate of return for an economic incentive program the state has
ever offered.”
Even if we complicate the analysis with time value of money
Alexandria's
proposal is what I call Democratic Socialist economics.
She never would've allowed Silicon Valley to be developed.
**How to Mislead With Statistics
This Presidential Candidate Wants to Give Every Adult $1,000 a Month (costing
over $3 trillion per year) ---
Click Here
. . .
Yang’s plan is a bit different, however. He intends
to pay for it with a value-added tax, a consumption tax levied on goods at
each stage of their production. “The big trap that America is in right now
is that as artificial intelligence and autonomous cars and trucks take off,
we’re going to see more and more work disappear and we’re not going to have
new revenue to account for it,” he said. “The big winners are going to be
the biggest tech companies like Amazon and Google and Facebook who are great
at not paying a lot of taxes. So the way we pay for a universal basic income
is by passing a value added tax which would get the American public a slice
of every Amazon transaction and Google search.”
Jensen Comment
This is a typical politician's ploy of trying to make you believe big companies
like Amazon and Walmart would pay the $3 trillion tax. But big companies don't
pay sales taxes (which is what this VAT really amounts to). Big companies
collect sales taxes from customers. To collect over $3 trillion per year
those same people getting the $1,000 per month would be paying for it
themselves. It would mostly be a wash. Old folks would benefit most
because they buy fewer retail goods than younger families.
Since I'm retired I decided that I'm going to vote for Andrew Yang in 2020 to
become our next President of the USA. Bring on my added $1,000 per month.
Alas to add pain to the sales tax, the IRS would probably tax the $1,000 per
month like it taxes Social Security benefits. Ignorant people don't realize that
when they retire they must pay income taxes on their Social Security benefits.
NYC's first-ever Neiman Marcus just opened in Hudson Yards ---
https://www.businessinsider.com/neiman-marcus-hudson-yards-new-york-city-location-photos-2019-3
Hudson Yards (the most expensive (taxpayer subsidized) private real estate
development in the USA) ---
https://www.hudsonyardsnewyork.com/
Jensen Comment
AOC (Alexandria) was the
"top villain" who quashed the $3 billion tax subsidy for Amazon in NYC.
Please tell her that the opulent Hudson Yards in Manhattan and its condos
costing multi millions got a $6 billion deal from NYC ---
Click Here
The homeless will not find shelter in Hudson Yards. But
CNN is locating in a fabulous part of Hudson Yards.
If you want to frustrate the 1% put gaudy suits/dresses on
some of the most foul-smelling and ugly homeless people on the streets and lead
them to the most expensive Hudson Yard restaurants. Give your guests the most
expensive meals and wines. Those evenings out will be nutritional for hungry
homeless who might enjoy dining out alongside Wall Street's billionaires. A
sing-along at your table might be nice as well.
**How to Mislead With Popular Vote Statistics (incomplete analysis, bias) ---
http://townhall.com/columnists/derekhunter/2016/12/04/the-unpopular-truth-about-the-popular-vote-n2254534?utm_source=thdaily&utm_medium=email&utm_campaign=nl&newsletterad=
. . .
The Nation magazine
put it this way, “The
preliminary count had Democratic Senate candidates gathering 46.2 million
votes to 39.3 million for Republican candidates.” That and $2.50 will get
you a cup of coffee from the aforementioned unshowered, probably with
earlobes stretched to the size of Frisbees and an impromptu lecture on the
“justice” of fair trade coffee beans.
But it’s a fraud.
Those numbers aren’t a
lie, per se, but how the left is using them is, just like how it is using
the presidential popular vote.
In California now, all
candidates run in the same primary, and the top two vote-getters advance to
the runoff unless one receives more than 50 percent of the vote. Thanks to
total Democratic Party control, both candidates for the open Senate seat
were Democrats. So Democrats got all the votes in California’s Senate race.
In fact, several
solidly Republican states or states Republicans stand a good chance of
winning didn’t have Senate elections in 2016.
When you choose the
unit of measure by which you determine success you will always come out
ahead. That’s what Democrats are doing here.
In this year’s World
Series, the Chicago Cubs won the title 4 games to 3. But both the Cubs and
Cleveland Indians scored 27 runs in the seven games. Applying the argument
liberals are using, there needs to be an eighth game, or at least more
innings added to game 7 with the winner being whichever team scores the next
run.
**How to Mislead With Statistics
Ole yust does not yet vant Lena to be da boss
Women CEOs are rare in Norway and Sweden even though these nations are
highest in terms of gender equality on other criteria
Chief Executive Officer (CEO) ---
http://en.wikipedia.org/wiki/Chief_executive_officer
. . .
In some European Union countries, there are
two separate boards,
one executive board for the day-to-day business and one supervisory board
for control purposes (selected by the shareholders). In these countries, the
CEO presides over the executive board and the chairman presides over the
supervisory board, and these two roles will always be held by different
people. This ensures a distinction between management by the executive board
and governance by the supervisory board. This allows for clear lines of
authority. The aim is to prevent a conflict of interest and too much power
being concentrated in the hands of one person.
Women on Board The Norwegian Experience (June 2010)
---
http://library.fes.de/pdf-files/id/ipa/07309.pdf
- Norway was the first country to introduce a quota
for women on company boards. Since its introduction in 2003, the number of
women on board has reached 40 per cent as required by law. �
- In several European countries, Germany being one
of them, a debate has begun on how to increase the number of women in
leading positions in business. The question of whether or not quota
legislation is needed to reach this goal is highly contested. �
- The Norwegian experience reveals that a quota is
the key to a successful implementation. Not only does it create the pressure
needed for fundamental change but it also triggers a public debate at the
core of which are questions of gender equality in wider society
Ole yust does not yet vant Lena to be da boss
(Norway is not in the 28-Member European
Union)
From the Harvard Business Review Blog on December 30, 2014
Norwegian Companies Morph to Avoid
Gender-Balance Law
One of the consequences of Norway’s law mandating
that at least 40% of the directors of public limited companies be female is
that numerous firms have switched their organizational form, sometimes at
significant cost, so that they are no longer public limited companies, say
Øyvind Bøhren and Siv Staubo of Norwegian Business School. Among the
companies in that category when the law was passed in 2003, 51% chose to
become private limited-liability firms by the time it became binding five
years later. However, Norway may further extend the board-representation
rule to other corporate forms.
SOURCE:
Does mandatory gender balance work? Changing organizational form to avoid
board upheaval
http://links.mkt3142.com/ctt?kn=14&ms=MTAyNjY5MjMS1&r=MTkyODM0MDg0MAS2&b=0&j=NDQyMzY1ODgzS0&mt=1&rt=0
Germany since passed quota (30% in 2016) legislation for
publically-traded companies but rejected similar quotas for private
corporations ---
http://www.spiegel.de/international/germany/cdu-and-spd-agree-on-gender-quota-in-german-boardrooms-a-934155.html
Jensen Comment
In the USA the CEO generally has enormous power is choosing the slate of
board members voted on by the shareholders. Also shareholders uninterested in
voting often give voting proxies to the CEO. Hence the election of board members
is not exactly an example of great democracy in action. For public relations
purposes and for purposes of competency, however, CEOs are increasingly
attempting to get women on corporate boards. Also corporate boards for sometimes
complicated reasons, including competency, are increasingly trying to appoint
women as CEOs.
Gender Equality ---
http://en.wikipedia.org/wiki/Gender_equality
Global Gender Gap Report (2013) ---
http://en.wikipedia.org/wiki/Global_Gender_Gap_Report
Gender Inequality Index ---
http://en.wikipedia.org/wiki/Gender_Inequality_Index
Note that this index is based on multiple criteria and is not a measure of
business executive power or executive compensation.
Female Labor Force in the Muslim World ---
http://en.wikipedia.org/wiki/Female_labor_force_in_the_Muslim_world
Bob Jensen's threads on gender issues ---
http://www.trinity.edu/rjensen/bookbob2.htm#Women
**How to Mislead With Statistics
"Women with MBAs face a gender-based pay divide that starts as soon as they
graduate, and plagues them throughout their careers," by Natalie Kitroeff
and Jonathan Rodkin, Bloomberg, October 20, 2015 ---
http://www.bloomberg.com/news/articles/2015-10-20/the-real-cost-of-an-mba-is-different-for-men-and-women?cmpid=BBWGP102115_BIZ
As far as investments go, business school is an
unimpeachable bet for young professionals who can muster $100,000. MBAs, who
are typically in their early 30s and have already spent a few years in the
workforce, saw their salaries triple within eight years of graduation. They
also report consistently high levels of job satisfaction and career growth,
according to a survey of thousands of alumni conducted by Bloomberg
Businessweek as part of the magazine’s annual ranking of business schools.
But that general contentment hides a troubling divide: Within a few years of
graduation, women with MBAs earn lower salaries, manage fewer people, and
are less pleased with their progress than men with the same degree.
Each year, we rank business schools by polling
students on topics such as academics, career services, and campus climate.
We also ask employers about skills they seek in MBA hires and which schools
best prepare their graduates. This year, for the first time, we surveyed
alumni who graduated six to eight years ago, asking them how well their
degrees had delivered on the promise of a fulfilling, well-paid job. The
12,773 responses we collected offer a wealth of salary information and other
data on MBAs working in a variety of industries.
The inclusion of the alumni responses helped propel
Harvard Business School to the top of the 2015 rankings. HBS alums reported
the largest gains in compensation and many attributed their success to their
alma mater. Last year’s No. 1, Duke Fuqua School of Business, slipped to
eighth overall, partly because of a comparatively lackluster job placement
rate of 86.1 percent, which is below the 87.9 percent rate overall.
Women and men start their post-MBA careers earning
almost the same money—$98,000 for women and $105,000 for men—according to
our survey of those who graduated from 2007 through 2009. But the gap then
widens sharply. By 2014 men hauled in a median of $175,000 and women,
$140,000. That means employers pay women 80 percent of what men with the
same degree take home.
Continued in article
Jensen Comment
I want to start out by saying that I believe there are differences in
compensation levels by gender. However, the article above, and virtually every
other related article I've ever encountered, does not probe very deep to uncover
possible reasons for the so-called gender salary gap. First I want to compliment
the authors for using medians rather than mean averages. This is the first thing
I look for because means can be skewed by outliers more easily than medians.
Let me begin by noting that what are outliers in smaller populations can also
be outliers in large populations but there are randomly more such outliers in
large populations. It was always surprising in the NBA when the Houston Rockets
imported
Yao Ming, a 7-foot 6 inch Chinese center. In both the USA and China Yao Ming
is an outlier in terms of height ---
https://en.wikipedia.org/wiki/Yao_Ming
In terms of population the USA has an estimated population of slightly
over 320 million people. China has an estimated 1,376 million people. People
over seven feet tall are outliers in both the USA and China. However, the odds
of having many more people over seven feet tall are much greater in China than
the USA due to the sheer difference in the populations of these two nations.
In a random sample of 320 female MBA graduates and a random sample of 1,376
male graduates one would expect that the mean and median salaries of the men
would be higher than the women due to random chance because there are many more
high-salaried outliers in the larger sample of males. Since the lower salaried
men and women are bounded by zero the means
and medians of the random samples are driven upward by the higher salaried men
and women. Suppose we designated a high salary as anything over $200,000. One
would expect more high salaried men than women in these two samples due to the
difference in the sample sizes.
It's the bottom part of the salary distribution where gender analysis becomes
more complicated. In a random world one would expect to find more zero-salaried
men than women in the above samples due to the sample size differences. However,
here is where the real world is not random because statistically female MBA
graduates in reality have a higher probability of not entering or soon dropping
out of the work force to devote full time or nearly full time to mothering their
new babies.
As a result statistical analysis showing higher mean or median salaries among
the 1,376 males is not probably as much due to hiring and promotion bias due to
gender as it is to such complications as having more male MBA graduates than
female graduates and the higher probability that a female will leave the
full-time work force at least during the early years of raising children.
Of course all of this becomes more complicated when the number of female
graduates becomes larger relative to male graduates. I think there are still
more male MBA graduates, but in terms of accounting graduates the number of
females now exceeds the number of male graduates. Also the large public
accounting firms are hiring more female than male graduates. Carried to extremes
suppose that we randomly sample 1,376 female accounting graduates and 321 male
accounting graduates. My hypothesis is that the mean and median salaries of the
females will exceed those of the males after five years of employment. Of course
these averages may differ for the entire populations of accounting graduates
because the gender differences among all accounting graduates is closer to 50/50
than 1,376/321.
There are other complications in this analysis. My opinion is that
newly-hired male and female graduates joining a given local office of a Big Four
firm will earn the same starting compensation. However, the new hires in the San
Francisco local office will have higher salaries than the San Antonio office of
a given firm based upon huge differences in costs of living in these two cities.
To do a complete gender analysis we would have to factor in whether there are
gender differences based upon cost of living in local offices. Do mothers tend
to prefer or avoid San Francisco vis-a-vis San Antonio? It's certainly more
complicated to both work full time and raise young children in San Francisco
where rents are now higher than anywhere in the USA. Hence one would expect
mothers to prefer San Antonio relative to San Francisco. One would expect more
females moving away from the San Francisco office once they became mothers.
My point is that one has to be very careful when it comes to inferring gender
bias causality in most any type of statistical analysis beyond the usual problem
of spurious correlation. I think most studies of gender differences in salaries
do not delve deeply enough into the really complicated factors affecting
statistical analysis outcomes.
But I do still believe there is gender bias against mothers of young children
in terms of employment and compensation. I'm not convinced there's such a degree
of bias against those women who are not mothers of young children.
Three of the Big Four multinational accounting firms are
among the very top companies of the world for working moms at Ranks 4/100,
5/100, 8/100
And all four are in the 15-year Hall of Fame for working moms
---
https://www.workingmother.com/working-mother-100-best-companies-winners-2019
The Big Four firms are among the very best companies to work for in
general at Ranks 26/100, 34/100, 36/100, and 44/100
---
https://fortune.com/best-companies/
Bob Jensen's threads on careers ---
http://www.trinity.edu/rjensen/Bookbob1.htm#careers
Bob Jensen's threads on the histories of women in the professions ---
http://www.trinity.edu/rjensen/Bookbob2.htm#Women
**How to mislead with
statistics (definition of universal free education)
Tertiary education ---
http://en.wikipedia.org/wiki/Tertiary_education
Tertiary education, also referred to as third stage, third
level, and post-secondary education, is the educational level
following the completion of a school providing a
secondary education. The
World
Bank, for example, defines tertiary education as including universities
as well as institutions that teach specific capacities of higher learning
such as colleges, technical training institutes, community colleges, nursing
schools, research laboratories, centers of excellence, and distance learning
centers.[1]
Higher education is taken to include
undergraduate and
postgraduate education, while
vocational education and training beyond secondary education is known as
further education in the
United Kingdom, or
continuing education in the
United States.
Tertiary education generally culminates in the receipt of
certificates,
diplomas,
or
academic degrees.
NPR's Very Tentative Conclusions After One Year of the
Tennessee Promise Program
Five Free Semesters of Higher Education for Tennessee's High School Graduates ---
https://www.npr.org/sections/ed/2018/05/28/614435379/a-degree-with-zero-student-debt-does-it-work?elqTrackId=13fc85ae5732430b8f1156d7f288d64b&elq=71d1e243c95446b48809a4c5e3e15740&elqaid=19242&elqat=1&elqCampaignId=8748
Jensen Comment
This is not a benefit versus cost of the Tennessee Promise Program. In fairness
it will take more years of evaluation in terms of costs and benefits, and even
then human education is difficult to quantify for such an analysis. Also
experiments should be run with regard to other alternatives. Studies need to be
conducted regarding how well students in this program are performing later on in
higher education, especially performance of lower achievers. Are they
really prepared to ultimately be admitted by a flagship university or are they
finding jobs consistent with the level of their education?
No European or other nation to my knowledge comes anywhere
close to providing universal free higher education to lower achievers. In fact,
OCED nations like New Zealand, Finland, Norway, Denmark, France, Germany, etc.
do not offer 50% of Tier 2 graduates free training and/or education. Those
nations rely on the majority of Tier 2 graduates to get employer-funded training
that is much more intensive than such funding my USA employers ---
http://faculty.trinity.edu/rjensen/HigherEdControversies.htm#Tertiary
Especially note the OECD nations listed at
https://en.wikipedia.org/wiki/List_of_countries_by_tertiary_education_attainment
Turkey and Argentina provide free college education but competition get such a
free education "are fierce" ---
https://en.wikipedia.org/wiki/Free_education
Russia offers more widespread free education, but the Russian higher education
system is notoriously corrupt.
Tennessee and some other parts of the USA seem to be unique in
providing universal college education free to low achievers. Some might argue
that community college graduates from two-year programs are not really more
advanced on average than Tier 2 graduates in other OCED nations. I'm not quite
so cynical, but it would be interesting to know more about the competency level
of community college graduates having lower than 3.0 gpa records in the
Tennessee Promise Program after it is rolling well beyond the first year.
There are, of course, many free college credits (not usually
degrees) available in the USA.
“You have to make decisions that you’re going
to reach certain goals, and some of our goals
we think are achievable”
Nancy Pelosi (when criticizing Alexandria's Green New Deal and
Basic (Guaranteed) Income and Medicare-for-All)
Click Here
Government Spending (as a percentage of GDP) on Colleges in the
US Is Higher than in the Countries with "Free" College ---
https://mises.org/wire/government-spending-colleges-us-higher-countries-free-college
**How to mislead with statistics
The Enormous Problem of "Measuring" Evidence
"10 scientific mysteries we are set to solve this century," by Tom Siegfried,
Science News, January 31, 2015 ---
http://www.businessinsider.com/scientific-mysteries-we-could-solve-in-the-21st-century-2015-1
. . .
7. How to measure evidence
This one is so mysterious that many scientists
don’t even know there’s a mystery. But if they paused to think, they’d
realize that the standard way of inferring conclusions from experimental
data — calculating “statistical significance” — makes about as much sense as
punting on fourth and seven when you’re down by 15 with eight minutes to go.
One small example: if you do an experiment and get
a statistically significant result, and then repeat it and get a
statistically significant result again, you’d think you have better evidence
than doing the experiment only once. But if the significance level was a
little less the second time, the combined “P value” would be less impressive
after the second experiment, even though the evidence ought to be regarded
as stronger.
It’s a mess. Game theory would surely be able to
help somehow, possibly by virtue of its relationship to thermodynamics.
Bob Jensen's threads on science and humanities links ---
http://www.trinity.edu/rjensen/bookbob2.htm
**How to mislead with statistics
Above all, Nate Silver urges forecasters to become Bayesians
(Forecasting, Prediction, Probability, Inferences, Lie, Lies,
Statistics, Bias, Bayes, Bayesian)
It is almost a parlor game, especially as
elections approach—not only the little matter of who will win but also:
by how much? For Nate Silver, however, prediction is more than a game.
It is a science, or something like a science anyway. Mr. Silver is a
well-known forecaster and the founder of the New York Times political
blog FiveThirtyEight.com, which accurately predicted the outcome of the
last presidential election. Before he was a Times blogger, he was known
as a careful analyst of (often widely unreliable) public-opinion polls
and, not least, as the man who hit upon an innovative system for
forecasting the performance of Major League Baseball players. In "The
Signal and the Noise," he takes the reader on a whirlwind tour of the
success and failure of predictions in a wide variety of fields and
offers advice about how we might all improve our forecasting skill.
Mr. Silver reminds us that we live in an era
of "Big Data," with "2.5 quintillion bytes" generated each day. But he
strongly disagrees with the view that the sheer volume of data will make
predicting easier. "Numbers don't speak for themselves," he notes. In
fact, we imbue numbers with meaning, depending on our approach. We often
find patterns that are simply random noise, and many of our predictions
fail: "Unless we become aware of the biases we introduce, the returns to
additional information may be minimal—or diminishing." The trick is to
extract the correct signal from the noisy data. "The signal is the
truth," Mr. Silver writes. "The noise is the distraction."
The first half of Mr. Silver's analysis
looks closely at the success and failure of predictions in clusters of
fields ranging from baseball to politics, poker to chess, epidemiology
to stock markets, and hurricanes to earthquakes. We do well, for
example, with weather forecasts and political predictions but very badly
with earthquakes. Part of the problem is that earthquakes, unlike
hurricanes, often occur without warning. Half of major earthquakes are
preceded by no discernible foreshocks, and periods of increased seismic
activity often never result in a major tremor—a classic example of
"noise." Mr. Silver observes that we can make helpful forecasts of
future performance of baseball's position players—relying principally on
"on-base percentage" and "wins above replacement player"—but we
completely missed the 2008 financial crisis. And we have made egregious
errors in predicting the spread of infectious diseases such as the flu.
In the second half of his analysis, Mr.
Silver suggests a number of methods by which we can improve our ability.
The key, for him, is less a particular mathematical model than a
temperament or "framing" idea. First, he says, it is important to avoid
overconfidence, to recognize the degree of uncertainty that attends even
the most careful forecasts. The best forecasts don't contain specific
numerical expectations but define the future in terms of ranges (the
hurricane should pass somewhere between Tampa and 350 miles west) and
probabilities (there is a 70% chance of rain this evening).
Above all, Mr. Silver urges forecasters to
become Bayesians. The English mathematician Thomas Bayes used a
mathematical rule to adjust a base probability number in light of new
evidence. To take a canonical medical example, 1% of 40-year-old women
have breast cancer: Bayes's rule tells us how to factor in new
information, such as a breast-cancer screening test. Studies of such
tests reveal that 80% of women with breast cancer will get positive
mammograms, and 9.6% of women without breast cancer will also get
positive mammograms (so-called false positives). What is the probability
that a woman who gets a positive mammogram will in fact have breast
cancer? Most people, including many doctors, greatly overestimate the
probability that the test will give an accurate diagnosis. The right
answer is less than 8%. The result seems counterintuitive unless you
realize that a large number of (40-year-old) women without breast cancer
will get a positive reading. Ignoring the false positives that always
exist with any noisy data set will lead to an inaccurate estimate of the
true probability.
This example and many others are neatly
presented in "The Signal and the Noise." Mr. Silver's breezy style makes
even the most difficult statistical material accessible. What is more,
his arguments and examples are painstakingly researched—the book has 56
pages of densely printed footnotes. That is not to say that one must
always agree with Mr. Silver's conclusions, however.
Continued in article
Supreme Court of the United States ---
https://en.wikipedia.org/wiki/Supreme_Court_of_the_United_States
**How to mislead with statistics (missing values)
Physics and Math Predict Supreme Court Votes
http://www.physicscentral.com/explore/plus/supreme-court.cfm
Opinions of the Supreme Court
https://www.supremecourt.gov/opinions/slipopinion/18
Jensen Comment
I'm not taking issue with the records of the supreme court or models used to
predict judicial decision outcomes. What I do take issue with is how incomplete
these records are in judging the partisanship power of the Court or individual
members of the court based upon voting records. The power
of the Supreme Court is vast due to it's power to intimidate.
It's a lot like the trouble analysts have in trying to place fraud prevention
values on IRS tax audits or financial statement audits. We can examine
the records of actual audits in detecting fraud until the cows come home, but
we can never analyze frauds that never happened
because of fear of being detected in audits. The
same thing happens when trying to judge the Supreme Court and its members on the
basis of their voting records. What we cannot analyze is the vast set of all
cases or possible cases that never came to the court out of fear of what the
Court would decide.
I would contend that the more the Supreme Court is viewed as partisan the
larger the set of cases or potential cases that never will reach the court. For
example, after his decision on Obamacare and some other cases the current
Justice John Roberts is not viewed as horrifically conservative as many
progressives once feared. Justice Elena Kagan is not viewed as liberal as many
conservatives once feared. But these opinions are based
upon a relatively few number of cases that reached the Supreme Court.
The Supreme Court can be far more biased in selection of cases than in
deciding cases.
Furthermore, fear of a politicized court may prevent business firms, colleges,
states, etc. from even filing lawsuits initially out of fear of what might
happen on what is viewed as a "politicized" supreme court. For example,
California's new law favoring net neutrality is being challenged by the Federal
government. If California loses in a lower court decision will California be
afraid to carry the fight up to the current (post-Kavanaugh) Supreme Court?
Personally I think California might be foolish to appeal to the present USA
Supreme Court. California should fear that the Supreme Court's decision might
forever make it more difficult to fight for net neutrality --- net neutrality is
something I want badly. It may be better to wait until liberals have more power
to reinstate net neutrality in Congress and the White House.
My point here is that voting records per se are potentially misleading in
judging our Supreme Court or its individual members.
There is some evidence of Supreme Court bias on other grounds,
particularly the Harvard/Yale bias ---
http://articles.latimes.com/2010/may/12/opinion/la-oe-turley-supreme-court-20100512
I don't dispute this argument, although it is somewhat ironic that both
Justices Thomas and Sotomayor graduated from the Yale law school. I suspect that
these days the Yale Law School would like to disbar Justice Thomas even if he is
African American.
*A Misleading Article
The Sharing Economy Was Dead on Arrival ---
https://daily.jstor.org/the-sharing-economy-was-dead-on-arrival/
Jensen Comment
This article makes some good points and then goes on to make unwarranted
extrapolations. Just because Uber and some other sharing firms are in trouble
does not extrapolated to the entire "sharing" economy.
My first thought was to a recent time I arrived at the Baltimore airport and
faced an expensive taxi ride to my hotel in Washington DC. When picking up my
luggage I was told I could save about 75% of that price by taking a shared-ride
van. Sure the ride took slightly over an hour longer taking my fellow passengers
to their destinations before I reached my destination, but to my knowledge this
shared-ride van business is still highly competitive in the Baltimore airport
and some other airports across the USA. The shared-ride concept did not begin
with Uber and will not end with Uber.
I thought of the thousands of libraries who share books with readers and the
many, many journals, newspapers, and magazines that now share their articles
online for free for limited or unlimited periods of time. Many scholarly
associations have come to terms with sharing knowledge for free that they used
to sell on a paid subscription basis.
I thought of the magnificent Wikipedia that where users themselves share
their scholarship for free with others around the world. Wikipedia now is bigger
and better than any encyclopedia. it's not without problems, but users don't let
the problems destroy the magnificence of what we have in Wikipedia.
I thought of the wonderful MOOCs where prestigious universities share
thousands upon thousands of courses for free around the world each year. Sure
edX and other firms selling badges and credits for those courses are not yet
profitable, but the courses themselves are free to students who just want to
learn.
I thought of Elon Musk's recent announcement that all Tesla patents,
including some very valuable patents, are open shared. Sure some investors will
complain that this is sacrificing profits and creating risks that competitors
will leverage those patents to harm Tesla. But the fact that Tesla does this
appeals to many Tesla customers who think open sharing is part of a bigger
picture of capitalism in a more sharing economy.
I thought of the enormous SSRN where scholars around the world make millions
of their research findings available for free online. Sure there are others on
the SSRN that only link their works to fee journals, but the majority of authors
are sharing their research for free.
I thought about how prestigious universities and other employers now look for
open sharing in resumes and use "volunteerism" as an important criterion for
employment and/or admission of students.
I thought of Bob Jensen who, before and after retirement, shared and still
shares 50+ hours per week adding to an open sharing Website where his only
reward is the occasional messages of gratitude from users. He's no longer
building a career or selling his consulting services. He does this willingly for
free in the tremendous sharing spirit that evolved since the World Wide Web was
invented. Much of what Bob Jensen shares is admittedly made possible by the
willingness of millions of scholars and researchers to share their produce for
free.
That claim that the "sharing economy was not dead on
arrival" is just not a valid claim in the 21st Century where attitudes about
open sharing economies have greatly changed. Knowledge wants to be free.
Elsevier ---
https://en.wikipedia.org/wiki/Elsevier
The University of California system is calling it quits with Elsevier, one
of the biggest academic publishers in the world in an effort to promote open
sharing ---
https://www.universityofcalifornia.edu/press-room/uc-terminates-subscriptions-worlds-largest-scientific-publisher-push-open-access-publicly?elqTrackId=d33d910ed53c41839e05a7c88b53acf1&elq=401766e275df4f8bb5d628f7f61360f4&elqaid=22388&elqat=1&elqCampaignId=11031
Also see
https://www.chronicle.com/article/U-of-California-System/245798
Bob Jensen's threads on how some publishers rip off research libraries by
charging extortion-like fees to libraries (but not necessarily individual
researchers) ---
http://faculty.trinity.edu/rjensen/FraudReporting.htm#ScholarlyJournals
My thoughts on open sharing years ago ---
http://faculty.trinity.edu/rjensen/000AAA/AAAaward_files/AAAaward02.htm
My Outstanding Educator Award Speech (on Open Sharing) ---
http://faculty.trinity.edu/rjensen/000aaa/AAAaward_files/AAAaward02.htm
Free Riders: Electric cars are supposed to be good for the environment,
but they could make America’s crumbling roads much worse
---
https://www.businessinsider.com/electric-cars-could-make-americas-crumbling-roads-much-worse-2019-2
Jensen Comment
The problem of not paying road taxes is even worse for trucks since trucks are
on the road so much more and pay such a huge amount of road taxes. All eyes are
on California to do something about this since nearly half of Tesla sales are in
California. Thiese cars are paying zero toward road and bridge maintenance.
Taxing charging stations is not the answer since many electric vehicles never
use these stations. The fair answer is to tax odometer
mileage when car registrations are renewed.
France scrapped a more extreme version of Alexandria Ocasio-Cortez's tax plan
for millionaires because it was making so little money ---
https://www.businessinsider.com/france-scrapped-extreme-version-alexandria-ocasio-cortezs-tax-plan-millionares-2019-3
Hillary Clinton Is Not a Fan of Bernie’s or Warren’s Wealth
Taxes ---
Click Here
She thinks they’re “unworkable” and would be “incredibly disruptive.”
**How to Mislead With Statistics
That means the “wealth tax” wouldn’t even generate enough revenue to cover 1
percent of the $42 trillion that Democrats wish to spend.---
Click Here
Democrats
are pitching a “wealth tax” as a way of financing their outrageous spending
demands. The problem is that even America’s wealthiest people don’t have
that much money.
Senator and
presidential candidate Elizabeth Warren has been one of the most vocal
advocates for a wealth tax and is now trying to make the radical idea more
palatable to voters by coupling it with a proposal for a massive federal
child care program. That’s hardly the only exorbitantly expensive demand on
the Democrat agenda, though.
Economist Brian Riedl
calculates
that the democratic socialist agenda that leading Democrats are now
embracing — which “includes single-payer health care (
$32
trillion),
a federal jobs guarantee
($6.8 trillion),
student loan forgiveness
($1.4 trillion),
free public college
($800 billion),
and infrastructure
($1 trillion)”
—
will cost an astronomical $42 trillion over the next decade.
This
amount leaves out many proposals such as green initiatives
($50 trillion)
reparations of African and Native Americans
($10 trillion.)
Hence the cost of Democratic Socialism is conservatively estimated at over
$100 trillion to be added to the $100+ trillion in entitlements that already
exists (think Medicaid and Medicare and Social Security).
To pay for
this extraordinary level of spending, Democrats are pitching the same
solution they’ve always favored: tax the rich.
But math
doesn’t have an ideology, and that’s where the “tax the rich” rhetoric runs
into a roadblock, because even the 70 percent income tax rate that some
Democrats are proposing would fall woefully short of generating enough
revenue to cover even one of their exorbitant spending demands.
As much as
Democrats would like to believe otherwise, wealthy people and business
owners are not a bottomless credit card available to finance a socialist
utopia — as the people of Venezuela can attest. In fact, wealthy people
don’t make nearly enough money to pay for even a fraction of what Democrats
want.
According
to Riedl, the Democrat tax hike would raise $22 billion annually, while The
Washington Post
estimated
it would bring in around $70 billion. That means the “wealth tax” wouldn’t
even generate enough revenue to cover 1 percent of the $42 trillion that
Democrats wish to spend.
Of Course We Can Afford Green New Deal,
Medicare For All and 'It's Not About a Cost' ---
Presidential Candidate Kamela Harris
Click Here
Jensen Comment
Her wants, including reparations for African and Native Americans, the Green New
Deal, Medicare-for-All, Housing Subsidies, Free College, etc. could top $100
trillion, but that is of no consequence
when you're promising everything for votes ---
Uranus ---
https://en.wikipedia.org/wiki/Uranus
Why Donald Trump is so Adamant About Building a Wall
It has to do with his ingenious theory of why Uranus is the only planet in our
solar system that turned to its side (which is true) ---
https://phys.org/news/2019-01-uranus-side-weve.html
Or as astronomers with cautious pronunciation say at cocktail parties: "Uranus
went bottoms up!"
Trump Theory of Planetary Tilt
His theory actually resulted from a nightmare he had just before setting out on
the 2016 campaign for the USA presidency.
Astronomers are not sure just when Uranus tipped to its side, but Trump's theory
is that at some point the entire population (around 2 billion) of the southern
Western Hemisphere of Uranus commenced migrating to the north in search of
economic safety nets (free medical, free education, free housing, free
transportation, free sex, free drugs, food stamps, etc. etc. etc.)
At some point the shift in weight in the Western Hemisphere forced Uranus to tip
on its side.
What might've prevented this disaster is an enormous wall between north and
south that would've kept the population weights balanced
between the Eastern and Western Hemispheres of Uranus.
It then became Donald Trump's main mission in life to keep the Earth from
tipping
So now when the Earth similarly tips to its side, we should blame Nancy Pelosi
for making people on earth walk on all fours and clutch to anything that might
prevent them from falling into space (known on Uranus as becoming spaced out).
Instead of a wall in the Western Hemisphere on Earth, Europe could have opened
its borders to Africa to counterbalance the hemispheres. Then the Earth would
have only sunk a bit lower and changed its orbit. But 2018 Europe closed its
borders to illegal immigration which one day will make the dwindling population
of earth sorry that a wall was not built across the Western Hemisphere ---
separating south from north.
History will prove former President Donald Trump was correct about Mexico one
day funding an impenetrable wall --- to keep out over 2 billion starving green
immigrants seeking to enter Mexico from the north.
The Atlantic: The Swiftly Closing Borders of
Europe ---
https://www.theatlantic.com/international/archive/2018/12/europe-france-italy-immigration-border/578179/
Italian Minister tells NGO Italy doesn’t want
migrants: “Our ports are closed!” ---
https://voiceofeurope.com/2018/12/italian-minister-tells-ngo-italy-doesnt-want-migrants-our-ports-are-closed/#.XB6WCZMs_Xo.twitter
The enemy is fear
We think it's hate
But, it's fear
Gandhi
Kaiser Family Foundation: People love Medicare-for-All until they're told it'll
raise their taxes to the $30+ trillion cost: Then support nosedives ---
https://www.businessinsider.com/ap-poll-support-for-medicare-for-all-fluctuates-with-details-2019-1
Jensen Comment
Virtually all nations with national health plans raise the funds needed with
taxation at all levels of income. Estimates of USA's cost run $30+ trillion over
ten years, but a lot depends upon
who is covered (severely ill or disabled immigrants crossing the border
illegally for dialysis or other expensive health care),
what is covered (think long-term nursing care). and
capital costs (will government build hospitals and medical centers?).
Wealth Tax ---
https://en.wikipedia.org/wiki/Wealth_tax
Even if wildly successful (which is impossible) Senator Warren's wealth tax would only pay $2.75
trillion of the $30+ trillion cost ten-year cost of Medicare-for-All
Elizabeth Warren's proposed wealth tax would raise $2.75 trillion over a
ten-year period from about 75,000 families, or less than 0.1 percent of U.S.
households ---
https://www.cnbc.com/2019/01/24/elizabeth-warren-to-propose-new-wealth-tax-economic-advisor.html
Jensen Comment
This could have all sorts of economic consequences. One is that most of those
75,000 wealthy USA families have their wealth tied up in long-term investments
like real estate (think of Trump hotels, Ted Turner's ranches in Australia,
Amazon's many shares owned by Jeff Bezos), etc. Warren's Wealth tax could force
liquidation of these long-term investments to pay the $2.75 trillion wealth tax.
If you want your top millionaires and billionaires to move out of the USA
this is a sure-fire way to wave bye bye to them and the $2.75 trillion that
becomes uncollectable.
Wealthy taxpayers are probably
not worried with a conservative Supreme Court.
Arguably her proposal requires an amendment to the USA Constitution because her
wealth tax proposal is extremely disproportional.---
https://en.wikipedia.org/wiki/Wealth_tax#United_States
You can read more about wealth taxes at
https://en.wikipedia.org/wiki/Thomas_Piketty
PS
Those 75,000 wealthy taxpayers now invest in hundreds of billions in tax-exempt
bonds (called municipal bonds) that underlie the building of most schools and
municipal buildings in the USA. The muni bond market would nosedive if most of
those 75,000 people sold their tax-exempt bonds and moved these hundreds of
billions in investments off shore on their way out of the USA. That's not a cost
that the naive Elizabeth Warren factored into her proposed wealth. What's the
incentive for a billionaire who moved to Switzerland to continue to invest
hundreds of millions of dollars in the USA muni market?
I suspect that Elizabeth Warren knows that her wealth tax would be an
economic disaster. I think she's just trying to get
votes from financially-ignorant voters. It's all politics and no
sense other than she's trying to fend off the radical anti-capitalist "young"
left wing of the Democratic Party.
Why California's Income Tax Should Not Be
Ignored
Bryce Harper Will Save Tens Of Millions In Taxes By Spurning California Teams
---
https://taxprof.typepad.com/taxprof_blog/2019/03/bryce-harper-will-save-tens-of-millions-in-taxes-by-spurning-the-dodgers-and-giants.html
France scrapped a more extreme version of Alexandria Ocasio-Cortez's income tax
plan for millionaires because it was making so little money (and making high
earners move out of France) ---
https://www.businessinsider.com/france-scrapped-extreme-version-alexandria-ocasio-cortezs-tax-plan-millionares-2019-3
Taxing Top Earners: A Human Capital Perspective ---
http://faculty.georgetown.edu/mh5/research/top-earners.pdf
Abstract
An established view is that the revenue maximizing top tax rate for the US
is approximately 73 percent. The revenue
maximizing top tax rate is approximately 49 percent in a quantitative human
capital model. The key reason for the lower
top tax rate is the presence of two new forces not captured by the model
underlying the established view. These new forces are strengthened by the
endogenous response of top earners’ human capital to a change in the top tax
rate.
Why did liberal Sweden axe its wealth tax while at the same time lowering its
top income tax rate from 87% (1979) to 65% (1990) to 56% (2002)? ? ---
http://ftp.iza.org/dp11475.pdf
Elizabeth Warren would probably prefer that you do not study experiences of all
disastrous Scandinavian wealth taxes and very high marginal income tax rates
that were later greatly reduced to stimulate the economy (called supply side (Laffer
Curve) economics) ---
http://www.econlib.org/library/Enc/MarginalTaxRates.html
Alexandria Ocasio-Cortez: A system that allows billionaires to exist
alongside extreme poverty is immoral ---
https://www.cnbc.com/2019/01/22/alexandria-ocasio-cortez-a-system-that-allows-billionaires-to-exist-is-immoral.html
Jensen Comment
She's all heart with little understanding of economics
Hillary Clinton Is Not a Fan of Bernie’s or Warren’s Wealth
Taxes ---
Click Here
She thinks they’re “unworkable” and would be “incredibly disruptive.”
The Washington Post: Billionaires can be good for democracy ---
https://www.washingtonpost.com/opinions/its-open-season-on-the-wealthy-but-billionaires-can-be-good-for-democracy/2019/02/03/fa9bb60e-2643-11e9-ad53-824486280311_story.html?utm_term=.e0597184f6a3
The Role and Design of Net Wealth Taxes in the OECD:
Why Countries Have Moved Away From Wealth Taxes ---
http://www.oecd.org/ctp/the-role-and-design-of-net-wealth-taxes-in-the-oecd-9789264290303-en.htm
This report examines and assesses the current and
historical use of net wealth taxes, defined as recurrent taxes on individual
net assets, in OECD countries. It provides background on the use of wealth
taxes over time in OECD countries as well as on trends in income and wealth
inequality. It then assesses the case for and against the use of a net
wealth tax to raise revenues and reduce inequality, based on efficiency,
equity and tax administration considerations. The effects of personal
capital income taxes and taxes on wealth transfers are also discussed to
understand how these taxes interact with net wealth taxes. Finally, the
report looks at practical tax design issues and shows that the way a net
wealth tax is designed can have a significant impact on the effectiveness
and fairness of the tax. The report concludes with a number of practical tax
policy recommendations regarding net wealth taxes.
Continued in article
Also See
Why Have Other Countries Been Dropping Their Wealth
Taxes?
http://conversableeconomist.blogspot.com/2019/02/why-have-other-countries-been-dropping.html
. . .
Why do
wealth taxes imposed on what seem to be quite low levels of wealth collect
so little revenue in various European countries, especially during the last
few decades when high-wealth individuals as a group have done pretty well?
The answer seems to be that when countries impose a wealth tax, they often
typically create a lot of exemptions for certain kind of wealth that aren't
covered by the tax. Each of these exemptions has a reasonable-sounding
basis. But every exception also creates a potential loophole.
For example, a number of common exemptions are based on "liquidity"
problems, which in this context refers to the idea that we don't want people
to have to sell their homes to pay the wealth tax, and we don't want family
businesses or farms that are maybe hitting a tough patch to have to be sold
off because of the wealth tax. Thus, many European countries exempt a
primary residence from the wealth tax (and instead apply a property tax).
Countries also often exempt the value of a business in which you are
actively working, which of course means a potentially voluminous set of
rules for what "actually working" means. As the OECD notes: "For the
business asset exemption to apply, rules typically require that real
economic activities are being performed (possibly excluding activities such
as the management of movable or fixed assets, e.g. Spain), that the taxpayer
performs a managing role, that income derived from the activity is the main
source of the taxpayer’s revenue and/or that the taxpayer owns a minimum
percentage of shares in the company (e.g. 25% in France and Sweden; 5% in
Spain)."
Another common exemption is that wealth tax is usually not applied to the
value of pensions and retirement savings. One can sympathize with this, but
also recognize that it leads to potential issues. As the OECD notes:
"Pension assets typically get full relief under net wealth taxes. ...
However, this creates inequities between different taxpayers,
raises fairness concerns, and creates tax planning opportunities. .... "
What other
incentives does a wealth tax create? Here are some examples that often are
not included int he discussion:
1) While we often think of a wealth tax as being applied to those who have
already "made it" and accumulated a fortune, it's worth remembering that
when a small- or medium-sized business is trying to get established, or
going through hard times, it may lead to a situation where the overall value
of the asset is substantial, but profits may be near-zero or even negative
for a time. But at least in theory, a wealth tax would still be owed. As the
OECD report notes:
"Under a
net wealth tax, however, if income is zero or negative, the tax liability
will still be positive if the capital value of the assets remains positive.
In practice, new entrepreneurs which tend to generate low, or even negative,
profits in their first few years of operation would still face a wealth tax
liability. Thus, a heavy net wealth tax which is unlinked to income might
discourage entrepreneurship relative to an income tax with (perfect) loss
offset."
2) A wealth
tax will tend to encourage borrowing. Total wealth is equal to the value of
assets minus the value of debts. Thus, one way to avoid a wealth tax is to
borrow a lot of money, in ways that may or may not be socially beneficial.
The OECD writes: "[D]ebt deductibility provides incentives to borrow and can
encourage tax avoidance. If the wealth tax base is narrow, taxpayers will
have an incentive to avoid the tax by borrowing and investing in
exempt assets or – if debt is only deductible when incurred to acquire
taxable assets – taxpayers will have an incentive to invest part of their
savings in tax-exempt assets and finance their savings in taxable assets
through debt."
3) To get a
fair picture of a wealth tax, one needs to look at it in the context of all
the other taxes that exist, along with different situations that arise. It's
quite possible for there to be situations where when the wealth tax is
added, someone who saves more will actually reduce their wealth. The OECD
notes: "In France and Spain, METRs [marginal effective tax rates] reached
values above 100%, which means that the entire real return is taxed away and
that by saving people actually reduce the real value of their
wealth." Indeed, France recently decided to apply its wealth tax just to
certain kinds of property wealth, not financial wealth, for this reason.
Indeed, many wealth taxes have provisions that if the combined tax burden
gets too high, then the wealth tax gets scaled back. Again from the OECD :
"Ceiling
provisions or tax caps are common features of net wealth taxes. These often
consist in setting a limit to the combined total of net wealth tax and
personal income tax liability as a maximum share of income. They are used to
prevent unreasonably high tax burdens and liquidity constraints requiring
assets to be sold to pay the net wealth tax. In France, the wealth tax
ceiling (often referred to as the “bouclier fiscal”) limits total French and
foreign taxes to 75% of taxpayers’ total income. If the percentage
is exceeded, the surplus is deducted from the wealth tax. In Spain, the
aggregate burden of income tax and net wealth tax due by a resident taxpayer
may not exceed 60% of their total taxable income."
4) A wealth
tax is typically at a fairly low rate, like 1-2%, in recognition of the fact
that it will be imposed every year. But if a wealthy person is investing in
a way that has low risk and low returns, this wealth tax could completely
swallow up low return, while having no effect on higher returns. In
general, setting up a situation where people receive no gain from saving is
not usually regarded as a good set of incentives. The OECD writes:
"[A] tax on
the stock of wealth is equivalent to taxing a presumptive return but
exempting returns above that presumptive return. Where the presumptive
return is set at the level of or at a level close to the normal - or
risk-free – return to savings, a wealth tax is economically equivalent to a
tax on the normal return to savings, which is considered to be inefficient.
Indeed, the taxation of normal returns is likely to distort the timing of
consumption and ultimately the decision to save, as the normal return is
what compensates for delays in consumption. As discussed below, it is also
unfair that the wealth tax liability does not vary with returns, which
implies that the effective wealth tax burden decreases when returns
increase."
On the
other side, it is sometimes argued that a wealth tax will encourage the
wealthy to make more productive use of their wealth:
"For
instance, if a household owns land which is not being used and therefore
does not generate income, no income tax will be payable on it. However, if
a wealth tax is levied, the household will have an incentive to make a more
productive use of their land or to sell it to someone who will ...
The argument here is that wealth taxes do not discourage investment per se
but discourage investments in low-yielding assets and reinforce the
incentives to invest in higher-yielding assets because there is an
additional cost to holding assets, which is not linked to the return they
generate."
5) A wealth
tax will encourage the spawning of ownership structures where people control
assets, but do not technically "own" them. A common example is when assets
are owned in a trust, or some kind of nonprofit. The possibilities for
controlling and benefiting from wealth without technically "owning" it are
even great for assets that can be held in other countries across the
international economy. If there is a heaven for tax lawyers, it's a place
where they get to sit around and invent legal arrangements for shielding
wealth.
6) The OECD
notes: "Human capital is always exempt under net wealth taxes. This results
from a number of considerations, including the fact that human capital is
very difficult to value, that it is not
directly
transferrable or convertible into cash, and that there is uncertainty about
the
durability of its value. Therefore, a wealth tax lowers the net return on
real and financial assets relative to the returns on investments in human
capital. Thus, wealth taxes encourage investment in human capital, which may
in turn have positive effects on growth. Human capital is a critical driver
of long-run economic growth. This implies that a wealth tax may be less
harmful to economic growth than commonly believed as it can encourage a
substitution from physical to human capital formation ... "
7) A wealth
tax may not seem especially fair if applied across people who started in
similar circumstances. As one example, imagine two adults who split a large
inheritance. One heir spends the money. The other heir tries to invest, with
some success, in creating new technology and businesses and jobs. The
spender depletes the inheritance and thus avoids the wealth tax. More
broadly, consider wealth from a variety of sources: inherited financial
wealth, inheriting a family business, inheriting a family-owned piece of
property, starting and running a business, investing in businesses run by
others, investing in property that increases in value over time, wealth from
having a patent on an invention, wealth from producing a book or music or
movie with high sales. A wealth tax treats all of these the same.
8) The
practicalities of imposing a wealth tax can be nontrivial. It means updating
the value of assets and debts every year. If the assets are something that
is bought and sold in financial markets, like shares of stock, then updating
the value is easy. But updating the value of an expensive house or piece of
property on an annual basis isn't easy. Updating the value of art or jewelry
owned by a wealthy person isn't easy. Updating the value of a privately
owned business isn't easy. Updating the current value of assets held in
other countries can be hard, too In general, it's a lot easier to track
flows of income than it is to measure changes in asset values.
To me, many of the endorsements of a wealth tax feels more like expressions
of righteous exasperation than like serious and considered policy proposals.
Many of those who favor a wealth tax tend to favor a more European-style
capitalism (and no,
I don't think of any country in western Europe as "socialist")
that places a higher value on economic equality. But when those who favor
your goal of greater economic equality have been steadily deciding that the
wealth tax isn't worth the trouble, and that other policy tools are more
effective in reaching the goal, it's probably useful to pay attention.
The
Young Left’s Anti-Capitalist Manifesto: Its goal is to remake our economic
system — and the Democratic Party ---
https://fivethirtyeight.com/features/the-young-lefts-anti-capitalist-manifesto/
Regressive Tax ---
https://en.wikipedia.org/wiki/Regressive_tax
Elizabeth Warren Proposes Regressive Tax on America's
Largest Companies (hoping to raise $1 trillion in ten years)
https://www.wsj.com/articles/elizabeth-warren-proposes-new-corporate-tax-11554987601
To the extent those 1,200 largest companies do business with the government
(think military fuel purchased from Exxon to fill tankers manufactured by
Boeing) this is a wash item where the government taxes
itself hundreds of billions of dollars
Presidential hopeful Sen. Elizabeth
Warren has proposed a new 7 percent tax on “the largest, most profitable
U.S. companies.” The Real Corporate Profits Tax would affect some 1,200
companies and is projected to raise $1 trillion over a decade. Warren
specifically mentioned Amazon in her proposal — the company would have paid
$698 million more in U.S. taxes for 2018 under Warren’s plan.
Jensen Comment
What Warren fails to mention is that this is probably the most regressive tax
imaginable next to a sales tax and VAT tax.
What she fails to mention is that big corporations
don't pay taxes. Business firms collect taxes from customers by charging higher prices.
The estimated $698 million to be paid by Amazon will be collected from you and
me and Amazon's other customers. The added tax on large airlines will be tacked
onto air fares. The added tax on Home Depot, Kroger, GM, Exxon, and Ford will be paid
by its customers by way of higher prices. For example, one of the waitresses in
our nearby Polly's Pancakes is a single mom with three children living in a
mobile home heated with kerosene (commonly used for homes without basements in
this very cold mountain climate). Elizabeth Warren's tax will increase the price
of her kerosene (local suppliers buy from big outfits like Exxon) along with the
fuel she purchases for her rusty old sedan and her electric bill from our grid
powered mostly by natural gas.
Why do poor people and the lower middle class end up
paying the lion's share of Elizabeth Warren's proposed tax? Mainly because there
are so many more people that are poor or lower middle class relative to higher
income people. In the USA the poor and lower middle class pay virtually no
income tax, but they pay regressive taxes like sales taxes, fuel taxes, property
taxes (even when renting), and the corporate taxes factored into prices of
purchased goods and services.
This is not a tax on the super rich who invest more
than they spend. It's a tax on the poor and middle classes who spend most of
every penny they receive.
Don't get me wrong. Some big corporations will be
hurt badly to the extent that imported goods are relatively cheaper when
marketed by smaller and/or foreign companies exempted from the tax. LL Bean's prices on shoes
and clothing will be more price competitive relative to Amazon, although
customers who buy more from LL Bean will still be paying a premium above
Amazon's prices. LL Bean customers just won't have as much selection as they did when they
bought more from Amazon. Volvos will be cheaper relative to Fords made in
Michigan, and if Warren's tax was greater (say 20%) Ford would really hurt
because Volvo's US operations are tax exempt under her proposal.
The good news is that even her fellow democrats are
usually opposed to regressive taxes. They prefer a 70% tax on earnings of
physicians and other high income taxpayers.
Senator Warren has a history of proposing taxes that
are unconstitutional. This is just one of those political gimmicks in her
political campaign that will never come to reality. In truth she has no idea how
to fund her $100+ trillion dollar spending programs for free medical care, free
college, free guaranteed annual income for everybody, and African/Native
American repartitions on top of all the existing safety nets like subsidized
housing, food stamps, and welfare.
Generally Accepted Accounting Principles (GAAP) ---
https://en.wikipedia.org/wiki/Accounting_standard
Financial Accounting Standards Board (FASB) ---
https://en.wikipedia.org/wiki/Financial_Accounting_Standards_Board
Elizabeth Warren's 7% Real Corporate Profits Tax Would Politicize GAAP, Harm
Investors And Employees ---
https://taxprof.typepad.com/taxprof_blog/2019/05/elizabeth-warrens-7-real-corporate-profits-tax-would-politicize-gaap-harm-investors-and-employees.html
Wall Street Journal op-ed:
Don’t Let Warren
Politicize Accounting, by Scott
Dyreng (Duke):
Sen. Elizabeth Warren is campaigning for president
like Robin Hood in the Hamptons. But the Massachusetts Democrat’s proposed
Real Corporate Profits
Tax—her plan to tax highly
profitable companies on their financial accounting incomes—may do more harm
than good to the working class she claims to champion.
The U.S., like other
developed nations, uses two accounting systems. Companies report income to
investors following Generally Accepted Accounting Principles, or GAAP, which
are determined by the private, nonpolitical Financial Accounting Standards
Board. The paramount purpose of this standard is to provide investors with
information they can use to allocate capital soundly.
To file their taxes,
companies follow different accounting rules, defined by the Internal Revenue
Code. Congress has multiple goals in the way it defines the corporate tax,
from raising revenue and redistributing wealth to regulating companies’
behavior and increasing U.S. competitiveness.
Ms. Warren calls for a 7%
levy on financial-accounting earnings above $100 million, on top of the 21%
tax corporations already pay on taxable income. Even putting aside its
negative impact on profits, the new tax would hurt investors by subjecting
accounting standards to politics.
If taxes become tied to
GAAP earnings, financial accounting standards will inevitably be distorted.
Politicians would pressure the Financial Accounting Standards Board to
adjust GAAP in a way that increases government revenue, or punishes or
rewards certain corporate expenditures. In short order, financial reports
would come to reflect Congress’s objectives. ...
Trying to fix the
corporate-tax system using financial-accounting standards is like trying to
fix a car at a doctor’s office. And the likely victims of the ensuing
shenanigans will be the workers and small investors Sen. Warren wants to
protect.
Jensen
Comment
Congress has a history of trying to influence behavior using the tax code. For
example, both property taxes and mortgage interest were declared deductions from
personal income for tax purposes to encourage home ownership that Congress
deemed to be good for society in terms of both creating more housing and in
keeping houses maintained. In addition, home mortgages forced savings behavior
where it is common for retirees to have larger retirement savings than renters
who are not forced to save monthly in rental payments.
Corporate income tax accounting rules departed from what accounting standard
setters (think the FASB and its predecessors ) deemed the 'better" accounting
for investors to evaluate accounting performance businesses and make portfolio
investments. For example, to stimulate business capital investment the corporate
tax depreciation rules allowed accelerated depreciation write-offs that did not
correlate well with value changes of manufacturing and farm equipment having
longer usage lives. Accounting standard setters deemed less aggressive
depreciation more relevant to investors. This led to income tax losses that
accounting standard setters felt misled investors rather than GAAP income
reporting. Of course there were exceptions that I don't think can be justified
(such as LIFO inventories).
Note
that in the good old days Congress wisely felt that reducing business taxes
could greatly stimulate economic growth and jobs in the nation. The assumption
was that government collected more taxes from a growing economy than one than a
stagnant or declining (think recession) economy. Elizabeth Warren and her
sympathizers are distressed by the idea that business firms fueling the economic
growth engine of the USA could use tax deferrals or avoidances to pay outrageous
executive salaries and fuel shareholder value increases for fat cats while
paying less to the IRS, although I think she does not give credit where credit
is due when making corporations wildly profitable under GAAP does frequently
stimulate economic growth, job creation, and net increases in taxes (supply-side
theory) collected by the government from workers and happy investors. The
extent to which business success creates tax collection success is the
subject of vicious debate (e.g., supply-side disputes)
between conservatives and liberals that is chronic and complicated.
Elizabeth Warren now wants to base business taxes based upon GAAP profits rather
than accounting profits under tax code accounting rules --- rules written into
the tax code for both good economic reasons (economic growth stimulus) and bad
reasons (business lobbying crime).
The
FASB genuinely takes pride in being independent of business lobbying (not all
accountants like Tom Selling agree), but there is evidence of such independence
(such
FAS 123R
rules for stock option accounting under GAAP, rules that the tech industry
despises). Of course the SEC that can override the FASB in the setting of
GAAP at any time. On rare occasions the SEC caved into business lobbies for the
wrong reasons when overwriting the FASB rules. The classic case is the time the
SEC overrode sensible "successful-efforts"
FASB rules on oil and gas write offs of dry holes in oil well drilling. In that
disgrace the SEC blatantly allowed bad rules for keeping worthless oil wells on
the books as phony assets. Except for relatively rare lapses (like writing off
dry holes) the SEC has wisely let the FASB set most GAAP accounting standards to
keep business lobbies off the SEC's back.
The
above article wisely suggests that Elizabeth Warren's tax proposal will now
subject the FASB to business lobby pressures that have plagued (and sometimes
corrupted) the IRS for decades relative to the wall the SEC created to protect
itself from business lobbies by transferring GAAP authority to the
non-governmental FASB.
Personally, I don't think that there should be a corporate income tax. There
will always be too many loop holes imposed by lobbyists in the calculation of
taxable business income. I prefer a VAT tax
that is easier to compute and certainly easier to collect as evidenced ty the
European VAT taxes. Of course business firms generally hate the VAT tax
but I still think it's the way to go even if it does put a lot of lawyers and
tax accountants out of business and raise prices.
My
liberal friends argue that a VAT tax is regressive and raises prices for
consumers. However, the corporate income tax that Elizabeth Warren proposes is
also regressive.
Business firms don't pay any taxes levied upon them. They
collect taxes from customers. If Elizabeth Warren levies regressive income
taxes on the GAAP earnings of Amazon and Walmart those taxes will be passed on
in the form of higher prices to you, me, and the other customers of Walmart no
different than is Elizabeth Warren imposes a VAT tax on Amazon and Walmart.
The
advantage of the VAT tax is that the FASB can continue to set accounting
standards to help investors make portfolio decisions about stocks and bonds of
companies. Of course if companies must pay $100+ trillion in taxes for new
social programs there won't be any stock markets or bond markets left. Pension
savings in such funds as CREF and CalPERS will get wiped out. Think about it! To
raise over $100 million most of the money is going to have to come from
investors themselves since Sen. Warren's proposed corporate income tax on GAAP
and her wealth tax proposal will not raise nearly that much money. Taking $100+
trillion from investiors will wipe out both stock and bond markets.
Regarding Elizabeth Warren. she just wants to spend over $100 trillion annually
in a way that will destroy the USA economic engine of the USA for her
green initiatives, free medical care, free medications, forgiveness of student
debt, free college, guaranteed minimum income for all residents of the USA
(including non-citizens), housing-for-all, reparations for African and Native Americans, and on
and on and on without an end to spending. There's no chance in Hell that the USA
as we know it today can afford all the programs Sen. Warren and her friends want
to fund.
So I
say keep the government and business lobbies out of the setting of GAAP to the
extent possible! Collect taxes in some way for achievable social goals that will
will not destroy the economic engine of the USA and turn it into a third world,
overpopulated, and starving nation.
Young
people especially wonder why Joe Biden is leading in the 2020 polls for
Democratic party nomination. The reason is that the majority of voting Democrats
do not want to destroy the economic engine of the USA by spending over $100
trillion annually for spendthrift social programs that cannot possibly be
afforded even by the greatest economy on earth. Don't let ignorant spenders ruin
it all.
Bernie Sanders’s housing-for-all plan,
explained ---
https://www.vox.com/2019/9/19/20873224/bernie-sanders-housing-for-all
**How to Mislead With Statistics
Elizabeth Warren's Pitch for 'Economic Patriotism' Is Full of
Intellectual Dishonesty and Economic Fallacies ---
https://reason.com/2019/08/26/elizabeth-warrens-pitch-for-economic-patriotism-is-full-of-intellectual-dishonesty-and-economic-fallacies/
Warren needs to take a lesson
from Leonard Read's "I, Pencil."
Sen.
Elizabeth Warren (D–Mass.) is promising to protect Americans from the
scourge of…pencils?
In a new
video posted to Twitter over the weekend, the presidential candidate
promises to create a new federal agency that would expand on the
protectionist measures undertaken by Donald Trump. She's even borrowing
Trumpian rhetoric for the project, which she calls "economic patriotism," as
she promises that a Warren administration would put the interests of
American workers first.
Warren's
attack on corporations that supposedly harm Americans by shifting jobs
overseas is full of intellectual dishonesty and economic fallacies. Rather
than making a case for greater government involvement in the corporate
boardrooms of America, the video succeeds only at highlighting how
misinformed and misguided such interventions are, regardless of whether they
are executed by Trump or Warren.
"There
are a lot of giant companies who like to call themselves 'American,' but
face it: they have no loyalty or allegiance to America," she says in the
video.
As proof,
Warren points to the "famous no. 2 pencil," which is mostly manufactured in
Mexico and China. Her video doesn't make clear why pencils should have to be
made in America—or why that lack of good, pencil-making jobs in America is a
problem.
That
Warren chose to use pencils to illustrate the supposed need for "economic
patriotism" is darkly hilarious to anyone familiar with "I,
Pencil,"
Leonard Read's 1958 parable about the merits of free markets and comparative
advantage. Reed's lesson is that no one on the planet has the means or
knowledge to make an item as mundane and ubiquitous as a simple pencil. A
pencil requires wood, graphite, brass, and rubber, but each component part
is the result of supply chains that might stretch around the world—from the
forests of the Pacific Northwest to the mines of Mexico to the factories of
Indonesia.
"Neither
the worker in the oil field nor the chemist nor the digger of graphite or
clay nor any who mans or makes the ships or trains or trucks nor the one who
runs the machine that does the knurling on my bit of metal nor the president
of the company performs his singular task because he wants me," Read wrote
in the role of the eponymous pencil. "Each one wants me less, perhaps, than
does a child in the first grade."
And yet
we have pencils. Tons of them. Not only that, but the process for obtaining
and combining those various component parts is so efficient—despite "the
absence of a master mind" directing all those activities, Read notes—that
you can buy
dozens of pencils for no
more than a few dollars.
The simple pencil is a miracle of the modern world, and of trade that
crisscrosses national borders.
What is
true about pencils is true about
almost everything else you
buy too.
There's not really any such thing as an "American" or "foreign" automobile
anymore. Not when the world's biggest BMW plant is
in South Carolina,
and when the assembly line for a single car seat might
zig-zag across the U.S.-Mexico border
five or six times. The iPhone is engineered in the United States, is
manufactured in China, and
contains components
sourced all over the world.
That
Warren fails to grasp this—or that she cynically believes voters don't grasp
it—makes her no better than Trump when it comes to trade policy. Indeed,
Trump's use (and abuse) of executive power to implement his own myopic and
self-defeating trade policies may have only paved the way for a more
competent protectionist like Warren, if she ends up in the White House.
It's
worth noting that Warren's proposal for a new federal department to oversee
her "economic patriotism" scheme would potentially streamline some
government functions. She says the new Department of Economic Development
would replace the Commerce Department and "a handful of other government
agencies." Consolidation of the federal bureaucracy can be a good way to
root out unnecessary overlap between existing agencies, but this seems like
an effort at reorganizing a bunch of things the feds shouldn't be doing in
the first place.
Beyond
that, there's little truth to the claim that American manufacturing has been
hollowed out by trade. Foreign investment in American manufacturing reached
record highs in 2018,
and American manufacturing output
has tripled since 1980.
Continued in article
Bernie Sanders and Kamala Harris want to erase student debt and reform
healthcare by taxing Wall Street. But a new study shows college and retirement
savings would take a serious hit ---
https://markets.businessinsider.com/news/stocks/bernie-sanders-kamala-harris-financial-transaction-tax-could-hurt-savings-2019-9-1028524666
-
A new study from the
Modern Markets Initiative shows how much a financial transaction tax —
like ones proposed by Bernie Sanders and Kamala Harris — would cost
those saving for college and retirement.
-
The study outlines how
much 529 college savings plans, university endowments, public pension
funds, 401(k) plans, and IRAs would owe annually under a financial
transaction tax.
-
"While free college is
admirable, should our teachers' pension funds be paying for it?" Kirsten
Wegner, the CEO of MMI, told Markets Insider in an interview.
Bernie Sanders Doubles Down On Promise Of ‘Free’
Healthcare And College For The ‘Undocumented’ (VIDEO)
https://www.thegatewaypundit.com/2019/09/bernie-sanders-doubles-down-on-promise-of-free-healthcare-and-college-for-the-undocumented-video/
All the sick and disabled poor people of the world should try to sneak into the
USA for free medical care, long-term nursing home care, and free college.
The population of the USA could triple in less than a year.
Bernie Sanders: ‘We Are
Going to Impose a Moratorium on Deportations’ (until they complete
their free college and a lifetime of free healthcare) ---
https://www.breitbart.com/politics/2019/09/14/bernie-sanders-we-are-going-to-impose-a-moratorium-on-deportations/
Jensen Comment
If big spending 2020 presidential candidates are trailing Biden think how much
they would trail any conservative in the general election opposed to spending
$20 trillion
Chronicle of Higher Education: Free Public Higher Education is a
Horrible Idea ---
https://www.chronicle.com/article/Free-Public-College-Is-a/247134?utm_source=cr&utm_medium=en&cid=cr&source=ams&sourceId=296279
Now
that the race for the Democratic nomination for president is becoming more
serious, it is time to take an equally serious look at the proposal for
tuition-free public college that has been explicitly endorsed by candidates
including Bernie Sanders, Elizabeth Warren, and Julián Castro and that is
likely to feature prominently in the upcoming debates.
Let’s pretend, for the sake
of argument, that the proposal is not both unaffordable and unenforceable
without an unprecedented level of state cooperation and expenditure. Let’s
pretend as well that it is more than bumper-sticker material and actually
the product of careful thought. Let’s pretend that it actually could become
the law of the land.
It
would be a terrible law.
There are many problems
with higher education in the United States, but the greatest and most
destructive is the significant inequality of access to education on the
basis of race and economic status, which are often though not always
intertwined. The goal of any good public policy should be to use finite
public funds to reduce this inequality.
While eliminating tuition
at all public colleges and universities, from the smallest community college
to flagships like the University of Virginia and the University of Michigan,
would indeed benefit many lower-income students, it would also, and probably
to a greater extent, be a boon to students from the upper-middle and upper
classes.
Moreover, the policy would
not alleviate and would probably worsen the most striking inefficiency in
our system of public education: the abysmally low rates of graduation.
In short, tuition-free
college would be a hugely inefficient use of public resources and might
actually make inequality of access worse.
The median family income at
Virginia is $155,500, and 67 percent of students come from the upper
economic quintile. At Michigan the numbers are $154,000 and 66 percent, and
at the University of Minnesota — economically diverse by comparison —
$110,000 and 50 percent. By contrast, the median family income at
Minnesota’s private colleges is $83,000, or slightly below the state median.
Unsurprisingly, a recent
study shows that affluent students disproportionately benefit from
scholarships and grants offered at these flagship public institutions. Over
time these universities have become more selective, more dependent on
tuition revenue as state funding has been reduced, and thus less accessible
to many of the lower-income students they were ostensibly intended to serve.
They behave very much like elite private colleges and universities.
Here is almost certainly
what would happen if these public universities were to become tuition-free:
The absence of tuition would sharply increase the number of applications
they received and would make them even more selective than they are now.
Already Virginia and Michigan accept fewer than 30 percent of their
applicants.
Unless those elite
universities completely changed their admissions practices, an increase in
selectivity would benefit primarily the high-achieving students who attend
private and well-funded suburban high schools. Nothing in the "free tuition"
plans addresses the capacity of these universities to enroll more students,
so the applicants most likely to be squeezed out would be those from
precisely the economic backgrounds that the plans are intended to help.
Nor does anything in these
plans address the quality and efficiency of education provided at public
institutions, so the graduation rates at the less selective, woefully
underfunded institutions would remain low or get lower. The current six-year
graduation rate at four-year Minnesota state universities is 49 percent.
Among students of color it is 44 percent. More than half of the students who
would attend such a college free would not receive a degree from that
college.
Absent the ability to charge tuition, and
given the likelihood that federal and state subsidies would be unable to
keep pace with rising costs, the most likely outcome is that these already
low graduation rates would decline over time. Absent any plan to address
racial inequality, the achievement gap between white students and students
of color would persist. There is no simple way to deal with the problem of
inequality of access to education in the United States, given the deep and
complex roots of that problem in everything from racism to fiscal policies
that have come increasingly to favor the wealthy. But any policy change
should focus on ensuring that the greatest benefit accrues to those who are
most in need, that is, those from the lower income levels.
Continued in article
Bob Jensen's threads on how free college in parts of Europe is only available
to the elite Top 1/3 of Tier 2 (high school) graduates. No nation in the world
offers free college to everybody ---
http://faculty.trinity.edu/rjensen/HigherEdControversies.htm#Tertiary
The full text of the Algorithmic Accountability Act at Tier 1
(bias and discrimination) ---
https://www.wyden.senate.gov/imo/media/doc/Algorithmic
Accountability Act of 2019 Bill
Text.pdf?utm_campaign=the_algorithm.unpaid.engagement&utm_source=hs_email&utm_medium=email&utm_content=71709273&_hsenc=p2ANqtz-99rh4-06SEttevQ9yueP-C2akIdzUDPPfW0laDxMKu6MYwaiOlt7l3GaWF1JFSKDNF0QqnzlcjvEBkR_mukoT813PcUw&_hsmi=71709273
Jensen Comment on Tiers 2 to Infinity
The most controversial aspect of products and services is, and will continue to
be, the degree to which the provider is responsible for intentional or
unintended misuse. Exhibit A is a making a gun or vehicle manufacturer
responsible for the products use in every murder or suicide or accidental
killing.
There are obvious limits of accountability. For
example, if you made road builders responsible for every
accident on their roads nobody would build roads.
In nearly all instances there's a gray zone
regarding fraud and negligence such as when opiate drug manufacturers exploited
the addictive nature of their products. Such gray zones leave legal and civil
court discretions regarding intent.
What naive legislators want is riskless products and
services to a point where banning risk leads to great societal harm. Exhibit A
is where banning all chemical fertilizers and insecticides that have potential
health risks (however small) leads to enormous food shortages and costs of food
purchase. Exhibit B would be where the banning of all opiate drugs creates
extreme suffering of patients recovering from heavy surgeries or long-term
suffering from cancer or other diseases where all less risky alternatives are
either ineffective or are enormously expensive.
When it comes to AI and other algorithmic technology
really ignorant lawmakers who want riskless living and do not consider that
there may be risks of better living and a better economy for all.
Sometimes risks are necessary for improved living.
My best example that I use over and over is my
wife's spine surgeon of last resort in Boston. He's willing, amongst constantly
circling lawyers, to do spine surgeries that 95% or more of the spine surgeons
in the USA are unwilling to perform because risks to the patient (paralysis) and
risks to the surgeon (lawsuits) are so high. My wife is ever-thankful that there
are a very few surgeons like this Boston surgeon who are willing to take risks
to alleviate extreme pain and suffering of patients.
If you really want to academically debate technology
consider the recent genetic experiments in China where human genes are added to
brains of monkeys. If success is confirmed the excitement becomes the ability to
genetically improve human intelligence and overcome disabilities in learning.
Dark shadows of Hitler's quest for a master race come to mind on the negative
side of this debate. Bright lights of curing mental illness, depression, and
retardation come to mind on the positive side of this debate.
Life is truly complicated. The Algorithmic
Accountability Act, especially at Tiers 2 and beyond, could do lots of good
things for society in the short term and lots of bad things for the long term.
Will nations like Russia and
China and North Korea exploit opportunities created in the passing of
Algorithmic Accountability Acts in North America and the European Union?
There's no sustainability for laws seeking to
eliminate all risks of living.
Riskless living is for lemmings that are happily
all alike and marching toward an unforeseen cliff!
Riskless Living: The U.K.'s Proposed Conception of Big Brother for Real
(Tier 2 and beyond)
The UK proposed sweeping new regulations that would hold tech
companies accountable for the spread of extremist content, misinformation, hate
crimes, and dangerous material aimed at children ---
Click Here
Jensen Comment
Given the risks of lawsuits from agencies in 200+ nations of the world and
billions of Internet users in the world, there is only one solution remaining
--- it's time to create Big Brother as a censor all information (including
photographs and artwork) passes through it being placed on the Internet. Big
Brother will be protected from lawsuits. No other medium of communication can
withstand the risk of trillions of dollars in lawsuits.
The question remains about censorship of information not on the Internet such
as newspapers, media broadcasters, and speakers everywhere including college
campuses and town halls. They too probably cannot stand up against the lawyers
of the world no matter what constitutional protections are put into place.
George Orwell had it right even though the "sweeping
new regulations" arrived in 2019 instead on 1984 ---
https://en.wikipedia.org/wiki/Nineteen_Eighty-Four
It's ironic that Orwell was a British writer when the imagined 1984 world was
introduced for real in the United Kingdom in 2019.
The most controversial link in all of this is the link between a "producers"
and extremist "customers" who actually commit the hate crimes. It's analogous to
making the manufacturer of a gun, a car, a knife, an oil painting, a poem, porn,
a telephone, a Website, or whatever that can be held accountable for the hate
crime that it did actually commit itself. To be safe Big Brother will ban
virtually any risk. The only good news is that lawyers will starve on the vine
in Big Brother's world.
I'm glad I'm not young enough anymore witness a Big Brother society actually
becomes so paranoid that it builds an fearsome Big Brother Political Correctness Wall
shielding us from all risks.
**How to Mislead With Statistics
Kamala Harris’s plan to dramatically increase teacher salaries, explained
https://www.vox.com/policy-and-politics/2019/3/26/18280734/kamala-harris-2020-election-policies-teachers-salaries
Jensen Comment
The article is not misleading in terms of a case for raising teacher salaries.
However, it's misleading on the funding side. Firstly it requires that states
buy into the raising the money. The clinker is that many states themselves are
on the edge of bankruptcy, especially those states that are already losing
businesses and people due to high taxation. Exhibit A is Illinois, but there are
many others ---
https://www.statedatalab.org/
Raising teacher salaries has been a priority in virtually all states every year
for as long as I can remember. It's gotten much more difficult, however, since
Medicaid and pension obligations are higher priorities raising teacher pay.
She also proposes raising taxes on wealthy estates. The article is misleading
because it does not discuss the negatives in trying to raise billions in this
manner. Firstly, some of the mega wealthy estates are usually moved into
tax-free foundations that do great things such as the Bill Gates Foundation that
contributes billions to world health and technology efforts for bringing
electric power and sanitation to the poorest people on earth. My point here is
that efforts to ban tax-free foundations ends up pitting good causes (think
teacher pay, world health, world sanitation, university endowments, etc.)
against one another. Personally, I don't think relatively large USA teacher pay
increases takes priority over some of the neediest causes in the world.
There's a bit of robbing school districts to pay teachers in the Kamala
Harris proposal. The wealthy in the USA invest over a trillion dollars in
tax-exempt bonds that, in turn, fund municipalities and school districts al low
interest rates on bonds that are financially risky. One reason progressives have
not eliminated the so-called muni bond market is that towns and schools have
become so dependent upon this massive source of funding for land and buildings
in towns and school districts. The Kamala Harris proposal will sap much of the
funding for schools grounds and buildings to pay teachers. Schools are already
suffering from a lot of deferred maintenance and not enough classrooms to meed
rising demainds.
Paying teachers more to teach in falling down
buildings is not the answer.
France scrapped a wealth tax plan
for millionaires because it was making so little money ---
https://www.businessinsider.com/france-scrapped-extreme-version-alexandria-ocasio-cortezs-tax-plan-millionares-2019-3
Kamala Harris ignores the fact that raising the wealth tax has already been
prioritized by her opponents --- mostly to pay for Medicare-for-All and
Guranteed Annual Income for the Poor.
Wealth Tax ---
https://en.wikipedia.org/wiki/Wealth_tax
Even if wildly successful (which is impossible) Senator Warren's wealth tax would only pay $2.75
trillion of the $30+ trillion cost ten-year cost of Medicare-for-All
Elizabeth Warren's proposed wealth tax would raise $2.75 trillion over a
ten-year period from about 75,000 families, or less than 0.1 percent of U.S.
households ---
https://www.cnbc.com/2019/01/24/elizabeth-warren-to-propose-new-wealth-tax-economic-advisor.html
Jensen Comment
This could have all sorts of economic consequences. One is that most of those
75,000 wealthy USA families have their wealth tied up in long-term investments
like real estate (think of Trump hotels, Ted Turner's ranches in Australia,
Amazon's many shares owned by Jeff Bezos), etc. Warren's Wealth tax could force
liquidation of these long-term investments to pay the $2.75 trillion wealth tax.
If you want your top millionaires and billionaires to move out of the USA
this is a sure-fire way to wave bye bye to them and the $2.75 trillion that
becomes uncollectable.
Wealthy taxpayers are probably
not worried with a conservative Supreme Court.
Arguably her proposal requires an amendment to the USA Constitution because her
wealth tax proposal is extremely disproportional.---
https://en.wikipedia.org/wiki/Wealth_tax#United_States
You can read more about wealth taxes at
https://en.wikipedia.org/wiki/Thomas_Piketty
Kamala Harris announces $100B plan for black home ownership,
tackling racial wealth gap ---
https://www.blabber.buzz/conservative-news/609928-kamala-harris-announces-100b-plan-for-black-home-ownership-tackling-racial-wealth-gap-special?utm_source=c-alrt&utm_medium=c-alrt-email&utm_term=c-alrt-GI
Giving them free health care, free medications, guaranteed annual income,
reparations awards, free food, and lower standards for college graduation just
isn't enough. The bounty for being black just keeps piling on.
PS
Those 75,000 wealthy taxpayers now invest in hundreds of billions in tax-exempt
bonds (called municipal bonds) that underlie the building of most schools and
municipal buildings in the USA. The muni bond market would nosedive if most of
those 75,000 people sold their tax-exempt bonds and moved these hundreds of
billions in investments off shore on their way out of the USA. That's not a cost
that the naive Elizabeth Warren factored into her proposed wealth. What's the
incentive for a billionaire who moved to Switzerland to continue to invest
hundreds of millions of dollars in the USA muni market?
I suspect that Kamala
Harris already knows her proposals for wealth taxes and teacher pay raises would
be disasters for states on the edge of bankruptcy trying to meet pension and
Medicaid obligations. It's more of a ploy to raise votes in a Democratic primary
race that's more and more competitive as to will spend the most taxpayer
dollars.
Elizabeth Warren Proposes Eliminating Student Debt for 42+ Million of
Americans ---
http://time.com/5575243/elizabeth-warren-student-debt/?utm_source=time.com&utm_medium=email&utm_campaign=the-brief-pm&utm_content=2019042217pm&xid=newsletter-brief
Jensen Comment
It's important to note that most of Europe's nations (think Finland,
Germany, Norway, Denmark, etc.) have free education and training, but they
limit the free support to the top 1/3 of high school graduates and don't
have college capacity to admit nearly 2/3 of all high school graduates. The
USA wants to make it free for anybody who wants it. This is a lovely thought
that the nation just cannot afford. Here's how Europe and other OCED nations
support college and training realistically ---
https://en.wikipedia.org/wiki/List_of_countries_by_tertiary_education_attainment
Kamala Harris’s plan to dramatically increase teacher salaries by $25,000 for
every teacher in the USA
https://www.vox.com/policy-and-politics/2019/3/26/18280734/kamala-harris-2020-election-policies-teachers-salaries
Bernie Sanders: "You’re Damn Right We’re Going to Destroy Private Health
Insurance" ---
Click Here
And he will limit the number of doctors by regulating what they're allowed to
earn.
Virtually all the 2020 Democratic Party presidential
candidates are proposing spending trillions on green initiatives, free
health care, free college or training for anyone wanting it, guaranteed annual
income, reparations for African and Native Americans, more food stamps,
housing-for-all, and
vastly increased housing subsidies for any resident of the USA.
The proposed spending is over $100 trillion dollars and
rising daily before the November 2020 election. It's a political race to
see who can spend the most.
Bernie Sanders’s housing-for-all plan,
explained ---
https://www.vox.com/2019/9/19/20873224/bernie-sanders-housing-for-all
**How to Mislead With Statistics
Larry Summers ---
https://en.wikipedia.org/wiki/Lawrence_Summers
Larry Summers and Natasha Sarin:
The Washington Post: How Much Would a Wealth Tax Raise?
Maybe 1/8 of Democratic Party estimates?
https://www.washingtonpost.com/opinions/2019/04/04/wealth-tax-presents-revenue-estimation-puzzle/?utm_term=.ab0f70a968a9
Jensen Comment
I think it will be even less because of all the things wealthy people can do to
reduce or eliminate wealth taxes. Exhibit A is George Soros
So you want to tax the rich ---
https://theconversation.com/so-you-want-to-tax-the-rich-heres-which-candidates-plan-makes-the-most-sense-111945
Jensen Comment
To be honest I like most of this article, because it correctly raises doubts
about the AOC (income) and Warren (wealth) tax proposals. However, I think it
oversimplifies the Sanders' (inheritance) tax proposals. Firstly, it ignores how
wealthy estates can maneuver to greatly reduce Bernie Sanders' projected income
from the estate tax changes. Just like high income people can maneuver to avoid
the AOC income tax proposal, wealthy people can maneuver to protect themselves
from estate taxes. The first and most obvious ploy is to leave the USA just like
the wealthiest billionaire in the UK just moved to Monaco. The second ploy is to
move the bulk of the estate into Tax-Free Foundations like the moves of Bill
Gates, Warren Buffett, George Soros, and virtually all super wealthy
individuals. By the way these foundations do wonderful things that might get
bogged down in politics. For example, rather than donate so much of Bill Gates'
wealth to reducing diseases and improving sanitation worldwide Congress might be
more inclined to divert that money domestic causes. Also Congress might be less
inclined than Bill Gates to fund technology such as worm toilets that conserve
water worldwide.
Thirdly, it does not take all that much of a family farm or ranch or other
family business to be valued at $3.5 million. This could further strike a blow
to family businesses that are the backbone historically of the USA economy. For
example, families clinging to a $5 million family farm might be forced because
in inheritance taxes to sell to foreign corporations.
The bottom line is that all the 2020 candidates are advocating spending $100+
trillion dollars on such newer initiatives as free healthcare, free college
education, guaranteed income, $25,000 per year teacher raises (Harris),
reparations for American and Native Americans, etc. in addition to maintaining
or increasing existing safety nets such as food stamps, housing subsidies, and
financial aid for open border immigrants. All are good causes, but none of the
candidates has proposed a viable way to fund the new initiatives without
destroying the economic engine of the USA. Whereas
Nancy Pelosi has pleaded for setting of achievable goals none of the 2020
Democratic presidential candidates are listening to her.
Summers on the Wealth Tax ---
https://marginalrevolution.com/marginalrevolution/2019/10/summers-on-the-wealth-tax.html
Larry Summers is my favorite liberal economist
because even while maintaining his liberal values he never stops thinking
like an economist. That makes him suspect among the left but it means that
he is always worth listening to. The video below with Saez, Summers and
Mankiw (with Rampell moderating) is excellent throughout. I cribbed a number
of points from Summers:
“I have studied last week’s
twitter war very carefully and I have to say that I am 98.5% convinced by
the critics that the Zucman-Saez data are substantially inaccurate and
misleading.”
The arguments around political
power are not persuasive. Most of what is wrong with politics is because
that is what the people want (I’m filling in a bit here from comments
throughout). A wealth tax does nothing about corporate lobbying and would
increase the incentive to give to
political organizations. If you cut wealth at the top by 30% that wouldn’t
change relative political power in the slightest.
Wealth is up in large part
because interest rates are down which means that permanent income hasn’t
increased.
Forced savings programs like
social security and unemployment insurance mean that people at the bottom
need to save less and thus their wealth falls even as their welfare
increases.
A wealth tax increases the
incentive to consume instead of save and invest.
On employee stock ownership
plans: “When you put workers in control of firms and you give them
substantial control–see Israeli kibbutz’s, see Yugoslav cooperatives, see
universities where faculties have a powerful voice–the one thing you do
not get is expansion. You get more
for the people who are already there. That does not seem to be an attractive
position for progressives.”
In the Q&A Summers just goes to
town on Saez when Saez claims 90% tax rates are a great American invention.
“The people who were around in the Kennedy administration who were at least
as progressive as you are were united in the belief that 90% tax rates were
a bad idea….The number of people who paid those 90% tax rates was trivial
and it wasn’t because there weren’t a lot of rich people.” Greg Mankiw, who
gives a nice parable in his remarks, has to stifle a laugh as Summers lets
rip.
Also
see
https://mises.org/wire/problem-elizabeth-warren’s-wealth-tax-plan?utm_source=Mises+Institute+Subscriptions&utm_campaign=c9499c2e11-EMAIL_CAMPAIGN_9_21_2018_9_59_COPY_01&utm_medium=email&utm_term=0_8b52b2e1c0-c9499c2e11-228708937
Taxing The “Rich” Won’t Pay For Politicians’ Promises ---
https://taxprof.typepad.com/taxprof_blog/2019/10/taxing-the-rich-wont-pay-for-politicians-promises.html
Kamala Harris announces $100B plan for black home ownership,
tackling racial wealth gap ---
https://www.blabber.buzz/conservative-news/609928-kamala-harris-announces-100b-plan-for-black-home-ownership-tackling-racial-wealth-gap-special?utm_source=c-alrt&utm_medium=c-alrt-email&utm_term=c-alrt-GI
Giving them free health care, free medications, guaranteed annual income,
reparations awards, free food, and lower standards for college graduation just
isn't enough. The bounty for being black just keeps piling on.
The Atlantic: The Democratic Party Is Radicalizing ---
https://www.theatlantic.com/ideas/archive/2019/04/progressivism-making-democrats/586372/
AOC says paying for all these good things is no problem. She proposes simply
printing money for any worthy program.
Robert Redford: Don’t Fall for Political Distractions. Saving Our Planet Must
Come First ---
http://time.com/5574056/earth-day-2019-climate-change-politics/?utm_source=time.com&utm_medium=email&utm_campaign=the-brief-pm&utm_content=2019042217pm&xid=newsletter-brief
The Democratic Party is intent on destroying the economic
engine and capital markets of the USA.
The Washington Post: Capitalism in crisis: U.S. billionaires worry
about the survival of the system that made them rich ---
https://www.washingtonpost.com/politics/capitalism-in-crisis-us-billionaires-worry-about-the-survival-of-the-system-that-made-them-rich/2019/04/20/3e06ef90-5ed8-11e9-bfad-36a7eb36cb60_story.html
Listen to Big Rock Candy
Mountain' performed by Burl Ives ---
Big Rock Candy Mountain' Burl Ives
Democrats Running for President Are Staking Out Ground on Free College.
Here’s Where They Stand ---
https://www.chronicle.com/article/Democrats-Running-for/246185?utm_source=at&utm_medium=en&cid=at
Jensen Comment
I repeat that in OECD nations (think Finland, Denmark, Germany, and Norway) that
have free college or free job training, well over half of the Tier 2 graduates
are not even allowed to go to college or receive free
job training paid for by their governments. This makes "free college"
or "free training" affordable by limiting it only to top graduates . . .
https://en.wikipedia.org/wiki/List_of_countries_by_tertiary_education_attainment
Job training is mostly provided in the private sector of these capitalist
nations.
Most Democrats running for president in 2020 (including Joe Biden) want to
make college education and job training free for 350+ million residents of the
USA who choose to take advantage of free courses, including free learning
materials (think textbooks and computers). The estimated cost is staggering,
especially if you add in forgiveness of over $1.5 trillion in student debt.
Costs are difficult to estimate at this point in time without more details as to
the quality of the free education and training. If all flagship universities are
included, the cost of adding capacity for onsite courses and labs to serve any
and all applicants is staggering --- perhaps more than the current USA budget
for everything else including defense, Social Security, Medicaid, and Medicare.
The problem is compounded by over $100+ trillion for other proposed spending
trillions annually for Green Initiatives, Medicare-for-All (including long-term
care and free medications), housing-for-all, a $25,000 pay raise for every teacher in the USA,
guaranteed annual income for 350+ million residents of the USA, reparations for
African and Native Americans, and greatly expanded subsidized housing.
Are these presidential candidates really serious or are they just trying to
buy votes with promises that will destroy the economic engine of the USA and
ruin all pension funds (think TIAA and CREF) along with killing existing
stock, bond, and real estate markets?
I think Joe Biden should set himself apart by promoting realistic objectives
that can be attained without destroying the USA economy. At this point in time,
however, realistic objectives may ruin his chances for winning the nomination.
“You have to make decisions that you’re going
to reach certain goals, and some of our goals
we think are achievable”
Nancy Pelosi (when criticizing Alexandria's Green New Deal and
Basic (Guaranteed) Income and Medicare-for-All)
Click Here
Government Spending (as a percentage of GDP) on Colleges in the
US Is Higher than in the Countries with "Free" College ---
https://mises.org/wire/government-spending-colleges-us-higher-countries-free-college
Bernie Sanders’s housing-for-all plan,
explained ---
https://www.vox.com/2019/9/19/20873224/bernie-sanders-housing-for-all
**How to Mislead With Statistics
Study finds no relationship between pay for public university presidents and
money brought in from state appropriations or fund-raising ---
https://muse.jhu.edu/article/712610
Jensen Comment
Not only is this study misleading, it can possibly lead to behavior of
university presidents that is well known and horribly wrong with CEOs of
business firms. The problem is lag between efforts to increase funding and when
those increases come to fruition years later. In business basing executive
compensation based upon short time results can lead to disaster in terms of
long-term performance. I think a case can be made today that the recent burnout
of General Electric (GE) in part is due to too much focus on short-term
variables (think yearly earnings changes) that left GE unprepared to sustain
itself for the long haul.
WSJ: The Story of a Burned Out GE ---
https://www.wsj.com/articles/ge-powered-the-american-centurythen-it-burned-out-11544796010?mod=djcm_013019sm_us
. . .
The leadership meeting usually left executives refreshed, reassured that the
foundation of GE’s success was not the power turbines or the jet engines so
much as the people in that room, managers groomed in Crotonville who
believed they could enter any industry, anywhere and dominate it.
Now, as they shuffled out after Bornstein’s talk, many felt shock and
confusion. The reckoning had been a long time coming, and it was far from
over. GE had defined and outlived the American Century, deftly navigating
the shoals of depression, world war and the globalization of business. Even
when things were at their worst, its belief in its history and its prowess
made it feel titanic and impregnable. And, yet, unsinkable GE was taking on
water fast.
This article is based on scores of interviews with dozens of people directly
involved in these events. They include current and former board members,
senior executives and employees at GE headquarters and in its various
business units, as well as bankers and advisers employed by the company,
investors in its stock, customers for its products and corporate analysts
who evaluated its performance.
The reporting also reflects internal GE communications and documents,
including emails, slide presentations and videos. Publicly available
securities filings, court records, transcripts of meetings and previous
Journal articles were also used. The Journal reached out to the individuals
in this article and offered them the opportunity to comment.
Continued in a very long, depressing article
Jensen Added Comment
The problem in business is that investors are myopically focused on annual
changes in revenues and reported profits. Executive compensation, in turn, is
often disastrously based on short-term performance. To make matters worse, a
longer-term focus on product development and investment in infrastructure hurts
short-term performance metrics and may even leave
Short-term myopia is not always the case, especially when a
company is doing something exciting that changes the short-term focus of
investors. For years investors tolerated year after year of reported losses of
Amazon because those investors sensed something big was going to happen over the
long term --- and it did!
For years investors tolerated Tesla year after year of reported losses in
Tesla --- and nothing really big has happened yet.
But for companies like GE (that
could've crushed Tesla in the early years) and Sears
(that could've crushed Amazon in the early years)
managements were more focused on short-term earnings and short-term revenues.
And now we are staring forlorn at the rotting carcasses of GE and
Sears.
My point here is that if we're going to pay a university CEO
for short-term fund raising then it might be a disaster in terms of what that
university president might otherwise be trying to accomplish for longer-term
growth and sustainability.
Thus, I despise studies like the one focusing on short-tern
fund raising at
https://muse.jhu.edu/article/712610
Let your university president be a
Jeff Bezos rather than a Jeff Immelt ---
https://en.wikipedia.org/wiki/Jeff_Immelt
Beyond that there are all sorts of statistical inference
questions I would raise about the study reported at
https://muse.jhu.edu/article/712610
"Lack of correlation" does not mean there were not any number
of anecdotal successes of dogged high paid university presidents who worked
under difficult circumstances to eventually
bring home remarkable new funding and sustenance.
No competent statistician is going to conclude that we should
not longer pay university presidents high salaries because this particular study
concludes they cannot possibly be worth their high salaries.
I say garbage to the conclusions of the above study!
I was on the faculty of Trinity University (Texas) for 24
years, an institution with a remarkable endowment --- a university ranked Number
1 or 2 (by US News) for several decades among liberal arts
universities in the West. I've
witnessed time and time again where a current TU president obtained huge
gifts due primarily to the efforts of former TU presidents. And efforts of the
current TU president may not bear fruit until a succession of newer TU
presidents have taken over the reins.
Trinity University should do whatever it takes ethically to
sustain its Number 1 or 2 US News ranking, and
this entails a lot more than fund raising in the short term ---
https://www.usnews.com/best-colleges/rankings/regional-universities-west
**How to Mislead With Statistics: The Consumer Price Index
Moral Hazard ---
http://en.wikipedia.org/wiki/Moral_hazard
Consumer Price Index ---
http://en.wikipedia.org/wiki/Consumer_price_index
. . .
Confusion
It is apparent that much of the muddle in
discussing the merits of the different approaches arises from the
promiscuous mixing up of arguments about feasibility, about dislike or
approval of the way the index would move under a particular approach and
about principles of various, often incompatible, sorts. Feasibility is
naturally important. The difficulty of dealing with site values is obvious.
Statisticians in a country lacking a good dwelling
price index (which is required for all except the rental equivalent method)
will go along with a proposal to use such an index only if they can obtain
the necessary additional resources that will enable them to compile one.
Even obtaining mortgage interest rate data can be a major task in a country
with a multitude of mortgage lenders and many types of mortgage. Dislike of
the effect upon the behaviour of the Consumer Price Index arising from the
adoption of some methods can be a powerful, if sometimes unprincipled,
argument.
Dwelling prices are volatile and so, therefore,
would be an index incorporating the current value of a dwelling price
sub-index which, in some countries, would have a large weight under the
third approach. Furthermore, the weight for owner-occupied dwellings could
be altered considerably when reweighting was undertaken. (It could even
become negative under the alternative cost approach if weights were
estimated for a year during which house prices had been rising steeply).
Then, there is the point that a rise in interest
rates designed to halt inflation could paradoxically make inflation appear
higher if current interest rates showed up in the index. Economists'
principles are not acceptable to all; nor is insistence upon consistency
between the treatment of owner-occupied dwellings and other durables.
Clarity
Much would be gained if two sets of problems were
distinguished.*
What is the Consumer Price Index to measure? How
can that be achieved?
Another way of putting this is to distinguish:
What is the question that should be answered? This
is a matter for policy makers and other users of the Consumer Price Index.
How can it best be answered? This is a matter for the statisticians.
The three approaches should not be regarded as
rivals, they are different answers to different questions. One, or possibly
more, should be chosen. The three questions can be formulated as follows:
Opportunity cost. What is the change through time
in what would be the opportunity cost of the reference-period consumption of
the services of owner-occupied dwellings? Spending. What is the change
through time in the cash outlays that would correspond to the
reference-period cash outlays in respect of owner-occupied dwellings?
Transactions. What is the change through time in what would be the purchase
value of the reference-period net acquisition of owner-occupied dwellings by
consumers?
Which question is to be answered is, as just
stated, a policy matter, depending upon the purposes the index is to serve.
It is not an issue for statisticians to decide. Their job is the technical,
professional one of compiling one or more indexes that answer the selected
question or questions as well as possible, given the resources at their
disposal. In a perfect world this is how the owner-occupied dwellings issue
would be resolved. But the world is not perfect
Continued in Article
No one really denies that the CPI, as presently
calculated, understates the rate of inflation
Why the Consumer Price Index (CPI) is a Flawed Measure of Cost of Living
It's largely due to moral hazard caused by
government's incentives to understate inflation and cash flow increases in
things like Social Security
"Deconstructing ShadowStats. Why is it so Loved by its Followers
but Scorned by Economists?" by Ed Dolan, Econ Monitor, March 31, 2015
---
http://www.economonitor.com/dolanecon/2015/03/31/deconstructing-shadowstats-why-is-it-so-loved-by-its-followers-but-scorned-by-economists/
It is hard to think of a website so loved by its
followers and so scorned by economists as John Williams’
ShadowStats, a widely cited source of alternative
economic data on inflation and other economic indicators. Any econ blogger
who has ever written a line about inflation is familiar with ShadowStats.
Time and again, readers cite it in comments, not infrequently paranoid in
their tone and rude in their language. Brief replies that cast doubt on some
of more extreme claims made by ShadowStats fans don’t seem to have much
effect. After a
recent round of comments, I promised the editor of one website to
undertake a thorough deconstruction of ShadownStats. Here is the result.
What ShadowStats Gets Right: The CPI is a
Flawed Measure of the Cost of Living
ShadowStats is Williams’ attempt to provide an
alternative to the official consumer price index (CPI), which he views as a
flawed measure of what members of the general public have in mind when they
think of the cost of living. Let me start by saying that although I share
the skepticism of many economists about the specific numbers published on
ShadowStats, I agree that the official data do not tell the whole story. I
support Williams’ attempt to provide an alternative to the official consumer
price index that more closely reflects pubic perceptions of inflation.
Here,
in his own words, is
how Williams explains his undertaing:
In the last 30 years, a growing gap has been
obvious between government reporting of inflation, as measured by the
consumer price index (CPI), and the perceptions of actual inflation held
by the general public. Anecdotal evidence and occasional surveys have
indicated that the general public believes inflation is running well
above official reporting . . .
Measurement of consumer inflation traditionally
reflected assessing the cost of maintaining a constant standard of
living, as measured by a fixed-basket of goods. Maintaining a constant
standard of living, however, is a concept not popular in current
economic literature, and certainly not within the thinking or the
lexicon of the Bureau of Labor Statistics (BLS), the government’s
statistical agency that estimates and reports on consumer inflation. . .
Individuals look to the government’s CPI as a measure of the cost of
maintaining a constant standard of living, as well as measuring that
cost of living in terms of out-of-pocket expenses. Without meeting
those parameters, an inflation measure has limited, if any, use for an
individual.
Williams is right about the gap between public
perceptions of inflation and official indicators. As a recent series of
posts on inflation expectations on the Atlanta Fed’s
Macroblog noted, “Inflation surveys of households
reveal a remarkably wide range of opinion on future inflation compared to
those of professional forecasters. Really, really wide.” According to
Macroblog, household expectations of inflation for the coming year
consistently average two percentage points higher than those of professional
forecasters, and some 13 percent of household respondents report inflation
expectations of 10 percent or higher even at a time when professional
forecasts fall short of 2 percent.
In technical terminology, we refer to a cost of
living index based on the changing cost of a fixed-proportion basket of
goods that themselves remain unchanged over time as a Laspeyres index
without quality adjustment. Williams is again correct when he says that the
official CPI, following mainstream academic thinking, has gradually evolved
away from the Laspeyres concept toward a measure of the cost of a changing
basket of goods that gives equivalent satisfaction as the prices,
quantities, and qualities of the goods that consumers buy change over time.
The substitution issue.
One of Williams’ key objections to the CPI is that instead of holding the
cost-of-living basket unchanged for long periods, the BLS allows for
frequent changes in its composition. Some changes in the consumer market
basket occur when goods like audio cassette players become technically
obsolete and new goods like cell phones appear on the market, but those are
not the ones that Williams takes issue with.
What he finds more objectionable are changes in
composition of the market basket that stem directly from changes in prices,
as, for example, when people eat more chicken because beef becomes
unaffordably expensive. To many people, fiddling the market basket to give
more weight to the goods whose prices increase least and less to those whose
prices increase most sounds like cheating. They see it as if a teacher tried
to impress a tenure committee with high test student scores by letting the
smart kids take the test several times each while sending their
slow-learning classmates home on testing day.
Mainstream economists have a standard response: If
we did not account for changed consumption patterns in response to changed
prices, they say, we would overstate the cost of maintaining a constant
level of satisfaction. Consider an example. Last week you went to the
supermarket and bought 5 pounds of chicken at $2 a pound and 5 pounds of
steak at $5 a pound, $35 total. This week you go to the supermarket and find
that chicken still costs $2 but steak has gone up to $10. There is no
question that the new prices leave you worse off than you were the week
before, but how do you react?
You would need $60 to buy the same basket of goods
that you bought last week for $35. In reality, you might not have that $60
in your wallet or purse, but if I gave you a $60 coupon that you could spend
only at the meat counter, you would probably not spend it on the same basket
of goods you bought last week. Instead, you might buy, say, 10 pounds of
chicken and 4 pounds of steak. However, since $60 would be enough to buy
your previous selection if you wanted to, we could conclude that you would
change the mix only if the new $60 selection gave you more satisfaction than
the original one.
Experience shows that if you put a large number of
consumers in this situation and average their behavior, they will shift
their consumption toward chicken, even though some individuals might stick
with the original mix. Those who did shift would be better off with $60 and
the new prices than with $35 and the old prices, and the ones who don’t
shift are no worse off. In that sense, $60 overstates the increase in income
the average consumer would need to reach the same level of satisfaction as
before the price change.
Your cost of living has gone up, and that hurts,
but just how much has the increase in the price of steak raised
your cost of living? By the ratio of 60/35, a 70 percent increase, or by
less than that? It depends on what you mean by the cost of living. If you
mean the cost of buying a fixed market basket (the popular conception), then
the 70% is correct. If you mean the cost of maintaining a fixed level of
satisfaction, then 70% is an overstatement.
The quality issue. In
addition to adjusting the relative quantities of goods in the consumer
market basket over time, the BLS adjusts the CPI for changes in the quality
of goods. The rationale for doing so is that failure to account for quality
improvements would cause a further overstatement of the increase in spending
that needed to maintain a constant level of consumer satisfaction.
Consider tires for your car. In the old days, you
were lucky if a set of bias-ply tires lasted 30,000 miles. Today, a decent
set of radial tires will go 60,000 miles or more, and give you a better ride
along the way. So, if the price of a set of tires has increased from $100 to
$400, what has been the impact on your cost of living? If you calculate the
cost per tire, without accounting for quality, tires are four times more
expensive than they used to be. If you calculate the cost per mile, they are
only twice as expensive.
Williams does not necessarily object to adjusting
for quality changes when they are objectively measurable, like package size
or the number of miles you get from a set of tires. However, he argues that
the BLS exaggerates the importance of quality by making adjustments for
changes that consumers don’t really care about. In
one post, he uses the example of two computers,
purchased ten years apart. Yes, the newer computer has many extra
features—more memory, a faster processor, a sharper display, and so on, each
of which is quantifiable. However, not all consumers care about the new
features. If you just use your computer for e-mail and browsing the web, and
not for running big financial spreadsheets or high-powered gaming, who cares
about processor speed? The old model does the job just as well.
Other issues. Williams
has a number of other criticisms of the CPI beyond the substitution and
quality issues. In particular, he takes issue with the way the BLS measures
housing prices and medical costs. Without going into detail, in both cases
Williams favors an out-of-pocket approach to housing and medical costs as
being more in tune with the general public’s concept of the cost of living.
I think it is fair to say that mainstream economists agree that these two
items, which loom large in household budgets, are particularly difficult to
measure, although not everyone agrees with the way Williams would like to
see them handled. I hope to deal with these issues in a future post, but
this one will focus on the basics.
Where ShadowStats goes wrong: How great is
the understatement?
No one really denies that the CPI, as presently
calculated, understates the rate of inflation
compared to a measure based on a fixed basket of unchanged goods. Rather,
what many economists, myself included, find hard to accept is Williams’
estimate of the degree of understatement. The following chart,
reproduced by permission and updated monthly on ShadowStats.com, claims that
since the early 1980s, the CPI has been understating the true rate of
inflation by an ever increasing margin that now amounts to some 7 percentage
points.
Continued in article
Jensen Comment
It's amazing that labor unions have not had more power in Washington DC to
reduce the understatement of inflation. Understating inflation greatly decreases
union negotiating power for raising wages in the public and private sectors.
Note that the moral hazard of understating inflation affected the Obama years
in the presidency, but President Obama certainly did not invent the strategy
that for many years preceded his term of office
Bob Jensen's threads on economic statistics ---
http://www.trinity.edu/rjensen/Bookbob1.htm#EconStatistics
**How to mislead with statistics and econometrics and
obstruct economics learning
The Atlantic: Behavioral economics upended the idea that humans act solely
in their rational self-interest. So why do most undergrads barely learn anything
about the field?
https://www.theatlantic.com/education/archive/2018/12/why-do-econ-classes-barely-mention-behavioral-economics/578092/
In the late 1800s, one of
the most enduring fictional characters of all time first appeared on the
scene. No, I am not talking about Sherlock Holmes or Oliver Twist, but a
less well-known though arguably more influential individual: Homo
economicus.
Literally meaning
“economic man,” the origins of the term Homo economicus are somewhat
obscure—early references can be traced to the Oxford economist
C. S. Devas in 1883—but
his characteristics have become all too familiar. He is infinitely rational,
possessing both unlimited cognitive capacity and access to information, but
with the persona of the Marlboro Man: ruggedly self-centered, relentlessly
materialistic, and a complete lone ranger. Homo economicus, created
to personify the supposedly rational way humans behave in markets, quickly
came to dominate economic theory.
But then in the 1970s, the
psychologists Daniel Kahneman and Amos Tversky made a big discovery. The
academics drew on psychological evidence to show that the actions of human
beings deviate from the ironclad rationality of
Homo economicus
in all sorts of ways: People make systematic errors of judgment, such as
being excessively attached to what they own, and yet are also more generous
and cooperative than they’re given credit for. These insights led to the
founding of a new field, behavioral economics, which became a household name
10 years ago, after Cass Sunstein and Richard Thaler published the
best-selling book
Nudge
and showed how this new understanding of human behavior could have major
policy consequences. Last year, Thaler won the Nobel Prize in Economics, and
promised to spend the $1.1 million in prize money “as irrationally as
possible.”
But despite the
fanfare, Homo economicus remains a stubbornly persistent part of the
economics curriculum. While it is fashionable for most economics departments
to have courses on behavioral economics,
the core requirements in economics
at many colleges are usually limited to only two substantive courses—one in
microeconomics, which looks at how individuals optimize economic decisions,
and another in macroeconomics, which focuses on national or regional markets
as a whole. Not only is the study of behavioral economics largely optional,
but the standard textbooks used by many college students make limited
references to behavioral breakthroughs. Hal Varian’s Intermediate
Microeconomics devotes only 16 of its 758 pages to behavioral economics,
dismissing it as a blip in the grand scheme of things, an “optical illusion”
that would disappear “if people took the time to consider choices
carefully—applying the measuring stick of dispassionate rationality.” The
staple textbook on macroeconomics, written by Gregory Mankiw, gives
behavioral approaches even shorter shrift by scarcely mentioning them at
all.
Instead, the overwhelming majority of courses that students take in
economics are heavily focused on statistics and econometrics. In 2010, the
Institute for New Economic Thinking
convened a task force
to study the undergraduate economics curriculum, following up on a report
from 1991. What
changed in the intervening years, it found, was “an increase in mathematical
and technical sophistication” that was “not sufficient to foster habits of
intellectual inquiry.” In other words,
Homo economicus is going strong in lecture halls and textbooks across
the countryContinued in article
December 16, 2018 reply from Tom Dyckman
Bob, In
your comments on behavioral economics. I expected to see a reference to Dick
Thayler's 2015 Nobel Award in Economics most recently described in his book
"Misbehaving, published by Norton (2015) and an earlier book, Nudge, on
which he was a coauthor. I would also note that while he has been a faculty
member on the business faculty at Chicago for some time, he initially got
interested in the field and did - what has been described as his best work -
earlier at Cornell.
Bob Jensen's threads on what went wrong in accountancy
research ---
http://faculty.trinity.edu/rjensen/theory01.htm#WhatWentWrong
**How to Mislead With Statistics
"The ‘Wage Gap’ Myth That Won’t Die: You have to ignore many variables to
think women are paid less than men. California is happy to try," by Sarah
Ketterer, The Wall Street Journal, September 30, 2015 ---
http://www.wsj.com/articles/the-wage-gap-myth-that-wont-die-1443654408?mod=djemMER
When it comes to economically foolish laws,
California is second to none. A good example is the California Fair Pay Act,
which Gov. Jerry Brown is expected to sign in coming days.
This bill, which the California senate unanimously
passed in August, is a state version of the Paycheck Fairness Act that the
U.S. Congress rejected in 2014. Like its national counterpart, it is an
aggressive attempt to eradicate a wage gap between men and women that is
allegedly due to discrimination in the workplace. But this wage gap is
illusory, and the legislation will have unintended consequences, including
for women.
The Fair Pay Act will prohibit employers from
paying men and women different wages for “substantially similar work.” At
first glance, this prohibition might appear reasonable: Government data for
2014 show that women in California earn, on average, 84 cents for every
dollar earned by men. (Nationally, women earn about 79 cents for every
dollar earned by men.)
But a closer look reveals a different picture. The
Bureau of Labor Statistics (BLS) notes that its analysis of wages by gender
does “not control for many factors that can be significant in explaining
earnings differences.”
What factors? Start with hours worked. Full-time
employment is technically defined as more than 35 hours. This raises an
obvious problem: A simple side-by-side comparison of all men and all women
includes people who work 35 hours a week, and others who work 45. Men are
significantly more likely than women to work longer hours, according to the
BLS. And if we compare only people who work 40 hours a week, BLS data show
that women then earn on average 90 cents for every dollar earned by men.
Career choice is another factor. Research in 2013
by Anthony Carnevale, a Georgetown University economist, shows that women
flock to college majors that lead to lower-paying careers. Of the 10
lowest-paying majors—such as “drama and theater arts” and “counseling
psychology”—only one, “theology and religious vocations,” is majority male.
Conversely, of the 10 highest-paying
majors—including “mathematics and computer science” and “petroleum
engineering”—only one, “pharmacy sciences and administration,” is majority
female. Eight of the remaining nine are more than 70% male.
Other factors that account for earnings differences
include marriage and children, both of which cause many women to leave the
workforce for years. June O’Neill, former director of the Congressional
Budget Office, concluded in a 2005 study that “there is no gender gap in
wages among men and women with similar family roles.” Time magazine reported
in 2010 that in 98% of America’s largest 150 cities, including my hometown
of Los Angeles, single women under 30 actually earned, on average, 8% more
than their male counterparts.
Ms.
O’Neill and her husband concluded in their
2012 book, “The
Declining Importance of Race and Gender in the
Labor Market,” that once all these factors are
taken into account, very little of the pay
differential between men and women is due to
actual discrimination, which is “unlikely to
account for a differential of more than 5
percent but may not be present at all.”
What
California’s Fair Pay Act will do,
however, is make the state, already notorious
for regulation and red tape, a more difficult
place to do business. Companies must now ensure
that every penny of wage differential between
the men and women they employ is attributable to
bona-fide differences in education, training,
experience, quantity or quality of work, and so
on. Referring to the countless factors at play,
Harvard economist Claudia Goldin has said “it’s
not checkable.” Yet even attempting to do so
will only add to companies’ already substantial
regulatory-compliance budgets.
Some of
these factors—quality of work, for instance—are
inevitably subjective, yet trial lawyers will
swoop in to turn every conceivable pay
difference into a lawsuit. Employers who cannot
“prove” objectively that one employee’s work was
better than another’s may face costly penalties.
Many will surely pay to settle these lawsuits
instead of taking them to court.
Continued in article
Jensen Comment
It will be interesting to see how this law plays out in tenure decisions at the
most prestigious universities in California. For example, my 2012/2013 version
of the Hasselback Directory shows that 27% are women in Stanford's accounting
program. The proportions appear to be no better or even worse in the other
highly prestigious accounting programs in California universities.
It will take years to track the impact of the Fair Pay Act in
California's universities, but evidence may mount up more quickly in the
outcomes of lawsuits in universities. This probably sounds sexist, but the
tenured women I've worked with as a colleague in four universities across 40
years of my full-time faculty career tended to work as hard or harder than the
men in the classroom but not as hard at research and publishing in accounting
research journals. Of course times have changed in recent years. and we see a
rise in the proportions of women authors in our top accounting research
journals.
The tenured women in very prestigious accounting programs tend
to rival the men in research and publication even if they are more of a minority
in those prestigious programs. I think that greater focus on teaching by tenured
women comes in colleges and universities that are not in the Top 25 universities
in the US News rankings.
My point is that the Fair Pay Act in
California may impact how prestigious universities grant tenure and performance
pay based upon tradeoffs between research versus teaching. In prestigious
universities outstanding research performance is now a necessary condition for
tenure. Litigation following the Fair Pay Act may make outstanding research
less necessary for outstanding women teachers.
Will I be in trouble for thinking like
this? Almost certainly!
Bob Jensen's threads on the history of women in the
accounting profession are at
http://www.trinity.edu/rjensen/bookbob2.htm#Women
**How to Mislead With Statistics
The Left Is Lying About Why Life Expectancy Is Declining ---
https://therevolutionaryact.com/left-lying-life-expectancy/
. . .
There isn’t a single piece of information produced by the CDC yesterday that
would point to a deteriorating health care system or a poorly functioning
one as the cause of the decrease in life expectancy.
In fact, the opposite may be true. For example, although the overall life
expectancy dropped, the death rate amongst members of every age group except
25-44 year-olds and those over 84 years of age actually improved. Indeed, in
those groups engaged in greater health care consumption and therefore more
impacted by its quality (the 45-74 year olds) the mortality actually
dropped.
And although one could correctly argue that 85 year-olds and older are also
consumers of healthcare, the issues at play in this group are much more
complicated and no conclusion could be gleamed from the data available. It
was in those age groups that are not large consumers of health care where
the mortality rate rose.
So, if it isn’t healthcare, what could be causing the death rates of 25-44
year-olds to rise so precipitously? The CDC, Dr. Raj, and even the Wall
Street Journal
answered
this question: accidents and suicides made for a rising incidence of deaths,
with smaller increases from pneumonia and influenza.
Indeed, for the two biggest killers and the two most directly affected by
the quality of healthcare delivered — heart disease and cancer — the death
rates diminished markedly. (See Tables below.)
Continued in article
Bayesian Probability ---
https://en.wikipedia.org/wiki/Bayesian_probability
**How to Mislead Without Statistics: A Challenge for
Bayesians
Business Insider talked to psychologists to learn why people think they have a
shot at winning, despite the near-impossible odds ---
https://www.businessinsider.com/powerball-odds-why-people-think-theyll-win-2018-10#even-when-we-lose-we-think-were-just-short-of-winning-3
Jensen Comment
Probably the biggest mistake is thinking a succession of losses increases the
odds of winning --- thus keeping players clinging to a slot machine or throwing
the dice until morning's daylight or buying more and more lottery tickets after
a long string of losses.
There's a difference between buying a dream with one
lottery ticket (and expecting to lose with near certainty) and buying 20+
lottery tickets (and expecting you're due to win for a change).
There is a way of winning with certainty in some games by
more than doubling the bet with each succession of plays (known as the St.
Petersburg Paradox), but casinos and home poker players ban this by placing
upper limits on bets. In lotteries even millionaires cannot afford to follow a
SPP strategy.
The only real winners over time in a casino are the owners
of the casino, because odds always favor the casino over time.
The casino can of course lose to the one-time player who
gets lucky one time.
Will half of our colleges and universities go bankrupt or otherwise fail
within a decade?
Harvard: Christensen Scorecard: Data visualization of US postsecondary
institution closures and mergers ---
https://mfeldstein.com/christensen-scorecard-data-visualization-of-us-postsecondary-institution-closures-and-mergers/
Jensen Comment
This, of course, is highly uncertain with respect to numbers and timing?
An interesting question for small private colleges will be the impact of free
college that some 2020 Democratic presidential candidates are promising.
Perhaps you can start a debate on this among your students who understand
college financing.
An interesting subtopic is adult education and training in mega universities
such as Arizona State University that just spun off a for-profit online
universities seeking funding from employers like Starbucks and others.
http://faculty.trinity.edu/rjensen/crossborder.htm#EmployerSubsidized
Misleading Distortions
**How to
Mislead With Statistics (Distortions)
Tesla sales in China sank 70% in October because of the US-China trade war
---
https://www.businessinsider.com/tesla-sales-in-china-numbers-sank-us-china-trade-war-2018-11
Jensen Comment
You have to do a bit of simple algebra to figure out how many vehicles sold in
September before the 70% decline in October. If Tesla sold 211 vehicles after
the 70% decline in October then the September sales can be derived as 211/.3 =
703 vehicles. Put another way there was a decline of 492 Tesla vehicle sales in
October that could've arisen for various reasons.
My point is that it's very easy to mislead with percentages when dealing with
relatively small numbers. There were 770,000 electric vehicle sales in China for
the year 2017 ---
https://www.inkstonenews.com/business/can-china-become-no-1-electric-cars/article/2169999
It appears that Tesla only has a miniscule market share of the electric vehicle
market in China such that a decline of 492 Teslas sold in October is not such a
serious matter even if it were all caused by Trump's trade dispute with China.
Tesla has always been an insignificant player in China's electric car market.
And there can be many other reasons for October's sales decline of 492 Tesla
vehicles.
Once again I caution that correlation is not the "cause" that's implied in the
article.
Heterogeneity ---
https://en.wikipedia.org/wiki/Homogeneity_(statistics)
Also see ---
https://en.wikipedia.org/wiki/Heterogeneity_in_economics
**How to Mislead With
Statistics
Pandemics and persistent
heterogeneity ---
https://www.medrxiv.org/content/10.1101/2020.07.26.20162420v1
It
has become increasingly clear that the COVID-19 epidemic is characterized by
overdispersion whereby the majority of the transmission is driven by a
minority of infected individuals. Such a strong departure from the
homogeneity assumptions of traditional well-mixed compartment model is
usually hypothesized to be the result of short-term super-spreader events,
such as individual's extreme rate of virus shedding at the peak of
infectivity while attending a large gathering without appropriate
mitigation. However, heterogeneity can also arise through long-term, or
persistent variations in individual susceptibility or infectivity. Here, we
show how to incorporate persistent heterogeneity into a wide class of
epidemiological models, and derive a non-linear dependence of the effective
reproduction number R_e on the susceptible population fraction S. Persistent
heterogeneity has three important consequences compared to the effects of
overdispersion: (1) It results in a major modification of the early epidemic
dynamics; (2) It significantly suppresses the herd immunity threshold; (3)
It significantly reduces the final size of the epidemic. We estimate social
and biological contributions to persistent heterogeneity using data on
real-life face-to-face contact networks and age variation of the incidence
rate during the COVID-19 epidemic, and show that empirical data from the
COVID-19 epidemic in New York City (NYC) and Chicago and all 50 US states
provide a consistent characterization of the level of persistent
heterogeneity. Our estimates suggest that the hardest-hit areas, such as
NYC, are close to the persistent heterogeneity herd immunity threshold
following the first wave of the epidemic, thereby limiting the spread of
infection to other regions during a potential second wave of the epidemic.
Our work implies that general considerations of persistent heterogeneity in
addition to overdispersion act to limit the scale of pandemics.
**How to MIslead With
Statistics
NBER: Misdemeanor
Prosecution ---
https://www.nber.org/papers/w28600
Communities
across the United States are reconsidering the public safety benefits of
prosecuting nonviolent misdemeanor offenses. So far there has been little
empirical evidence to inform policy in this area. In this paper we report
the first estimates of the causal effects of misdemeanor prosecution on
defendants' subsequent criminal justice involvement. We leverage the as-if
random assignment of nonviolent misdemeanor cases to Assistant District
Attorneys (ADAs) who decide whether a case should move forward with
prosecution in the Suffolk County District Attorney's Office in
Massachusetts. These ADAs vary in the average leniency of their prosecution
decisions. We find that, for the marginal defendant,
nonprosecution of a nonviolent misdemeanor offense leads to large reductions
in the likelihood of a new criminal complaint over the next two years.
These local average treatment effects are largest for first-time defendants,
suggesting that averting initial entry into the criminal justice system has
the greatest benefits. We also present evidence that a recent policy change
in Suffolk County imposing a presumption of nonprosecution for a set of
nonviolent misdemeanor offenses had similar beneficial effects: the
likelihood of future criminal justice involvement fell, with no apparent
increase in local crime rates.
...
We
find that the marginal nonprosecuted misdemeanor defendant is 33 percentage
points less likely to be issued a new criminal complaint within two years
post-arraignment (58% less than the mean for complier" defendants who are
prosecuted; p < 0.01). We find that nonprosecution reduces the likelihood of
a new misdemeanor complaint by 24 percentage points (60%; p < 0.01), and
reduces the likelihood of a new felony complaint by 8 percentage points
(47%; not significant). Nonprosecution reduces the number of subsequent
criminal complaints by 2.1 complaints (69%; p < .01); the number of
subsequent misdemeanor complaints by 1.2 complaints (67%; p < .01), and the
number of subsequent felony complaints by 0.7 complaints (75%; p < .05). We
see significant reductions in subsequent criminal complaints for violent,
disorderly conduct/theft, and motor vehicle offenses.
Jensen Comment
Firstly, if less than half are "less likely" to repeat the offenses what happens
to those that are "more likely" to repeat offenses?
Secondly, there is such a wide
variety of misdemeanor crimes that lumping them together and looking at averages
can be misleading. Examples of misdemeanors include prostitution, drug
possession, non-violent mugging, vandalism, trespassing, public intoxication,
public defecation, reckless driving, indecent exposure, peeking tommery, and
shoplifting. Indeed not prosecuting some of these crimes might lower the odds of
repeating the offense, but I find it hard to believe that not prosecuting for
prostitution and shoplifting is going to lead to a lower likelihood of
prostitution and shoplifting.
Thirdly, not prosecuting some
crimes leads to lowering the possibility of such crimes. For example, if
shoplifting becomes too rampant big box stores (think Walmart and Target) may
either close down or certainly not build new stores in the parts of a community
where shoplifting is more likely. One time I shopped in a convenience
store in downtown Baltimore where customers were not allowed to touch the
merchandise until is was paid for. Clerks behind bulletproof glass retrieved the
merchandise and collected the money before the merchandise was passed in drawers
to customers. The effect of not prosecuting crimes thereby leads to higher
prices of merchandise and/or increased costs of having to travel much further to
shop in stores. More dramatically if
non-violent mugging and panhandling becomes more likely due to non-prosecution
tourists will avoid the high risk areas such that crime statistics go down for
the wrong reasons. Wiill tourists flock to Los Angeles and Portland,
Oregon since these cities no longer prosecute misdemeanors? The only people
flocking to such places may be drug addicts (which is what happened in San
Francisco).
Fourthly, and most importantly,
there may be huge changes in the data being collected. For example, if
misdemeanors are no longer prosecuted after January 1, 2022 it may well be that
victims may no longer report crimes and/or police arrest far fewer criminals
after January 1, 2022 because their arrests will not be prosecuted.
Hence, there may be increases in these
misdemeanors that are no longer getting into the crime database.
Lastly, the use of p-values in
statistical inference has fallen out of favor with the American Statistical
Association because they are too unreliable ---
Time to say goodbye to “statistically significant” and embrace uncertainty,
say statisticians ---
https://retractionwatch.com/2019/03/21/time-to-say-goodbye-to-statistically-significant-and-embrace-uncertainty-say-statisticians/
Three years ago, the American Statistical Association (ASA) expressed hope
that the world would move to a “post-p-value
era.”
The statement in which they made that recommendation has been cited more
than 1,700 times, and apparently, the organization has decided that era’s
time has come. (At least one journal had already banned
p values by 2016.)
In an editorial in
a special
issue of
The American Statistician out today, “Statistical Inference in the 21st
Century: A World Beyond P<0.05,” the executive director of the ASA, Ron
Wasserstein, along with two co-authors, recommends that when it comes to the
term “statistically significant,” “don’t say it and don’t use it.” (More
than 800 researchers signed onto a piece
published in Nature yesterday calling
for the same thing.) We asked Wasserstein’s co-author, Nicole
Lazar of the University of Georgia,
to answer a few questions about the move.
So the ASA wants to
say goodbye to “statistically significant.” Why, and why now?
In the past few years
there has been a growing recognition in the scientific and statistical
communities that the standard ways of performing inference are not serving
us well. This manifests itself in, for instance, the perceived crisis in
science (of reproducibility, of credibility); increased
publicity surrounding bad practices such as p-hacking (manipulating the data
until statistical significance can be achieved); and perverse incentives
especially in the academy that encourage “sexy” headline-grabbing results
that may not have much substance in the long run. None of this is
necessarily new, and indeed there are conversations in the statistics (and
other) literature going back decades calling to abandon the language of
statistical significance. The tone now is different, perhaps because of the
more pervasive sense that what we’ve always done isn’t working, and so the
time seemed opportune to renew the call.
Much of the
editorial is an impassioned plea to embrace uncertainty. Can you explain?
The world is
inherently an uncertain place. Our models of how it works — whether formal
or informal, explicit or implicit — are often only crude approximations of
reality. Likewise, our data about the world are subject to both random and
systematic errors, even when collected with great care. So, our
estimates are often highly uncertain; indeed, the p-value itself is
uncertain. The bright-line thinking that is emblematic of declaring some
results “statistically significant” (p<0.05) and others “not statistically
significant” (p>0.05) obscures that uncertainty, and leads us to believe
that our findings are on more solid ground than they actually are. We think
that the time has come to fully acknowledge these facts and to adjust our
statistical thinking accordingly.
Continued in article
**How to Mislead With
Statistics
Critique of an Article on
Machine Learning in the Detection of Accounting Fraud ---
https://econjwatch.org/articles/critique-of-an-article-on-machine-learning-in-the-detection-of-accounting-fraud
This
critique examines the results of an article that applies machine learning to
the detection of accounting fraud, published in Journal of Accounting
Research. Their key finding is that machine learning improved fraud
detection by 70 percent above a previously published logistic regression.
The authors make their data and Matlab code available at Github. Using their
files, I replicate their study. Upon closer inspection, we see that some
fraudulent firms were contained in both the training and test samples, which
improves the results of their model, but contradicts what was described in
the published paper. I asked the authors about this issue and gratefully
received a response. The response is quoted in the present critique. Getting
a proper assessment of the potential of machine learning is important, as
such techniques and models are relied upon by industry practitioners and
regulators, including the Securities and Exchange Commission
Jensen Comment
Their key finding is that "machine learning improved fraud detection by 70
percent above a previously published logistic regression." What is unsaid is how
good logistic rejection is in detecting fraud. The answer is that it's not all
that great relative to the most important techniques for detecting fraud such as
whistle blowing incentives and internal controls. In fairness, logistic
regression has gotten somewhat better ---
https://ieeexplore.ieee.org/abstract/document/5946108
However, accounting fraud is heavily dependent upon weaknesses in internal
controls combined with whistle blowing incentives to report fraud.
**How to Mislead With
Statistics
Those hidden factors
affecting research outcomes
https://marginalrevolution.com/marginalrevolution/2021/03/testing-todd.html
Researchers make hundreds of decisions about
data collection, preparation, and analysis in their research. We use a
many‐analysts approach to measure the extent and impact of these decisions.
Two published causal empirical results are replicated by seven replicators
each. We find large differences in data preparation and analysis decisions,
many of which would not likely be reported in a publication. No two
replicators reported the same sample size. Statistical significance varied
across replications, and for one of the studies the effect's sign varied as
well. The standard deviation of estimates across replications was 3–4 times
the mean reported standard error.
Jensen Comment
Accounting researchers rarely discover such problems because those researchers
rarely replicate the works of one another.
574 Shields Against Validity Challenges in Plato's Cave ---
http://faculty.trinity.edu/rjensen/TheoryTAR.htm
**How to Mislead With
Statistics
Here are the average
retirement savings by age: Is it enough? ---
https://www.marketwatch.com/story/here-are-the-average-retirement-savings-by-age-is-it-enough-2020-11-16?mod=home-page
Jensen Comment
The first thing to do is have your students explain the wide disparity of means
and medians in this data.
Next have students how outliers
can distort statistical inference.
Black Swans ---
https://en.wikipedia.org/wiki/The_Black_Swan:_The_Impact_of_the_Highly_Improbable
**How to Mislead With
Statistics
NYT: Air Travel Surges
by 123%! (Beware of Misleading Data Like That) ---
https://www.nytimes.com/2020/05/19/upshot/virus-economic-data-upended.html
Jensen Comment
Many business firms had earnings fall to zero or negative. Beware of future
reports of enormous percentage gains in earnings or sales. In statistics we warn
students to beware of denominator effects ---
http://faculty.trinity.edu/rjensen/MisleadWithStatistics.htm#Distortions
**How to Mislead With Statistics
Paradoxes of Probability & Statistical Strangeness
https://scitechdaily.com/paradoxes-of-probability-statistical-strangeness/?fbclid=IwAR3JlsjucUeAQg8LeYTFvSoGJcFWpovSvr3gnB4CM99Ekihr-_FTuXlTQOo
Thank you Jagdish Gangolly for the heads up
Simpson's Paradox
Base Rate Fallacy
Will Rogers Paradox
Berkson's Paradox
Multiple Comparisons Fallacy
**How to mislead with statistics?
Why do nations have such differing fatality rates among people with the
Coronavirus (note the graph)? ---
https://marginalrevolution.com/marginalrevolution/2020/03/why-such-a-large-difference-in-fatality-rates.html#comments
The comments beneath the article are a mishmash of stupid reasons and plausible
reasons. In nearly all nations the fatality rates are probably understated due
to non-reporting of many people who had the virus, lived on, and never reported
their affliction officially.
Differences in this non-reporting rate probably account for a lot of the
differences in fatality rates being reported by nations. Nations with larger
co-pays may have the least-accurate denominators in fatality rate calculations.
Some people avoid having to wait for hours in emergency rooms (and incurring
thousands of dollars in ER billings) by simply avoiding going to the ER whenever
possible.
The disease may be horribly under-reported for developing nations having less
adequate medical facilities.
China Stopped Counting ‘Mild’ Coronavirus
Cases in February ---
https://www.breitbart.com/asia/2020/03/20/china-stopped-counting-mild-coronavirus-cases-in-february/?utm_source=facebook&utm_medium=social
**How to Mislead With Cherry Picking
Cherry Picking Bias (think Snopes, ABC, NBC, CBS,
CNN, MSNBC, Fox News, etc.) is a Far Worse Problem Than Fake News ---
Evaluating the fake news problem at the scale of the information ecosystem ---
https://advances.sciencemag.org/content/6/14/eaay3539
Fake news,” broadly defined as false or misleading information masquerading
as legitimate news, is frequently asserted to be pervasive online with
serious consequences for democracy. Using a unique multimode dataset that
comprises a nationally representative sample of mobile, desktop, and
television consumption, we refute this conventional wisdom on three levels.
First, news consumption of any sort is heavily outweighed by other forms of
media consumption, comprising at most 14.2% of Americans’ daily media diets.
Second, to the extent that Americans do consume news, it is overwhelmingly
from television, which accounts for roughly five times as much as news
consumption as online. Third, fake news comprises only 0.15% of Americans’
daily media diet. Our results
suggest that the origins of public misinformedness and polarization are more
likely to lie in the content of ordinary news or the avoidance of news
altogether as they are in overt fakery.
Jensen Comment
The same thing happens in teaching and research when teachers cherry pick course
content. Sometimes it's caused by a teacher's political bias ---
https://townhall.com/columnists/walterewilliams/2020/10/07/the-fight-for-free-speech-n2577499?utm_source=thdaily&utm_medium=email&utm_campaign=nl&newsletterad=10/07/2020&bcid=b16c6f948f297f77432f990d4411617f&recip=17935167
More often it's wanting to focus on what teachers spent their lives preparing to
teach and overlooking (with content cherry picking) that which is now
embarrassing in course content.
It is by now well known that some of the
greatest modern philosophers held racist views ---
https://aeon.co/essays/racism-is-baked-into-the-structure-of-dialectical-philosophy
---
Also see
https://aeon.co/essays/racism-is-baked-into-the-structure-of-dialectical-philosophy
And cherry picking is not just a political phenomenon. For example, managerial
and cost accounting teachers still devote significant modules of a course to
ABC costing without mentioning that in the real world ABC costing is seldom
used in the 21st Century due to failing to meet the cost-benefit test in
practice ---
https://en.wikipedia.org/wiki/Activity-based_costing#Limitations
It is all too common in academe to teach formulas, algorithms, and processes
while cherry picking out robustness issues and cost when applied in the real
world ---
https://en.wikipedia.org/wiki/Robust_statistics
How to Mislead With Statistics
Statistical Anomalies in Biden Votes, Analyses Indicate ---
https://www.theepochtimes.com/statistical-anomalies-in-biden-votes-analyses-indicate_3570518.html?utm_source=newsnoe&utm_medium=email&utm_campaign=breaking-2020-11-08-5
Jensen Comment
Be aware that the above article is published by a conservative and highly biased
media outlet. In spite of this the article raises some interesting questions
such as Benford's Law commonly used by accountants (think IRS) in search
of fraud in financial data. Benford's Law is also a common component of forensic
accounting education ---
https://www.mentalfloss.com/article/63099/irss-favorite-mathematical-law
I want to claim that I do no support the long delay in the the GOP concession
that Trump lost to Biden. But it is interesting how data analysts are
identifying and analyzing statistical anomalies. Readers can be confused by
false claims of statistical anomalies and true anomalies that are not due to
fraud or error ---
https://www.kdnuggets.com/2020/09/diy-election-fraud-analysis-benfords-law.htm
Having said this I don't think there's probably sufficient evidence to
overthrow the 2020 election results. Investigations of fraud should proceed to
improve the integrity of future elections. But the Biden team should not be
delayed in their efforts to take over the leadership of the USA.
Election fraud analysis becomes increasingly important as the margins of
difference vote counts shrink like they did in the November 2020 election.
Some fraud controls in live voting are lost when votes are accepted by mail. For
example, it's much harder for the dead to show up at the voting centers.
Politically Incorrect Paper of the Day: The
Persistence of Pay Inequality ---
https://marginalrevolution.com/marginalrevolution/2020/10/politically-incorrect-paper-of-the-day-the-persistence-of-pay-inequality.html
**How to Mislead With Statistics
Warning: This is a conservative site
When There Are Multiple Causes of Death: The Way the U.S. is Counting
Wuhan Coronavirus Deaths Seems Problematic ---
https://townhall.com/tipsheet/katiepavlich/2020/04/08/the-way-the-us-is-counting-wuhan-coronavirus-deaths-seems-problematic-n2566543?utm_source=thdaily&utm_medium=email&utm_campaign=nl&newsletterad=04/08/2020&bcid=b16c6f948f297f77432f990d4411617f&recip=17935167
Jensen Comment
This hasn't always been a problem. If somebody with Stage 4 lung cancer in the
hospital dies from pneumonia I think (without doing any research) that the death
becomes a lung cancer statistic. Why should it be any different with Covid-19?
The article points out that it may be very difficult to compare the USA Covid-19
statistic on deaths with those same statistics in other nations.
A similar problem arises with statistics on business failures. Suppose a buggy
whip manufacturer has a cash flow problem and goes very deep into debt trying to
develop an engine plant. If it fails in this effort what becomes the cause of
the death --- product obsolescence, too much debt leverage, or inability to
adapt? Why did both Pan Am and Eastern Airlines die? Why did the Big Five
accounting firm named Andersen die?
Enron had multiple and interactive causes of death ---
http://faculty.trinity.edu/rjensen/FraudEnron.htm
Worldcom had fewer causes.
**How to Mislead by Ignoring Job
Task Differences
Salesforce ---
https://en.wikipedia.org/wiki/Salesforce
Salesforce's former chief recruiter says arrogance is the biggest red flag in
hiring. Here's how the company spots it during the interview process ---
https://www.businessinsider.com/how-salesforce-spots-arrogance-in-the-interview-process-2019-11?utm_source=Sailthru&utm_medium=email&utm_content=BIPrime_select&utm_campaign=BI
Prime 2020-07-01&utm_term=BI Prime Select
·
Salesforce is adamant about hiring based on its four cultural tenets:
trust, innovation, equality, and customer success.
·
The major red
flag that a person doesn't embody those values is arrogance, according
to Ana Recio, the company's former executive vice president of global
recruiting.
·
A clear
indicator during the interview process is if the person doesn't mention
the team that helped them achieve a goal. Essentially, Recio said, those
applicants use the word "I" too much.
·
But it's not
just about the answers. Salesforce also wants to hear questions from
candidates that seek to "understand the definition of success from the
customer's lens versus from an engineering lens," Recio said.
Jensen Comment
This ignores circumstances where people that perform best may sometimes be the
most arrogant. Sometimes our best scholars, writers, musicians, actors,
athletes, mathematicians, scientists, investors, etc. are also the most arrogant
in their disciplines. For some great performers it's hard to be humble.
It would seem that if
Salesforce wants to hire the best technical performers (think programmers) then
arrogance maybe shouldn't not be a rock solid criterion for employment
rejections.
There are tasks for which
arrogance is probably dysfunctional. But there are other tasks where arrogance
must be tolerated if you want the very best. Of course arrogance sometimes
mellows with age, experience, and circumstances. Arrogance may also be faked to
cover up other issues.
Having said this I admit to not enjoying
being around my faculty colleagues that I viewed as arrogant. I still respected
them if they were truly great at their trade. I just did not like being around
them.
Arrogance may also be confused
or equated with temperament or unfriendliness that is usually more dysfunctional
for team tasks. I'm a great admirer of a famous actor named
Robert
Mitchum who sometimes was viewed as arrogant. But his co-workers claimed he
was also the most professional actor on the set who showed up reliably, knew his
lines perfectly, and was somewhat intolerant of unprofessional co-workers. That
usually made them strive toward Mitchum's professionalism.One of my favorite
interviews to watch is Dick Cavett's interview with Robert Mitchum ---
https://www.youtube.com/watch?v=SbwK6pAnsnM
I really miss Dick Cavett and Robert Mitchum
**How to Mislead With
Statistics
New York algebra fact of the
day ---
https://marginalrevolution.com/marginalrevolution/2020/06/new-york-fact-of-the-day-2.html
Take
here in New York, where in 2016 the passing rate for the Regents Examination
in Algebra I test was 72 percent. Unfortunately, this (relatively) higher
rate of success does not indicate some sort of revolutionary pedagogy on the
part of New York state educators. As the New York Post complained in 2017,
passing rates were so high in large measure because the cutoff for passing
was absurdly low — so low that students needed only to answer 31.4 percent
of the questions correctly to pass the 2017 exam.
Walter A. Williams: The Nation's Report Card
How are K-12 schools doing under President Trump versus
President Obama?
https://townhall.com/columnists/walterewilliams/2020/05/06/the-nations-report-card-n2568167?utm_source=thdaily&utm_medium=email&utm_campaign=nl&newsletterad=05/06/2020&bcid=b16c6f948f297f77432f990d4411617f&recip=17935167
Jensen's Comment
Most K-12 schools were probably doing better when I was a child than they're
doing today. The downhill slide is greatest in the gang-ridden schools,
drug-infested urban schools like Chicago and New Orleans. Throwing money at such
schools is not the answer until life at home recovers. Finland
knows this, which is why Finland's dads spend more time with school children
than the moms or the teachers.
https://www.theguardian.com/lifeandstyle/2017/dec/04/finland-only-country-world-dad-more-time-kids-moms
**How to
Mislead With Statistics
Coronavirus Update:
Australia and Norway share nearly the same number of COVID-19 infections, around
5,800, despite Norway being more than four times smaller in population ---
https://gisanddata.maps.arcgis.com/apps/opsdashboard/index.html?utm_term=OZY&utm_source=Sailthru&utm_medium=email&utm_campaign=PDB%20%282020-04-06%2011:07:40%29#/85320e2ea5424dfaaa75ae62e5c06e61
The link is to the database, but in a newsletter from OZY on April 6, 2020 ---
Actually it's a very good newsletter that I read daily
Is there any nation on earth
that can social distance better than Australia?
Norway has slightly under 150,000 square miles
Australia has 7.6 million square miles.
**How to Mislead With Bad Analogies
"Under this plan, 45 percent (tantamount to
complete control) of the board of directors in any large corporation with
at least $100 million in annual revenue, corporations with at least $100 million
in balance sheet total, and all publicly traded companies will be directly
elected by the firm’s workers – similar to what happens under “employee
co-determination” in Germany, which long has had one of the most productive and
successful economies in the world."
Bernie Sanders
https://berniesanders.com/issues/corporate-accountability-and-democracy/
Jensen Comment
Paul Krugman recently
wrote a piece defending Bernie Sanders' economics and plans for worker
control of corporations. Bernie Sanders skates on thin ice when comparing USA
corporations with German corporations. A most important difference in these two
nations is how capital investment is raised, especially high-risk financial
investment.. Germany traditionally never has had a lot
of success raising equity capital --- largely because of the lack of
control equity (capital stock) investors have on German corporations.
Historically up to and including today, German business
firms raise most of their capital from private sector banks that
limit the power that employees have on spending by corporations in Germany. In
the USA a much greatr share of corporate funding is raised from private sector
investors who have much more control of corporations and can greatly restrict
the power of workers to control how corporations spend their resources. Elon
Musk, for example, inhibits all efforts of Tesla employees to form unions.
Bernie Sanders wants to give workers and their unions complete
control of how large corporations in the USA spend their resources. Doing so
will among other things destroy the stock markets and accordingly all pension
funds now dependent upon stock prices. In a large corporation any shareholder
bloc that controls 45% of the shareholder vote essentially controls the company
(Elon Musk controls Tesla with a mere 22% oif Tesla's shares.)
What Bernie Sanders does not tell you is that he cannot have the
corporate democracy that he promises by giving workers control of large
companies in the USA. The reason is that those workers will not supply the
capital investments needed to create and sustain those companies. Therefore,
workers will have to bargain with the private sector to provide capital, and the
private sector will demand after-tax returns on their investments just like
German banks require after-tax returns on their investments in German
corporations.
And the German banks require thresholds of
after-tax returns which greatly limits the power of the German government
to tax those banks.
German corporations are not the worker honey pots that Sanders
wants for USA workers.
And for those who still argue in favor of the German way to raise
capital from the private sector, I remind you that Germany has no Silicon Valley
and has a poor track record for developing risky technology companies, new
patents for drugs (where over half come from the USA), If you want innovation
you have to somehow provide incentives to invest in high risk ventures.
German banks are not known for taking on great financial
risks.
New startup ventures are not flocking to Germany or trying to
sell their shares to German equity investors or German banks.
**How
to Mislead With Statistics
The
US has become one of the lowest-taxed countries in the world. Here are the 6
other nations with the smallest tax burdens ---
https://markets.businessinsider.com/news/stocks/6-nations-smallest-tax-burdens-outside-us-ultra-low-tax-2019-12-1028748866#mexico-16-1-tax-rate1
Jensen
Comment
Talk about comparing Apples with Thistles
Some things just cannot be compared between nations --- things like poverty,
health care, and taxes. Poverty is tough because some people below the poverty
line in the USA live like the middle or even upper class in really poor nations
that have no comparable free education, Medicaid, food stamps, welfare, housing
subsidies, and a $2+ trillion underground economy that funds millions of people
in the USA ---
https://en.wikipedia.org/wiki/Gini_coefficient#Limitations
Health
care is tough because of differences in services timing and quality as well as a
myriad of other considerations. Some nations (think Canada and Germany) with
very basic government-funded health care plans also have private sector funding
for higher quality health care. Some nations have different policies on things
like simplified euthanasia of patients who want to die. An enormous cost of
Medicare and Medicaid in the USA is for patients who want to die. Some nations
spend far less than the USA trying to save pre-mature babies. Some nations
make it more difficult for the elderly to get funding for some medical services
like dialysis and very complicated surgeries like when Medicare paid for one of
my wife's 14-hour spine surgeries to break her back in three places and implant
rods.
Tax
comparisons between nations are almost impossible because of differences in
benefits that come with the taxes. In most of Europe, Canada, and some other
nations taxes cover health care and long-term nursing care, college and training
for some (such as the top 1/3 of high school graduates) and many other benefits
that are not included in taxes in the USA. If that funding is added to tax
revenues in the USA, the USA is no longer one of the "lowest-taxed countries of
the world."
One way
to see how tax comparisons differ greatly between nations is to compare payroll
taxes and benefits at
https://en.wikipedia.org/wiki/Payroll_tax
**How to Mislead With Statistics
USA Counties: Immigrant Population Growth Per 1,000 Residents
https://www.businessinsider.com/where-are-immigrants-moving-to-2019-5
Question
So why the supposed explosion of immigrants in such places as the northern
border of North Dakota, parts of Wyoming, the western panhandle of north Texas,
etc."
Answer
It's that denominator phenomenon. Just a few immigrants moving into a sparsely
populated county of the USA can make it look like a population explosion.
Another possible explanation is that this map may be based upon only legal
immigrants. They're almost insignificant compared to the illegal immigrants
pouring into the USA these days --- over a million new folks crowding into the
southern USA border.before heading for sanctuary cities rather than rural North
Dakota.
**How to Mislead With Cherry Picking
Slavery Still Exists All Around the World. Here's How Some
Countries Are Trying to Change That ---
https://time.com/5741714/end-modern-slavery-initiatives/?utm_source=newsletter&utm_medium=email&utm_campaign=the-brief&utm_content=20191202&xid=newsletter-brief
Jensen Comment
Notice how the above article fails to mention the most notorious modern-day
slave trading nation in the world --- Libya. That's probably because Time
Magazine became an extremely biased leftist magazine, and it's not politically
correct to point out that Arab nations like Libya remain a slave-trading
nations.
Libya still has open slave markets. It's just something the
leftist media does not like to mention (except CNN did mention it at least
once). ---
https://en.wikipedia.org/wiki/Slavery_in_Libya
Time Magazine cherry picked away any mention of the current Arab
slave markets.
**How to Mislead With Statistics
The mother of all cognitive illusions: The belief
that having to pay higher taxes would make it more difficult to buy what you
want
https://behavioralscientist.org/behavioral-economics-robert-frank-taxes-mother-of-all-cognitive-illusions/
Jensen Comment
What a terrible article. The title of the above
paper should read "The mother of all academic illusions."
The above article is a combination of lousy research and slight of hand. An
example of slight of hand is the comparison of 1940s highest marginal tax rates
with those of the 1980s. Consider the quotation:
In World War II, the top
marginal tax rate in the United States was 92 percent. By 1966 it had fallen
to 70 percent. In 1982 it was 50 percent, and it is now just 37 percent.
This is a slight of hand because the author knows
(but does not tell us) that the USA marginal top tax rates of the 1940s are not
directly comparable with the marginal rates of the 1980s. No high income
taxpayers in the 1940s were paying 92% of their incomes in taxes. For example,
very favorable tax rates on capital gains were exploited by wealthy people to
greatly reduce taxes owed from since 1921 ---
https://en.wikipedia.org/wiki/Capital_gains_tax_in_the_United_States#History
Beginning in 1942, taxpayers
could exclude 50% of capital gains on assets held at least six months or
elect a 25% alternative tax rate if their ordinary tax rate exceeded
50%.[11] From 1954 to 1967, the maximum capital gains tax rate was 25%
Secondly taxpayers during World War II had
various alternatives to earn income tax free such as Series E, F and G U.S.
Treasury Bonds ---
https://en.wikipedia.org/wiki/War_bond#United_States_2
There were and still are various other ways to exempt or
reduce ncome from taxation ---
https://en.wikipedia.org/wiki/Tax_exemption#exempt_income
Probably the worst thing about "The Mother of All
Cognitive Illusions" is the total ignoring of why virtually all advanced nations
(and most others) greatly reduced highest marginal tax rates between 1979 and
2002, because high marginal top tax rates were counter
productive to economic growth and prosperity.
http://www.econlib.org/library/Enc/MarginalTaxRates.html
Those nations like Sweden that did not offer lower capital gains rates and other
tax avoidance alternatives took terrible hits by confiscating high incomes
essential to their economies. When they at last discovered how counter
productive these high tax rates were to their economies they quickly reduced the
top marginal rates. Also remember that some nations like Denmark that still have
relatively high marginal rates are including more services in with their tax
dollars like free medical care and free college and job training (for the top
35% of the students).
|
Table 1 Maximum
Marginal Tax Rates on Individual Income |
|
*. Hong
Kong�s
maximum tax (the
�standard
rate�)
has normally been 15 percent, effectively capping the marginal rate
at high income levels (in exchange for no personal exemptions). |
|
**. The
highest U.S. tax rate of 39.6 percent after 1993 was reduced to 38.6
percent in 2002 and to 35 percent in 2003. |
|
|
|
|
1979 |
1990 |
2002 |
|
Argentina |
45 |
30 |
35 |
|
Australia |
62 |
48 |
47 |
|
Austria |
62 |
50 |
50 |
|
Belgium |
76 |
55 |
52 |
|
Bolivia |
48 |
10 |
13 |
|
Botswana |
75 |
50 |
25 |
|
Brazil |
55 |
25 |
28 |
|
Canada (Ontario) |
58 |
47 |
46 |
|
Chile |
60 |
50 |
43 |
|
Colombia |
56 |
30 |
35 |
|
Denmark |
73 |
68 |
59 |
|
Egypt |
80 |
65 |
40 |
|
Finland |
71 |
43 |
37 |
|
France |
60 |
52 |
50 |
|
Germany |
56 |
53 |
49 |
|
Greece |
60 |
50 |
40 |
|
Guatemala |
40 |
34 |
31 |
|
Hong Kong |
25* |
25 |
16 |
|
Hungary |
60 |
50 |
40 |
|
India |
60 |
50 |
30 |
|
Indonesia |
50 |
35 |
35 |
|
Iran |
90 |
75 |
35 |
|
Ireland |
65 |
56 |
42 |
|
Israel |
66 |
48 |
50 |
|
Italy |
72 |
50 |
52 |
|
Jamaica |
58 |
33 |
25 |
|
Japan |
75 |
50 |
50 |
|
South Korea |
89 |
50 |
36 |
|
Malaysia |
60 |
45 |
28 |
|
Mauritius |
50 |
35 |
25 |
|
Mexico |
55 |
35 |
40 |
|
Netherlands |
72 |
60 |
52 |
|
New Zealand |
60 |
33 |
39 |
|
Norway |
75 |
54 |
48 |
|
Pakistan |
55 |
45 |
35 |
|
Philippines |
70 |
35 |
32 |
|
Portugal |
84 |
40 |
40 |
|
Puerto Rico |
79 |
43 |
33 |
|
Russia |
NA |
60 |
13 |
|
Singapore |
55 |
33 |
26 |
|
Spain |
66 |
56 |
48 |
|
Sweden |
87 |
65 |
56 |
|
Thailand |
60 |
55 |
37 |
|
Trinidad and Tobago |
70 |
35 |
35 |
|
Turkey |
75 |
50 |
45 |
|
United Kingdom |
83 |
40 |
40 |
|
United States |
70 |
33 |
39** |
|
|
|
Source: PricewaterhouseCoopers;
International Bureau of Fiscal Documentation. |
**How to Mislead With Cherry Picking
Chronicle of Higher Education: Some 250 People
(mostly from India) Arrested in ICE’s ‘U. of Farmington’ Sting Operation ---
https://www.chronicle.com/article/Some-250-People-Arrested-in/247635?utm_source=at&utm_medium=en&cid=at&source=ams&sourceId=296279
Jensen
Comment
Notice that the above article fails to mention that this was a fake university
for ICE that was commenced by President Obama's administration. It would not be
politically correct for the left-leaning Chronicle to mention this in the above
article. The Chronicle also has a new policy of not allowing comments due to
fear that they might be conservative.
NPR is more informative on President Obama's role in this sting
operation.
NPR: An Elaborate ICE Sting Set Up A Fake College To Lure
Student Visa Fraud ---
https://www.npr.org/2019/11/29/783681028/an-elaborate-ice-sting-set-up-a-fake-college-to-lure-student-visa-fraud
. . .
INSKEEP:
OK. First, I should note, you said 2015 or '16, so this goes back to the
Obama administration. President Trump has his own immigration policies, but
this is not necessarily part of that. It came from before, right?
WARIKOO:
Exactly. They started this when President Obama was in office, correct.
Continued in article
I suspect that mentioning this was just not politically correct
for most readers of the Chronicle
**How to Mislead With Data Visualizations
Even the most beautiful maps can be misleading ---
https://phys.org/news/2019-11-beautiful.html
From reporting election
results to
issuing weather
forecasts,
maps offer a powerful, accessible and visually appealing way to convey
complex information. But as a researcher focusing on data visualisation, I'm
aware that even the most beautiful maps can introduce some degree of
misrepresentation.
To see how, consider the
latest statistics on deprivation released by the UK government. The
government ranked 32,844 neighbourhoods, based on measures of deprivation
such as income, employment, health and crime. The figures were widely
reported, from the
BBC to The
Guardian and the Daily
Mail, reigniting long-standing debates about persistent
inequality in England.
Of course, many outlets used
maps to share these findings with the public. But using
traditional boundaries can divert readers' attention away from important
information. In the
BBC's map of deprivation across local authorities, for instance,
sparsely populated rural
areas dominate a disproportionately large area, while urban
areas, such as London, containing millions of people, are
rendered almost invisible.
Distorted data
Recent research
shows that people can interpret information inaccurately, when
they look at maps with these shortcomings. But other techniques can be used
to create a more accurate impression of the underlying data. For instance, cartograms deliberately
distort geography by scaling areas according to a specific variable, such
as local
population.
Dorling cartograms take this one step
further, scaling areas according to a specified variable, but also
representing each area using the same shape, such as a square or a circle.
Other methods achieve uniformity in both size and shape: hexograms and geogrids transform
the original boundaries of the map into hexagons or squares of the same
size, while still aiming to preserve their original arrangement.
Mapping neighbourhood deprivation
in England represents a significant challenge, even for experts. This is
because the government defines a neighbourhood as a "lower
super output area" – each of which contains around 1,500
residents.
Because highly deprived
neighbourhoods tend to be densely populated, they are less visible on a
regular map. By contrast, wealthier suburban areas—which are often less
densely populated and therefore much larger—dominate the map. So there's a
risk that readers might draw inaccurate conclusions about the level of
deprivation in any given area.
Shaping up
Using Dorling
cartograms scaled by resident population, and regular hexagonal geogrids,
I've attempted to minimise any misrepresentation. Take the example of
Blackpool, which was ranked the
most deprived local authority in England. Around 42% of neighbourhoods in
Blackpool are in the top 10% most deprived in England (the "first decile").
Yet these neighbourhoods only make up around 29% of the city's actual area.
Continued in article
**How to Mislead With Statistics
Report: First-Year Earnings Vary by Degree Program ---
https://www.insidehighered.com/quicktakes/2020/10/14/report-first-year-earnings-vary-degree-program?utm_source=Inside+Higher+Ed&utm_campaign=e8cad2e825-DNU_2020_COPY_02&utm_medium=email&utm_term=0_1fcbc04421-e8cad2e825-197565045&mc_cid=e8cad2e825&mc_eid=1e78f7c952
Jensen Comment
Time and time again I warn students and others that starting salary is a poor
criterion to choosing a first-time
employer. Often employers paying lower first-year salaries offer the best
opportunities for both professional development and career satisfaction. My
favorite example is the U.S. Military where starting salaries are low, but the
opportunities are often great for professional development and eventual career
satisfaction combined with great job benefits. My other example is for
accounting majors joining CPA firms. Firstly, they may get less starting
salaries because they chose accounting rather than chemical engineering.
Secondly, accounting majors may get lower salaries than some marketing and
finance majors who are willing to work for sales commissions. But accounting is
a often a great track toward the executive suite in small and large
corporations. And working as an auditor or tax accountant with a CPA firm
usually entails both great training experience and well as exposure to great
clients who often hire auditors and tax accountants they discover in CPA firms.
There are many variables to consider when choosing a college major and when
choosing that first job. Starting salary is probably one of the least important
considerations.
Bob Jensen's threads on careers ---
http://faculty.trinity.edu/rjensen/Bookbob1.htm#careers
**How to Mislead With Statistics: What can possibly go wrong when
comparing first-year incomes of history versus computer science graduates?
The U.S. Department of Education on Wednesday released data on first-year
earnings of college graduates, for the first time broken down by program level
---
https://www.insidehighered.com/news/2019/11/21/federal-government-releases-earnings-data-thousands-college-programs?utm_source=Inside+Higher+Ed&utm_campaign=6ed01ffd23-DNU_2019_COPY_02&utm_medium=email&utm_term=0_1fcbc04421-6ed01ffd23-197565045&mc_cid=6ed01ffd23&mc_eid=1e78f7c952
Jensen Comment
Firstly, earnings in the first year of a job may be of lesser importance than
other things. For example, it's well known that accounting graduates after
five-years of study and a masters degree earn less on average than computer
science and engineering graduates with four-year degrees. But accounting
graduates know that jobs are plentiful and the most desired starting jobs with
the largest multinational auditing, consulting, and tax firms are more important
than starting jobs at possibly higher salaries with other companies. The reasons
are many, the most important being the investment in training and experience
given by the largest multinational accounting firms.
Unlike physicians and engineers accounting graduates are not specialists when
they graduate. They rely upon the training and experience that their
first employers provide to them to become specialists. In fact more often than
not they don't even intend to stay with their first employers after they get
that training and experience.
What is known is that training and exposure to high paying auditing and tax
clients can lead to fast tracks to high-paying executive opportunities as well
as exciting challenges like getting into the FBI and other law enforcement
agencies. Some accountants hope to start out in the IRS that spends a lot on
training and offers opportunities later on to get a high paying tax accounting
job with business firms. Some accounting graduates intend to get all that
training and experience so they can start up their own firms.
Secondly, large accounting firms are now also providing non-salary benefits
including financial assistance for passing the CPA examination and help in
paying off student loans and family-friendly job assignments that allow young
parents to work out of their homes much of the time. And there are other
disciplines where non-salary benefits include time off. Many college
graduates become school teachers who want summers free to be with their young
children full time when those children are not in school.
Thirdly, in many fields those first-year incomes are not full salaries.
Especially in marketing and finance (think stock brokers) those incomes have a
low base salary plus commissions. Commissions are great if you bust your butt 80
hours a week, including becoming super active in your church and in your
community to make sales contacts and/or spend some of your earnings on travel
expenses and entertainment expenses that are not fully paid by your employer.
Some graduates don't want to bust their butts 80 hours per week drumming up
sales commissions.
Fourthly, reported first year salaries are often biased samples. Think of
where humanities graduates go after graduation. A goodly number have no
first-year incomes because they go on to graduate schools (think further study
in law schools and MBA programs). The ones that do not go on for graduate
studies may well be comprised of many graduates who had low GRE or GMAT scores
and could not get into top graduate programs. They're more likely to become
those over-qualified McJobs workers we hear so much about.
Fifthly, think of the poor slobs who graduate from college and join the
military --- Yeah those poorly-paid slobs who rise to the ranks of among
officers to retire in their early 40s with great lifetime pensions and
medical benefits and go on to double dip in life with new careers on top of
their retirement benefits. Their so-called "first-year earnings" in the military
are highly misleading when you forget to add in the retirement benefits.
Sixtly, some (most?) high-paying jobs are less secure. Yeah, school teachers
may have low-starting salaries but they're usually on a tenure track for job
security. Civil servants have lower incomes but they cannot be fired as long as
they're not sent to prison.
I could go on and on, but I think you get the point that studies like the one
above that compare first-year earnings can lead college students into making
lousy career choices.
**How to Mislead With Statistics
11 mind-blowing facts about China's economy ---
https://markets.businessinsider.com/news/stocks/china-economy-facts-2019-5-1028172022#china-imports-more-us-agricultural-products-than-canada-and-mexico1
The article fails to mention the impact of China's terrible record on human
rights affecting millions of poor people, particularly its minority Muslim
population.
The article also fails to mention the enormous economic corruption.
Jensen Comment
The claim that "With a much bigger population, China has fewer poor people than
the US" is misleading because different definitions of "poor" are used. The
World Bank defines being poor in China as living on less than $1.90 per day ---
https://en.wikipedia.org/wiki/Poverty_in_China
The USA has many more safety nets for the poor such as Medicaid coverage of
poor people, including those in nursing homes, as well as much more generous
welfare programs ---
https://en.wikipedia.org/wiki/Welfare
There are wider differences in quality of medical care and education in China
relative to the USA ---
https://en.wikipedia.org/wiki/Poverty_in_China
In fairness, China has done spectacularly in reducing poverty.
But it's far better to be poor in the USA relative to China ---
https://en.wikipedia.org/wiki/Poverty_in_the_United_States
Also poverty is significantly overstated in the USA by failing to factor in the
$2+ trillion underground economy where cash wages of poor people are never
recorded.
How to Mislead With Statistics
Why Child Care Is So Ridiculously Expensive ---
https://www.theatlantic.com/ideas/archive/2019/11/why-child-care-so-expensive/602599/?utm_source=newsletter&utm_medium=email&utm_campaign=atlantic-daily-newsletter&utm_content=20191126&silverid-ref=NTk4MzY1OTg0MzY5S0
Jensen Comment
The above article gives three solid reasons why child care is so expensive in
the USA. But it leaves out what I consider is the main reason child care is so
expensive in the USA. It's largely the economics high
demand coupled with limited supply. Why don't all colleges,
universities, hospitals, and larger businesses offer child care services?
What limits this supply is legal liability! If
child care services lose one child it could wipe out the budgets of a small
colleges and threaten the survival of those colleges by the time the lawyers
start collecting their share of the punitive damage awards. Some government
agencies provide child care services (think Vermont), but this in part is
because the financial risk can be spread over the entire base of taxpayers. And
voters have the power to limit punitive damages like the voters of Texas voted
to limit the punitive damages in medical malpractice lawsuits.
What the legal liability does is pass the child care services on to very
small businesses (think of private homes) that have almost nothing to sue if
they lose a child. Some churches can risk providing child care services,
especially when those churches have relatively little to lose in liability
lawsuits.
The legal liability financial risk is not so great in most other nations
(think Canada and Finland) where punitive damages are non-existent or severely
restrained. The lure of a punitive damage award the main reason why 80% of the
world's lawyers practice in the USA.---
https://en.wikipedia.org/wiki/Punitive_damages
**How to Mislead With Headlines and Four-Letter Filth
Report: "Big 4 Firms Are Cesspools For Sexual Harassment,
Bullying, and Discrimination" ---
https://goingconcern.com/report-big-4-firms-are-cesspools-for-sexual-harassment-bullying-and-discrimination/
Jensen Comment
Although I sometimes find this Website useful, I'm generally repulsed by the
foul language and tabloid-nature of the site. For example, there are over one
million full-time employees of the Big Four firms worldwide. The above article
takes a few isolated, anecdotal, and hearsay examples, ,mostly from other
countries, of "sexual harassment, bullying, and discrimination" and makes a
headline leading us to believe all one million employees of the Big Four
multinational accounting firms are swimming in excrement. This is not
responsible journalism. It's tabloid sensationalism.
You can expect each and every one of over a million employees
in all parts of the world to always behave behave like heavenly angels during
each and every moment of their careers. These are human beings in different
cultures with different lifestyles (think Japan where there are separate train
cars for women who do not want to be pawed over by men in Japan's beehive
culture). Some bad things are going to happen among the million employees of Big
Four firms going to work every day around the world. This does not mean the Big
Four firms in general are "cesspools."
Three of the Big Four firms are among the very top
companies of the world for working moms at Ranks 4/100, 5/100,
8/100
And all four are in the 15-year Hall of Fame for working moms
---
https://www.workingmother.com/working-mother-100-best-companies-winners-2019
The Big Four firms are among the very best companies to work for in
general at Ranks 26/100, 34/100, 36/100, and 44/100
---
https://fortune.com/best-companies/
These are not "Cesspools for Sexual Harassment, Bullying, and
Discrimination."
**How to Mislead With Statistics
America’s Worst Cities to Drive In ---
https://247wallst.com/special-report/2019/11/20/americas-worst-cities-to-drive-in/
Jensen Comment
You instantly recognize that something is wrong with any ranking that claims
it's worse to drive in Yuba City, Stockton or Modesto, California than in New
York City, Chicago, Houston, Boston, and Los Angeles you know that
the analysts were out of their minds.
Take for example a criterion like average commuting times in Stockton (37.2
minutes) versus Los Angeles (31.3 minutes). This totally ignores the standard
deviations and skewness of the distributions. Without being slowed by congestion
it's not uncommon for drivers in Los Angeles to routinely
spend over two hours commuting each way. This is unheard of within the city
limits of Stockton or Modesto or Yuba City.
The data show hours lost due to congestion for most cities but calculating
such a statistic for large cities like Los Angeles is
hopeless since there's congestion somewhere Los Angeles 24/7 each and
every week of the year.
The data does not include things like the health-hazards of "tension" while
driving. It has to be much more nerve wracking driving in cities like Houston
and Atlanta on freeways that have over 20 lanes (think of trying to get from an
inside lane to an outside lane or vice versa) than in driving in Stockton,
California ranked as being worse for driving than literally every large city in
the USA. Such tensions are totally ignored in this ranking of worst cities to
drive in. When my wife and I drive to Boston the tension of driving jumps
dramatically when we get within 30 miles of Boston. And there's maximum tension
driving at 55 mph bumper-to-bumper inside the traffic tunnels of Boston. How do
those country music song lyrics go: "Don't fence me in."
We tell our house guests who are flying into Logan Airport in Boston to catch
the bus to Concord, NH where we meet them at the bus station. This reduces our
blood pressure markedly compared for our having to drive all the way to Logan
Airport in Boston traffic and tunnels.
What the above ranking tries to tell us is that driving in most any city
(large or small) in California is worse than driving in most any of our largest
cities (think Chicago, New York, Dallas, Houston, Baltimore, Washington DC,
Atlanta, etc.).
I say baloney to this ranking!
**
How to Mislead With
Statistics
The 2008 financial crisis completely changed what majors students choose
---
https://qz.com/1370922/the-2008-financial-crisis-completely-changed-what-majors-students-choose/
Jensen Comment
This study has a typical misleading exhibit (Change in Share of US College
Majors From 2008 to 2017) that does not take the denominator effects into
account. The most dramatic change is the 131% increase in the number of majors
in Exercise Science. However, there were and still are a relatively small number
of majors in Exercise Science when compared with huge populations of majors in
such disciplines as Business, Nursing, Psychology, and English. The rate of
change denominators can be very misleading such as when comparing the following
ratios: 500/1000, 1000/10000, 5000/100000, etc. Midgets can appear very
tall in ratios. More information is needed regarding numbers in the numerators
and denominators.
**How to Mislead With Statistics
Here's what (non-medical) college professors get paid at the 50 best
public universities in America
https://www.businessinsider.com/professor-salaries-best-colleges-in-america-2018-8
Jensen Comment
These "averages" are misleading because of the usual suspects such as lack of
information regarding distributions, standard deviations, outliers, and
demographic factors such as living costs and taxation. And there are huge
variations by discipline. A very highly paid scientist for example is an outlier
that distorts the mean average and fails to account for the fact that that
scientist may bring in far more revenue to the university than the university is
paying her/him in salary and other expenses.
UCLA and UC Berkeley pay quite well, but housing prices are enormous compared
to lower paying Miami University at Oxford and Binghamston University - SUNY.
Universities in New York and California get hammered with income taxes and other
taxes relative to universities in Florida, Texas, and Delaware.
Some universities in this listing avoid high cost academic programs such as
business and law where top faculty are very expensive. An example is the
University of California at Merced that has no business or law schools.
Universities that pay high salaries for business and law professors come out
ahead if those programs are cash cows for those universities (think UCLA,
Michigan, and UC Berkeley).
My main point is that paying very high salaries is not necessarily a bad
thing when the programs with highly paid professors are cash cows that support
programs not bringing in much money to a universi
**How to Mislead With Statistics
Combining Probability Forecasts: 60% and 60% Is 60%, but Likely
and Likely Is Very Likely
SSRN
51 Pages
Posted: 17 Sep 2019
Johns Hopkins University -
Carey Business School
University of Chicago -
Booth School of Business
Date Written: September 16, 2019
Abstract
How do we
combine others’ probability forecasts? Prior research has shown that when
advisors provide numeric probability forecasts, people typically average them
(i.e., they move closer to the average advisor’s forecast). However, what if the
advisors say that an event is “likely” or “probable?” In 7 studies (N = 6,732),
we find that people “count” verbal probabilities (i.e., they move closer to
certainty than any individual advisor’s forecast). For example, when the
advisors both say an event is “likely,” participants will say that it is “very
likely.” This effect occurs for both probabilities above and below 50%, for
hypothetical scenarios and real events, and when presenting the others’
forecasts simultaneously or sequentially. We also show that this combination
strategy carries over to subsequent consumer decisions that rely on advisors’
likelihood judgments. We find inconsistent evidence on whether people are using
a counting strategy because they believe that a verbal forecast from an
additional advisor provides more new information than a numerical forecast from
an additional advisor. We also discuss and rule out several other candidate
mechanisms for our effect.
Keywords: uncertainty, forecasting, verbal
probabilities, combining judgments, combining forecasts, predictions
Robustness Statistics ---
https://en.wikipedia.org/wiki/Robust_statistics
**How to Mislead With Statistics
State gun laws, gun ownership, and mass shootings in the US: cross
sectional time series ---
https://www.bmj.com/content/364/bmj.l542
Outcome variables
We used the Supplementary Homicide Reports from the Federal Bureau of
Investigation’s Uniform Crime Reporting System (1998-2015) to obtain counts
of mass shootings by state. We compiled these data in line with the most
commonly used definition of a mass shooting: one event in which
four or more individuals were killed by a perpetrator using a firearm and
the perpetrator themselves did not count toward the total number of victims.
These mass shooting events were analyzed in total and stratified as to
whether the mass shooting was domestic or non-domestic in nature. Domestic
mass shootings included instances where the perpetrator committed the act
against an immediate family member or partner. Non-domestic mass shootings
included all other types of relationships, such as acquaintances, employees,
employers, friends, neighbors, strangers, extended family members, and
others. Florida was excluded due to non-participation in the Uniform Crime
Reporting System program.
Jensen Comment
The above article is badly misleading in that its conclusions are based largely
on rounding error in computing averages and denominator effects that destroy
robustness. The study focuses on rare events, it's conclusions and displays are
unstable to slight sensitivity analysis.
I will focus my criticisms on Figure 2 where Rhode Island, Delaware, New
Hampshire, North Dakota, and Arkansas each have rounded averages of zero mass
shootings across 17 years. There were mass shootings in those five states, but
their averages round to zero. The worst state in Figure 2 is Vermont that
has the highest average of three mass shootings across those same 17 years. Thus
the lowest five states have zero mass shooting averages and the highest state
has an average of three mass shootings. The difference from lowest to highest
(in Figure 2) I suspect is heavily to heavily be rounding error and is not as
significant as it appears in Figure 2.
There also is what is known as a denominator effect that destroys robustness
in Figure 2 due to the low population of 600,000 people in Vermont. Such a low
population destroys much of the robustness in comparing the highest mass killing
state (Vermont) with more populated states like California, New York, Arkansas
and Delaware. The same applies to low population states of Wyoming, Montana,
North Dakota, New Hampshire, and Alaska.
The study concludes as follows:
Discussion
Our analyses show that US state gun laws have become more permissive in
recent decades, and that a growing divide in
rates of mass shootings appears to be emerging between restrictive and
permissive states. A 10 unit increase in the
permissiveness of state gun laws was associated with an approximately 9%
higher rate of mass shootings after adjusting for key factors. A 10%
increase in gun ownership was associated with an approximately 35% higher
rate of mass shootings after adjusting for key factors. On the absolute
scale, this means that a state like California, which has approximately two
mass shootings per year, will have an extra mass shooting for every 10 unit
increase in permissiveness over five years. It will also have three to five
more mass shootings per five years for every 10 unit increase in gun
ownership. These results were also consistent across multiple analyses and
when stratified as to whether or not mass shootings were committed by
someone in a close relationship with the victims.
I contend that the above conclusion is unstable (not robust) such as the
conclusion that a restrictive state like Rhode Island has a hugely greater
divide (an average of zero mass shootings per year) with a permissive state
Vermont (with an average of three average mass shootings) --- a conclusion
that does not, based upon this study, justify legislation for more restrictive
gun laws to reduce mass shootings. The authors of the above study are not
responsible in pointing out the lack of robustness in their displays and
discussion. For example the five states shown in Figure 2 to have zero average
mass shootings all had mass shootings that were so rare they rounded to zero.
The worst state (Vermont) had an average rounded up to three in Figure 2. But in
reality the difference between the worst state (Vermont) and the five best
states is not really 3-0 = 3. This difference is
somewhat due to rounding differences combined with denominator effects rather
than robust statistical outcomes.
The first rule of statistical analysis is discuss the robustness of the
outcomes. The above study lacks a robustness analysis.
Mass shootings aren’t growing more common – and evidence
contradicts common stereotypes about the killers ---
https://theconversation.com/mass-shootings-arent-growing-more-common-and-evidence-contradicts-common-stereotypes-about-the-killers-121471
**How
to Mislead With Statistics
Inequality is higher in some states like New York
and Louisiana because of corporate welfare (financial incentives to invest in
and create jobs)
https://theconversation.com/inequality-is-higher-in-some-states-like-new-york-and-louisiana-because-of-corporate-welfare-126406
Jensen Comment
This article provides teachers with an illustration of flawed and biased
statistical analysis. Inequality variation among the 50 USA states, like cancer,
is horribly complicated with many complex and interactive causes. The title
alone is a warning: "Inequality in New York and Louisiana is higher
because of corporate welfare (incentives given to
corporations to invest in new jobs).
I begin with a warning about cancer:
How to Interpret News About Cancer Causes ---
https://www.cancer.org/cancer/cancer-causes/general-info/does-this-cause-cancer.html
It's quite easy to assume simplistic cancer causes
analogous to simplistic attributions of poverty causes or inequality causes.
First I stress than inequality in and of
itself is not a bad thing.
Exploring Wealth Inequality: Poverty Matters, Not Wealth Inequality ---
https://www.cato.org/publications/policy-analysis/exploring-wealth-inequality
Second I stress that "corporate welfare itself" as
defined in this study leaves out a lot of stuff that can cause inequality and
poverty. A wonderful example is the following quotation from the above article
"But the amount of
incentives states offer can vary significantly. For example, New Hampshire
spent just $9.9 million on incentives, or
75 cents for every state resident, per
year from 1999 to 2014, while Louisiana paid out an average of $1.2 billion
a year, or $267 per capita.
I absolutely know that New Hampshire really spent
more than 75 cents for every state resident on corporate incentives. Firstly,
New Hampshire has no state income tax or sales tax. That's why Walmart spends
tens of millions of dollars building super stores just inside the borders of New
Hampshire. For example, Walmart built a relatively new enormous super store in
New Hampshire's rural Woodsville (population 1,176). Walmart did not locate in
Woodsville because of any financial incentives offered by Woodsville or the
State of New Hampshire. Walmart invested millions in
the Woodsville store because Woodsville sits on the Connecticut River border
between New Hampshire and Vermont. Vermont citizens (and Canadians)
stream across the bridge into Woodsville for two reasons: One is cheaper
prices at Walmart, and two is avoidance of the Vermont sales tax. The above
study leaves out the "corporate welfare" of not having a state sales tax like
all the states surrounding New Hampshire. Walmart isn't about to build a store
in the high tax state of Vermont.
Not having a sales tax costs the state of New
Hampshire more than "75 cents" per capita. But a gain to New Hampshire
arises from the jobs that Walmart stores create regionally in relatively rural
towns that would otherwise have much higher rates of unemployment.
By the way, the NH Walmart stores are so popular
with out-of-state residents (and Canadians) that new hotels are often built
across from the Walmart stores in New Hampshire. Exhibit A is the large Hampton
Inn that was built directly across the street from the Littleton, NH Walmart
store. I cannot think of any other attraction to stay in this particular hotel
other than the attraction for out-of-state shoppers to get Walmart prices and no
sales taxes. Walmart invests zero for new stores in the high tax state of
Vermont. Many of the cars in the Hampton Inn parking lot are pulling trailers
for Walmart shopping.
But my main objection with the above article is how
inconsistent the conclusions are with the data that was used in the study. The
author obviously has a political bias that is stretched to the limit. The first
bias is in the unmentioned limitations of the Gini Coefficient upon which the
entire analysis is based. Read the following at
https://en.wikipedia.org/wiki/Gini_coefficient#Limitations
The Gini coefficient is a
relative measure. Its proper use and interpretation is controversial. It is
possible for the Gini coefficient of a developing country to rise (due to
increasing inequality of income) while the number of people in absolute
poverty decreases. This is because the Gini coefficient measures relative,
not absolute, wealth. Changing income inequality, measured by Gini
coefficients, can be due to structural changes in a society such as growing
population (baby booms, aging populations, increased divorce rates, extended
family households splitting into nuclear families, emigration, immigration)
and income mobility. Gini coefficients are simple, and this simplicity can
lead to oversights and can confuse the comparison of different populations;
for example, while both Bangladesh (per capita income of $1,693) and the
Netherlands (per capita income of $42,183) had an income Gini coefficient of
0.31 in 2010, the quality of life, economic opportunity and absolute income
in these countries are very different, i.e. countries may have identical
Gini coefficients, but differ greatly in wealth. Basic necessities may be
available to all in a developed economy, while in an undeveloped economy
with the same Gini coefficient, basic necessities may be unavailable to most
or unequally available, due to lower absolute wealth.
Different income
distributions with the same Gini coefficient
(think California, Mississippi, New Mexico, and Louisiana all having about
the same Gini Coefficient for vastly different reasons)
Even when the total income of a population is
the same, in certain situations two countries with different income
distributions can have the same Gini index (e.g. cases when income Lorenz
Curves cross). Table A illustrates one such situation. Both countries have a
Gini coefficient of 0.2, but the average income distributions for household
groups are different. As another example, in a population where the lowest
50% of individuals have no income and the other 50% have equal income, the
Gini coefficient is 0.5; whereas for another population where the lowest 75%
of people have 25% of income and the top 25% have 75% of the income, the
Gini index is also 0.5. Economies with similar incomes and Gini coefficients
can have very different income distributions. Bellù and Liberati claim that
to rank income inequality between two different populations based on their
Gini indices is sometimes not possible, or misleading.
Extreme wealth
inequality, yet low income Gini coefficient
(think of New York City versus Woodsville, NH)
A Gini index does not
contain information about absolute national or personal incomes. Populations
can have very low income Gini indices, yet simultaneously very high wealth
Gini index. By measuring inequality in income, the Gini ignores the
differential efficiency of use of household income. By ignoring wealth
(except as it contributes to income) the Gini can create the appearance of
inequality when the people compared are at different stages in their life.
Wealthy countries such as Sweden can show a low Gini coefficient for
disposable income of 0.31 thereby appearing equal, yet have very high Gini
coefficient for wealth of 0.79 to 0.86 thereby suggesting an extremely
unequal wealth distribution in its society. These factors are not assessed
in income-based Gini.
Small sample bias
(think of New Hampshire versus New York state)
– sparsely populated regions more likely
to have low Gini coefficient
Gini index has a downward-bias for small
populations. Counties or states or countries with small populations and less
diverse economies will tend to report small Gini coefficients. For
economically diverse large population groups, a much higher coefficient is
expected than for each of its regions. Taking world economy as one, and
income distribution for all human beings, for example, different scholars
estimate global Gini index to range between 0.61 and 0.68.
As with other inequality coefficients, the Gini coefficient is influenced by
the
granularity
of the measurements. For example, five 20% quantiles (low granularity) will
usually yield a lower Gini coefficient than twenty 5% quantiles (high
granularity) for the same distribution. Philippe Monfort has shown that
using inconsistent or unspecified granularity limits the usefulness of Gini
coefficient measurements.
The Gini coefficient measure gives different
results when applied to individuals instead of households, for the same
economy and same income distributions. If household data is used, the
measured value of income Gini depends on how the household is defined. When
different populations are not measured with consistent definitions,
comparison is not meaningful.
Deininger and Squire (1996) show that income
Gini coefficient based on individual income, rather than household income,
are different. For example, for the United States, they find that the
individual income-based Gini index was 0.35, while for France it was 0.43.
According to their individual focused method, in the 108 countries they
studied, South Africa had the world's highest Gini coefficient at 0.62,
Malaysia had Asia's highest Gini coefficient at 0.5, Brazil the highest at
0.57 in Latin America and Caribbean region, and Turkey the highest at 0.5 in
OECD countries.
Inability to value benefits and
income from
informal economy
affects Gini coefficient accuracy
(New York City is full of welfare benefits whereas there are relatively none
in Woodsville, NH)
Some countries distribute benefits that are
difficult to value. Countries that provide subsidized housing, medical care,
education or other such services are difficult to value objectively, as it
depends on quality and extent of the benefit. In absence of free markets,
valuing these income transfers as household income is subjective. theoretical model of Gini coefficient is limited to accepting correct or
incorrect subjective assumptions.
In subsistence-driven and informal economies, people may have significant
income in other forms than money, for example through
subsistence farming
or
bartering.
These income tend to accrue to the segment of population that is
below-poverty line or very poor, in emerging and transitional economy
countries such as those in sub-Saharan Africa, Latin America, Asia and
Eastern Europe. Informal economy accounts for over half of global employment
and as much as 90 per cent of employment in some of the poorer sub-Saharan
countries with high official Gini inequality coefficients. Schneider et al.,
in their 2010 study of 162 countries,
report about 31.2%, or about $20 trillion, of world's
GDP
is informal. In developing countries, the informal economy predominates for
all income brackets except for the richer, urban upper income bracket
populations. Even in developed economies, between 8% (United States) to 27%
(Italy) of each nation's GDP is informal, and resulting informal income
predominates as a livelihood activity for those in the lowest income
brackets.
The value and distribution of the incomes from informal or underground
economy is difficult to quantify, making true income Gini coefficients
estimates difficult. Different assumptions and quantifications of these
incomes will yield different Gini coefficients.
Gini has some mathematical limitations as well.
It is not additive and different sets of people cannot be averaged to obtain
the Gini coefficient of all the people in the sets.
Continued in article
I could go on and on and on about how really bad is the analysis
that concludes:
"Inequality is higher in some states like New York and Louisiana
because of corporate welfare" (incentives to
business firms to invest in facilities and create jobs).
Rep. AOC (Alexandria) naively fought against having the second Amazon
headquarters, warehouses, and jobs in NYC. The leftist Governor Cuomo and Mayor
de Blasio were furious with her for good reason ---
Bill de Blasio corrects Ocasio-Cortez's claim about spending
Amazon tax break money ---
https://www.foxnews.com/politics/de-blasio-ocasio-cortex-claim-spending-amazon-tax-break-money
Will $120 per year tax credit for each Queens taxpayer have the same impact
as the Amazon deal will have on Queens?
https://ny.curbed.com/2018/11/16/18098589/amazon-hq2-nyc-queens-long-island-city-explained
According to the state, Amazon will generate $27.5
billion in state and city revenue over 25 years, a 9:1 ratio of revenue to
subsidies—an arrangement Cuomo called
“the highest rate of return for an economic incentive program the state has
ever offered.”
Even if we complicate the analysis with time value of money
Alexandria's
proposal is what I call Democratic Socialist economics.
She never would've allowed Silicon Valley to be developed.
**How to Mislead With Statistics
Capital-Labor Substitution ---
http://meta-analysis.cz/sigma/
We show that the large elasticity of substitution
between capital and labor estimated in the literature on average, 0.9, can
be explained by three factors: publication bias, use of aggregated data, and
omission of the first-order condition for capital. The mean elasticity
conditional on the absence of publication bias, disaggregated data, and
inclusion of information from the first-order condition for capital is 0.3.
To obtain this result, we collect 3,186 estimates of the elasticity reported
in 121 studies, codify 71 variables that reflect the context in which
researchers produce their estimates, and address model uncertainty by
Bayesian and frequentist model averaging. We employ nonlinear techniques to
correct for publication bias, which is responsible for at least half of the
overall reduction in the mean elasticity from 0.9 to 0.3. Our findings also
suggest that a failure to normalize the production function leads to a
substantial upward bias in the estimated elasticity. The weight of evidence
accumulated in the empirical literature emphatically rejects the
Cobb-Douglas specification.
**How to Mislead With Statistics
For years, the estimates of nonfatal gunshot injuries published by the
Centers for Disease Control and Prevention have grown increasingly unreliable
---
https://fivethirtyeight.com/features/how-one-hospital-skewed-the-cdcs-gun-injury-estimate/
**How to Mislead With Statistics
How Higher Education’s Data Obsession Leads Us Astray ---
https://www.chronicle.com/article/How-Higher-Education-s-Data/247409?utm_source=cr&utm_medium=en&cid=cr&source=ams&sourceId=296279
Has
there ever been an enterprise that produced so much data to so little effect
as higher education? We are drowning in data, awash in analytics. Yet,
critics demand even more data, contending that higher education remains
persistently opaque and lacking true accountability.
Here’s a heretical thought: Perhaps the problem
is not a lack of data, but rather, that metrics alone are a poor measure of
accountability. Our critics prefer lists over paragraphs, but sometimes
words are important to interpret statistics.
The data industry is huge, including magazine
rankings and credit-rating agencies; accreditors; and the mother of all data
collections, housed at the U.S. Department of Education: Ipeds, the
Integrated Postsecondary Education Data System. Easy access to voluminous
data allows just about anyone to extract random factoids as evidence to
assail or affirm collegiate value. Politicians assail high-tuition rates as
bad for consumers, but Moody’s rewards them for generating ever-higher
net-tuition revenues. Critics pummel elite universities for failing to
enroll enough low-income students, while berating colleges that enroll
majorities of Pell grantees for low graduation rates. More nuanced analyses
of the relationships among high-net tuition, volume of Pell grantees, and
graduation rates rarely make it into a public discussion that fixates on the
numbers, not the narrative.
Big data is helpful to understand megatrends like the
impact of student-debt burdens by race and ethnicity, the alarming growth in
discount rates, or changes in demand for majors. But statistics are no
substitute for professional judgment about the meaning of data for a
specific institution. Unfortunately, magazine rankings and the federal
College Scorecard choose to present
isolated data points as institutional quality measures without
interpretation.
Qualitative measures are also important for
accountability analysis. Rankings are silent on the ways in which the
first-year faculty members help students discover that they really can learn
statistics, write laboratory reports, analyze complex texts, conduct
research, or engage in professional work through internships. The College
Scorecard does not provide data on the campus climate for women or students
of color, or the scope of services for students with disabilities, or food
pantries and support for students who are also parents.
Accreditation has always been the place where
both quantitative and qualitative evidence is presented within the larger
institutional context; interpretation of performance data through the lens
of mission and student-body characteristics is essential to level-set the
basis for continuous quality improvement. Even more important are the
collegial conversations among visiting teams, institutional leaders, and
faculty to focus on challenges needing serious repair and opportunities to
move forward constructively. Those conversations, summarized in team
reports, often remain private, a fact that frustrates critics craving public
shaming of institutions that fall outside of traditional benchmarks.
In recent years, pushed by the critics who push
Congress and the U.S. Department of Education, accreditation has inexorably
moved toward even more data-driven assessment processes in both regional and
specialized accreditation. Whether this migration has produced more
accountability is unclear. While the idea of self-study and collegial peer
review continues, the hegemony of data analytics threatens to diminish the
most useful parts of the accreditation process in the collegial discussions
that honor mission and institutional context while also challenging
institutions to improve.
Some elite universities lobbied for this change on theory that if they surpass some normative benchmarks, they should not have
to bear the burden of the more onerous hands-on accreditation processes
beyond, perhaps, cursory reviews. Aside from the arrogance of insisting that
some universities are above collegial scrutiny (the climate that fostered
the Varsity Blues scandal notwithstanding), the use of data to exonerate
wealthy elite schools also perpetuates higher education’s caste system.
Institutions serving large numbers of at-risk students will probably not
qualify for lesser scrutiny since their
students move through college at variance from traditional norms; the more
variance, the deeper the scrutiny.
Continued in article
Jensen Comment
There's a difference between having too much data versus conducting studies that
mislead with that data. The main argument about having too much data is that too
much is being spent (in time and money) collecting it. The main argument about
misleading data can be found in the many examples of how it is misleading us ---
http://faculty.trinity.edu/rjensen/MisleadWithStatistics.htm
**How to
Mislead With Statistics
Walter E. Williams: Idiotic Environmental Predictions ---
https://townhall.com/columnists/walterewilliams/2019/10/09/idiotic-environmental-predictions-n2554294?utm_source=thdaily&utm_medium=email&utm_campaign=nl&newsletterad=10/09/2019&bcid=b16c6f948f297f77432f990d4411617f&recip=17935167
The Competitive Enterprise Institute has published a new
paper, "Wrong Again: 50 Years of Failed Eco-pocalyptic Predictions." Keep in
mind that many of the grossly wrong environmentalist predictions were made
by respected scientists and government officials. My question for you is: If
you were around at the time, how many government restrictions and taxes
would you have urged to avoid the predicted calamity?
As reported in The New York Times (Aug. 1969) Stanford
University biologist Dr. Paul Erhlich warned: "The trouble with almost all
environmental problems is that by the time we have enough evidence to
convince people, you're dead. We must realize that unless we're extremely
lucky, everybody will disappear in a cloud of blue steam in 20 years."
In 2000, Dr. David Viner, a senior research scientist at
University of East Anglia's climate research unit, predicted that in a few
years winter snowfall would become "a very rare and exciting event. Children
just aren't going to know what snow is." In 2004, the U.S. Pentagon warned
President George W. Bush that major European cities would be beneath rising
seas. Britain will be plunged into a Siberian climate by 2020. In 2008, Al
Gore predicted that the polar ice cap would be gone in a mere 10 years. A
U.S. Department of Energy study led by the U.S. Navy predicted the Arctic
Ocean would experience an ice-free summer by 2016.
In May 2014, French Foreign Minister Laurent Fabius declared
during a joint appearance with Secretary of State John Kerry that "we have
500 days to avoid climate chaos."
Peter Gunter, professor at North Texas State University,
predicted in the spring 1970 issue of The Living Wilderness: "Demographers
agree almost unanimously on the following grim timetable: by 1975 widespread
famines will begin in India; these will spread by 1990 to include all of
India, Pakistan, China and the Near East, Africa. By the year 2000, or
conceivably sooner, South and Central America will exist under famine
conditions. ... By the year 2000, thirty years from now, the entire world,
with the exception of Western Europe, North America, and Australia, will be
in famine."
Ecologist
Kenneth Watt's 1970 prediction was, "If present trends continue, the world
will be about four degrees colder for the global mean temperature in 1990,
but eleven degrees colder in the year 2000." He added, "This is about twice
what it would take to put us into an ice age."
Mark J. Perry, scholar at
the American Enterprise Institute and professor of economics and finance at
the University of Michigan's Flint campus, cites 18 spectacularly wrong
predictions made around the time of first Earth Day in 1970. This time it's
not about weather. Harrison Brown, a scientist at the National Academy of
Sciences, published a chart in Scientific American that looked at metal
reserves and estimated that humanity would run out of copper shortly after
2000. Lead, zinc, tin, gold and silver would be gone before 1990. Kenneth
Watt said, "By the year 2000, if present trends continue, we will be using
up crude oil at such a rate ... that there won't be any more
crude oil."
Continued in article
The New Yorker: The climate apocalypse is
coming. To prepare for it, we need to admit that we can’t prevent it ---
https://www.newyorker.com/culture/cultural-comment/what-if-we-stopped-pretending
Jensen Comment
The problem with prior idiotic predictions is that they are like the boy who
cried wolf repeatedly ---
https://en.wikipedia.org/wiki/The_Boy_Who_Cried_Wolf
When the real wolf is lurking many people ignore the warnings.
How Fact Checkers Mislead With Statistics
Ilhan Omar Defended by Media and Fact Checkers ---
https://townhall.com/columnists/johnrlottjr/2019/07/31/ilhan-omar-defended-by-media-and-fact-checkers-n2550908?utm_source=thdaily&utm_medium=email&utm_campaign=nl&newsletterad=07/31/2019&bcid=b16c6f948f297f77432f990d4411617f&recip=17935167
Jensen Comment
The way fact checkers mislead with statistics is in selectivity bias by not fact
checking claims they agree with politically.
**How to Mislead With Statistics
Excerpts taken from the article: “A Famous Study Found That Blind
Auditions Reduced Sexism in the Orchestra. Or Did It?” ---
https://replicationnetwork.com/2019/10/25/in-the-news-reason-october-22-2019/
**How to Mislead With Statistics
Ranking of Cities Where Your Car is Most Likely to Be Stolen ---
https://247wallst.com/special-report/2019/10/17/your-car-is-most-likely-to-be-stolen-in-these-cities/2/
Ranking of States Where Your Car is Most Likely to be Stolen ---
https://247wallst.com/autos/2016/11/08/states-where-your-car-is-most-and-least-likely-to-be-stolen/
Jensen Comment
It's not that the rankings of car theft by cities and states are not similar;
It's just that there are some inconsistencies. First is that all states along
the border with Mexico are in the Top 10 states most likely to have your car
stolen, including Texas. And yet none ot the largest cities in Texas (Dallas,
Houston, and San Antonio) even made the ranking of cities high in car thefts.
This is surprising after I lived for 24 years in San Antonio. I know that car
theft is very high in San Antonio and that stolen cars are often in Mexico
before owners even know their cars are missing. Stolen cars often either end up
on Mexico or they pass through Mexico on the way to Belize that has an economy
built on stolen cars.
Why is car theft more likely in Denver, Seattle, Billings, and Wichita than
it is in Dallas, Houston, or San Antonio?
Of course there are some similarities in these rankings of states and cities.
Many California cities are high car theft cities, and California is on the
Mexico border. And the Number 1 car theft city, Albuquerque, is in New Mexico
that's on the border with Mexico.
The rankings also raise unanswered questions. Why is car theft so high in
Utah and Washington State? Is this a statistical quirk that makes theft rate
differences between ranked cities somewhat insignificant.
I do realize that there are many reasons cars stolen, including for temporary
car theft for joy rides and get-away cars connected to crimes. Cars are also
permanently stolen stolen for export (think Mexico) and chop shops (for parts).
I would expect some poverty states (think Mississippi) to rank higher in car
theft rates.
During economic downturns owners sometimes encourage thefts for the insurance
money. During an economic downturn in San Antonio when some high income people
lost their jobs and could no longer make payments on their loans for luxury
cars. Their expensive cars were sometimes parked on the south side of town with
the keys left in the ignition by owners hoping to recover more insurance money
than the balance due on their car loans
**
**How
to Mislead With Statistics
The
20 cities in the Northeast that Americans are escaping (from)
in droves (2010-2018) ---
https://www.businessinsider.com/cities-in-the-northeast-americans-are-fleeing
Jensen
Comment
There were 9/20 losing cities in New York, followed by 4/20 from New Jersey, and
3/20 from Pennsylvania, 3/20 From Connecticut, and 1/20 from Maine.
Those
four states are the only ones in the Top 20 out of 14 states generally
considered in the Northeast ---
https://en.wikipedia.org/wiki/Northeastern_United_States
What's
causing the exodus?
We might look at taxes, but the high taxing states of Massachusetts and Vermont
are not included in the Top 20 above.
We might look at climate, but the too many of the coldest states are not
included in the Top 20.
We
might look at fiscal mismanagement in state government since New Jersey,
Connecticut, and Pennsylvania are hit hard, but this leaves out badly mismanaged
Rhode Island and some other states with relatively poor fiscal management.
Besides this is a ranking of cities rather than states.
The cities in the Top 20 are so varied in terms of size and crime rates, I don't
think crime is the underlying issue here.
I think
that one underlying issue is such a wide variation in population of these
cities. The New York metro area has nearly 20 million people whereas
Lewiston-Auburn in Maine barely has 100,000 people with some of the other cities
having less than 200,000. Yeah, I know the ranking is based upon the proportion
of exiting population, but nevertheless comparing a giant pumpkin (NYC) to a
raison (Lewiston-Auburn) raises some other issues.
The
problem with including very small cities in the above rankings is that a random
event can dominate small town population loss more than cities with millions of
people. Lewiston and Auburn in Maine was were dead mill towns (think shoes) long
before 2010 ---
https://en.wikipedia.org/wiki/Lewiston,_Maine
In 1999, partly due to low-cost empty houses in Lewiston, the government located
12,000+ refugees from Somalia. These newer residents started a relatively large
number of retail shops, but Lewiston was already a relatively lousy place to
locate new retail shops. The bottom line is that the shops have not prospered
and many Somalis moved elsewhere 2010-2018.
My
point is that population spurts and losses are likely to be affected by a random
event in a small town more than population spurts and losses in cities with
millions of people. We should not be comparing raisins with pumpkins.
**How to Mislead With Statistics (distortions, missing variables, samples)
"The 11 most expensive countries for a university education," by
Lianna Brinded, Business Insider, December 28, 2015 ---
http://www.businessinsider.com/expert-market-11-countries-where-parents-spend-the-most-money-on-university-tuition-fees-2015-10
Jensen Comment
This has to be one of the most misleading articles that I have ever read. It's
not at all clear how the data is collected and aggregated, but it overlooks how
complicated it is to compute "tuition cost," especially in the USA. Firstly,
virtually all of the top state supported universities in all 50 states have
excellent academic reputations such as UC Berkeley, University of Washington,
University of Wisconsin, University of Illinois, University of Texas, Texas A&M,
University of Michigan, etc. Tuition costs vary greatly between what in-state
students are charged versus out-of-state students. In-state students get a
relatively good deal for both onsite and online degrees.
Secondly, the study seems to ignore the high proportion of need-based
financial support from both the top-ranked state-supported and private
universities. Education is virtually free for top students coming from
households having less than $35,000 in annual income plus social benefits like
Food Stamps and free Medicaid.
Thirdly, for students of lesser ability wanting to go to college the USA has
a fantastic network of state-supported universitiess, community colleges, and
branch campuses that are relatively low cost and not anywhere close to the
median tuition costs reported in the above article. Online degree alternatives
have exploded from these institutions which enables many students (especially
young parents) to live at home and not have to pay room and board costs on a
campus.
In the U.K., open university has hundreds of thousands of students who pay
less than £5,000, over 60,000 of them pay almost nothing. There are many other
universities in the U.K. that are similarly low cost.
I have only one comment left about the above article --- HOGWASH!
The problem is not the cost of higher education in the USA.
The problem is that the diplomas mean less and less due to grade inflation.
They are not a good deal due to the high cost of tuition. They are becoming a
worse and worse deal because of grade inflation that renders the education more
and more meaningless.
December 28, 2015 reply from Robin Alexander
I agree with Bob on this one. The article didn’t
give a hint on how it derived its numbers, and in Hungary’s case, they
didn’t seem to take the "free tuition if stay in country 10 years" into
account when making it #1 in percent of income eaten by tuition. Totally
undependable. But it gives rise to several points:
1. I do think that gross tuition (not taking into account loans, grants,
scholarships, etc.) is rising faster than median income as are crucial
services such as health care. This can cause problems for some qualified and
motivated students.
2. I agree that grade inflation is a huge problem. I graduated with
around a 2.8 (I was a late bloomer) that was considered good but not great
in my day. Towards the end of my teaching career, anybody with less than a
3.5 was barely considered hirable! I think the trend to grade inflation
really took off when “student evaluations” began to be used unscientifically
for raises and promotion at universities. Whatever the cause, at my
university there was tremendous pressure from deans on up to pass more
students and not give the grade they had earned. One of my colleagues
stuck to her guns and gave grades that the students deserved and for this
she was hounded out of the U.
3. I believe one of the worst things one can do to a young person is to
encourage an unable and unmotivated student to go to college. They will gain
little of benefit from the experience and will drag down the experience of
those who really want to be there.
There’s more, but this will do for now.
Robin Alexander
**How to Mislead With Statistics
Double-Counting of Investment
by Robert J. Barro, NBER Working Paper No. 25826
Issued in May 2019, Revised in July 2019
https://www.nber.org/papers/w25826
The national-income accounts double-count investment, which enters once when it
occurs and again in present value as rental income on added capital. The
double-counting implies over-statement of levels of GDP and national income.
Across countries, those with higher propensities to invest artificially look
richer gauged by per capita GDP. There is also exaggeration of capital-income
shares. An alternative measure involves a form of full expensing of gross
investment. In the steady state, revised product and income correspond to
consumption. Outside of the steady state, the measure deviates from consumption
because full expensing applies to the long-run flow of gross investment.
You may purchase
this paper on-line in .pdf format from SSRN.com ($5) for electronic delivery
What the heck does “three times less than” mean? ---
https://blogs.scientificamerican.com/roots-of-unity/the-mathematical-phrase-that-melts-my-brain/
Thank you Bob Overn for the heads up.
Bob Jensen's threads on free online mathematics tutorials are at
http://faculty.trinity.edu/rjensen/bookbob2.htm
Scroll down to Mathematics and Statistics
**How to mislead with statistics
Why are government workers in California paid twice
as much as private sector workers?
https://www.hoover.org/research/140000-year-why-are-government-workers-california-paid-twice-much-private-sector-workers
Jensen Comment
I do point out that this is rooted in a Hoover Institute study. This makes it
good news and bad news. The good news is that Stanford University's Hoover
researchers are pros. The bad news is that they can also be biased in the Hoover
Tower. The good news is sample size in the millions. The bad news is that
averages can be misleading when they aren't accompanied by distribution
information regarding standard deviations and skewness. For example, the private
sector data might be skewed downward by minimum wages that are lower than
low-end government pay. The private sector employs people with a greater variety
of skills or lack thereof.
**How to Mislead With Statistics
Median income data overstate progress in some ways ---
https://real-estate-and-urban.blogspot.com/2019/08/the-median-male-earner-top-line.html
Has
the median man made progress economically since 1980? Not really. While
male median income rose (in 2017 $) from $35,589 to $40,396, or 13.5
percent, this modest increase masks the fact that the share of men in their
peak earnings years has increased, and that earnings at the median within
peak earnings years categories have decreased.
| |
Share in Age
Category |
Median
Earnings (2017 $) |
| |
1980 |
2017 |
1980 |
2017 |
|
15-24 |
0.216 |
0.120 |
$13,057 |
$13,734 |
|
25-34 |
0.232 |
0.183 |
$44,252 |
$40,575 |
|
35-44 |
0.161 |
0.167 |
$56,911 |
$52,403 |
|
45-54 |
0.136 |
0.169 |
$56,732 |
$53,985 |
|
55-64 |
0.127 |
0.165 |
$45,200 |
$48,863 |
|
65+ |
0.127 |
0.196 |
$20,845 |
$32,654 |
Note that population share for 35-64, prime
earnings years, rose from 1980 to 2017; earnings fell for every population
group between 25 and 54. The median 30 year old is making less than their
counterpart from 27 years earlier, as is the median 40 year old, as is the
median 50 year old.
Had income within each age category remained
constant at 1980 levels, current median income for men could be $40,306, or
almost exactly where it us now. On an age adjusted basis, there was no
median income growth. But that probably overstates economic well being at
the middle--the one category where income has risen rapidly is the 65+
group, which may reflect the fact that 65 year olds no longer feel that they
can retire. So when current generations think they are not keeping up with
the past, they are on to something.
Some notes: (1) I use 1980 as the base year,
because how median income was measured changed that year, and so previous
years are not as comparable. (2) I look only at men, because the labor
force participation rate among women has changed so much that 1980 and 2017
data are not comparable (although it is no doubt the case that women are far
more economically independent now than in 1980).
**How to Mislead With Statistics of Merit Scholars: "Mom, Please Get Me Out
of South Dakota!"
Probabilities of Being a Merit Scholar Vary Intentionally With Geography: The
Odds are Higher in East St. Louis or Cactus Gulch, Nevada
"Not-So-National Merit," by Ian Ayres, Freakonomics, April 4, 2014 ---
http://freakonomics.com/2014/04/04/not-so-national-merit/
Last December, thousands of high school sophomores
and juniors learned the results of the 2013 Preliminary SAT (PSAT) test.
The juniors’ test scores will be used to determine whether they qualify as
semifinalists for the prestigious National Merit Scholarship, which in turn
makes them eligible for a host of automatic
college scholarships. (Sophomores take the test
just as practice.)
The juniors will have to wait to find out for sure
if they qualify until September, just before they begin submitting
applications to colleges across the country. But it is fairly
straightforward to predict, based on their scores and last year’s cutoffs,
whether they will qualify as semifinalists.
Many students would be
surprised to learn that qualification depends not only
on how high they score, but also on where they go to school.
The National Merit Scholarship Corporation (NMSC) sets different qualifying
cutoffs for each state to “ensure
that academically talented young people from all parts of the United States
are included in this talent pool.” They have not
disclosed any specific criteria for setting the state cutoffs.
A high school student’s chances of receiving the
award can depend crucially on his or her state of residence. Last year,
students in West Virginia needed only a 203 to qualify as a semifinalist
(scores range from 60-240), while students from Texas needed a 219 and
students from Washington, D.C. a 224. Nationally, the West Virginia score
was in the 97thpercentile of scores, while the Washington DC
score was at the 99.5th percentile based on a mean score of 143
and a standard deviation of 31.
I’ve crudely estimated that because of this state
cutoff discrimination, approximately 15% of students (about 2,400 students a
year) who are awarded semifinalist status have lower scores than
other students who were not semifinalists merely due to their geographic
location. Troublesomely, I also found that states with larger minority
populations tend to have higher cutoffs.
Instead of just complaining, I have partnered with
an extraordinary high-school sophomore from New Jersey named India
Unger-Harquail to try to do something about it.
We’ve just launched a new website, AcadiumScholar.org.
You can go to site, enter a score, and it will quickly
tell you the states where your score would have qualified you as an NMSC
semifinalist.
But wait, there’s more. The site also offers to
certify qualified students based on a national standard of merit. If you
represent and warrant to us that you received a PSAT score meeting the
minimum cutoff in at least one state (and you give us the opportunity to try
to verify the accuracy of your score with NMSC), we’ll give you the right to
describe yourself as an “Acadium Scholar.” We’ve separately applied to the
USPTO to registrar that phrase as a certification mark
(in parallel fashion to my earlier “fair
employment mark”).
Instead of the yes-or-no signal offered by the NMSC,
we’ll also certify students based on the number of states in which they
would have qualified as semifinalists. For example, a student who scored a
211 could be certified to describe herself as a “19-state Acadium Scholar.”
Our certification allows:
· A student from a strong cutoff-state,
like Texas, who scores a 218 (just missing the Lone Star qualifying
cutoff of 219) to say nonetheless that he’s a 41-state Acadium Scholar.
· A student from a weak cutoff state,
like North Dakota, who scores an extraordinary 235 on the exam to say
that she is a 50-state Acadium Scholar.
We’re even letting sophomores use their scores to
certify so that all the pressure isn’t on junior year. There are also some
sophomores who may have scored ten points better in their sophomore than
their junior year. Now those students can certify as Acadium Scholars based
on their higher scores.
Continued in article
Jensen Comment
Many elite colleges in search of diversity in geography as well as race and
religion admit to varying admission standards for geography. It's harder to get
into Harvard from Massachusetts than it is from Wyoming or Alaska.
Bob Jensen's threads on assessments ---
http://www.trinity.edu/rjensen/Assess.htm
**How to mislead with statistics
"More than half of Harvard's most recent graduates had an A- GPA or better,"
by Peter Jacobs, Business Insider, May 27, 2015 ---
http://www.businessinsider.com/more-than-half-of-harvards-most-recent-graduates-had-an-a-gpa-or-better-2015-5
Jensen Comment
This is misleading in a sense that the GPA is not a normal distribution. Grades
are truncated more above A- (since no grades higher than A are awarded) whereas
grades below A- are less truncated (with possibilities of B+, B, B-, C+, C, C-,
D+,D, D-, and F). This means that a whole lot of students probably got A grades
to bring the mean clear up the A-.
Bob Jensen's threads on grade inflation ---
http://www.trinity.edu/rjensen/Assess.htm#RateMyProfessor
**How to Mislead With Statistics
Anaesthetist John Carlisle has spotted problems in hundreds of research papers —
and spurred a leading medical journal to change its practice ---
https://www.nature.com/articles/d41586-019-02241-z
**How to Mislead With Statistics and Visualization/Graphs
"I'm Business Insider's math reporter, and these 10
everyday things drive me insane, by Andy Kiersz, Business Insider,
August 2, 2015 ---
http://www.businessinsider.com/things-annoying-for-a-quant-reporter-2015-4
Bob Jensen's threads on common statistical analysis and
reporting mistakes ---
http://www.cs.trinity.edu/~rjensen/temp/AccounticsScienceStatisticalMistakes.htm
Bob Jensen's threads on multivariate data visualization
---
http://www.trinity.edu/rjensen/352wpvisual/000datavisualization.htm
**How to mislead with statistics
The United States of Elder Fraud – How Prevalent is Elder Financial Abuse
in Each State?
https://www.comparitech.com/blog/vpn-privacy/elder-fraud-by-state/
Jensen Comment
This is not a totally misleading article. However, some exhibits are misleading
like the color-coded map of the 50 states showing the extremely low elder fraud
rates in Alaska, Vermont, Hawaii, Wyoming, North Dakota, and Vermont. Guess
what? This is more due to low populations than to elder fraud rates.
**How to Mislead With Statistics
"‘Flipping’ Classrooms May Not Make Much Difference."
by Hannah Winston, Chronicle of Higher Education, October 22, 2013 ---
http://chronicle.com/blogs/wiredcampus/quickwire-flipping-classrooms-may-not-make-much-difference/47667?cid=wc&utm_source=wc&utm_medium=en
In preliminary research,
professors at Harvey Mudd College haven’t found that students learn more or
more easily in so-called flipped courses than in traditional classes,
USA Today reports. In flipped courses,
students watch professors’ lectures online before coming to class, then
spend the class period in discussions or activities that reinforce and
advance the lecture material.
Earlier this year, the National
Science Foundation gave four professors at the college in Claremont, Calif.,
a three-year grant for $199,544 to study flipped
classrooms. That research isn’t complete yet, but the professors already
tried flipping their own classes last year and found “no statistical
difference” in student outcomes.
The article notes that flipping
classes requires professors both to record lectures in advance and to come
up with activities that will engage students in class sessions. Nancy Lape,
a professor of engineering at Harvey Mudd, said instructors’ lives “might be
easier and their students might be happier if they just do a traditional
class.”
Jensen Comment
This is not surprising since most studies of pedagogy alternatives find that
pedagogy choice does not in general make significant statistical differences.
This is widely known in the Academy as "The No Significant Differences Finding"
---
http://www.trinity.edu/rjensen/Assess.htm#AssessmentIssues
The basic finding is that students tend to do whatever it
takes to earn the highest grades that they can attain, thereby overcoming
pedagogy differences such as in-class lectures versus flipping lectures versus
Socratic method versus the BAM pedagogy of making students learn everything on
their own.
But the "The No Significant Differences Finding" in my
opinion is misleading. Nearly all the empirical studies have limited the
assessment of pedagogy to short term effects. Flipping the classroom and even a
more extreme pedagogy like BAM forcing students tot learn on their own has been
shown to have greater impact on long-term memory. In other words students tend
to have longer memory of things they learned on their own as opposed to being
spoon fed in course via a lecture and help sessions ---
http://www.trinity.edu/rjensen/265wp.htm (where the BAM Pedagogy is
explained)
*
*How
to mislead with statistics
The Most Dangerous States in America ---
http://247wallst.com/special-report/2015/01/02/the-most-dangerous-states-in-america-2/?utm_source=247WallStDailyNewsletter&utm_medium=email&utm_content=JAN22014A&utm_campaign=DailyNewsletter
Jensen Comment
I think California is the most dangerous state in America, but it does not make
the "most dangerous" list. This in large measure is due to having the
highest population denominator for
percentage calculations.
California is dangerous because it has the most violent gang members and an
increasing tendency to be lenient because of overstuffed prisons. California is
also lenient in deporting many illegal alien criminals who most likely should go
to prison. Most of them are back in California in less than a month.
California also has some of the most underfunded police departments in the
USA, and this is showing up in crime statistics. Exhibit A is the bankrupt city
of Stockton.
**How to Mislead With Statistics
Foreign Kidnapping Numbers ---
http://www.businessinsider.com/countries-with-kidnapping-risk-2013-11
The data do not necessarily translate well to probabilities of being
kidnapped. As the article notes, the data are likely to be underreported for
various reasons. Firstly, nations vary as to integrity in reporting data.
Exhibit A is China. Secondly, nations may not be aware of some kidnappings that
were never reported to authorities before or after payoffs, particularly payoffs
for kidnapped employees of multinational companies.
The higher risk nations vary as to population and size such as when comparing
India with Haiti. Risks vary with regions within a country such as in Mexico
where kidnapping risks are higher in Mexico City than in popular coastal tourist
centers. In other nations like Nigeria and Pakistan the risks are greater in
rural parts of the nation where enemies of the USA are more concentrated.
Lots of people go to Mexico for a holiday. but the tourists are selective
about where they visit. Who goes to Nigeria or Venezuela for a holiday? Bolivia
is not mentioned in this study, but Bolivia is a USA-hating nation that's
becoming South America's safe haven for Jihadists.
The risks are higher with wealthy tourists and employees of multinational
corporate piñatas. Volunteers helping the poor are less at risk even though
there are always risks that should not be ignored. What I'm saying is that
kidnapping risks are lower for Habitat for Humanity volunteers building houses
in Haiti than for oil company executives working in Nigeria who do not dare to
let their guards down in this nation of poverty and vicious hate and Jihad.
Kidnapping statistics can be very costly to developing nations.
I know quite a few people in San Antonio who used to travel back and forth quite
often to Mexico. Most of them are more hesitant to cross the border these days.
Just a few years ago these folks would visit family living in Mexico and/or
cross the border to provide teaching and research services to colleges and
businesses in Mexico. I myself taught for short periods at the high technology
university called
Monterrey
Tech. I also did some consulting in Pueblo. Now I hate to admit it but I
would be very hesitant to go it alone to work in Mexico even if the probability
is really negligible that I would be kidnapped. Fear can play tricks even with
statisticians. On the other hand I don't know any persons who fear going to
India because of kidnapping risks. The hot weather, congested public
transportation, and plumbing are probably more worrisome.
**How to Mislead With Statistics (Distortions, Definitions)
50 million Americans live below the official poverty income — here are the
poorest towns in every US state
https://www.businessinsider.com/poorest-towns-in-every-us-state-2018-9
Jensen Comment
This is highly misleading for a number of reasons. Firstly the poverty line in
the USA is upper middle class in the majority of other nations, especially when
things like the safety nets of earned income credits, Medicaid, SS disability
income, food stamps, housing subsidies, and welfare are factored into the
equation.
Secondly there's an enormous $2+ trillion underground economy where
supposedly USA's "poor people" are collecting substantial tax-free cash earnings
that are never reported by employers or employees. Often those unreported
earnings are supplemented by food stamps, housing subsidies, and welfare. The
types of underground economy earnings alternatives are listed at
http://www.cs.trinity.edu/~rjensen/temp/SunsetHillHouse/SunsetHillHouse.htm
And remember that crime often pays in America. Some of the fattest cats in
the luxury penthouses that drive the most expensive cars are drug dealers,
legislators, and City Hall executives.
Jensen Comment
Jacob Soll has a somewhat unique joint appointment at USC. He purportedly is
both a professor of accountancy and a professor of history. I could not find him
listed in my 2013 edition of the Hasselback Accounting Faculty Directory.
**How to Mislead
With Statistics
"Greece's Accounting Problem," by Jacob Soll, The New York Times,
January 20, 2014
http://www.nytimes.com/2015/01/21/opinion/greeces-accounting-problem.html?_r=1
Greece is back as a focal point of the world financial
crisis. While coming elections are spooking the markets, the supposed cause
of the crisis has not changed. Greece has a declared debt of 319 billion
euros, or about $369 billion, 175 percent of its 182-billion-euro ($210
billion) gross domestic product. This sounds like a nearly impossible task
for any government: to govern effectively, spur economic growth and avoid
default. The shackles of the declared Greek debt have effectively paralyzed
the country. Yet maybe all of this debt drama is unnecessary.
The way this story is usually told, inside and
outside Greece, is as a morality play: the profligate Greeks don’t pay taxes
and their banks and elites, in turn, rob Greek citizens and foreign
investors alike. The Greeks, it seems, need to be held accountable and to
pay back their debt at any cost.
The brutal and counterproductive response has been
austerity. But given Greece’s problems, what the country really needs is
transparency and accountability. Greece has a very weak tradition of
accounting, with few homebred trained accountants. The government does not
use International Public Sector Accounting Standards, or Ipsas, which
measure liabilities and assets over time, similar standards to those used by
leading governments, businesses, banks and investors at all levels. It’s of
little surprise that without internationally verifiable accounting
standards, no one feels the need to be accountable.
This lack of accountants not only means poor
administration; it also means that the Greek government has done a lousy job
of accounting for its debt number. In fact, the debt has been calculated to
be larger than it actually is, or would be if one used Ipsas.
Without real accounting, we also can’t evaluate the
claims of Prime Minister Antonis Samaras’s government — as well as those of
numerous commentators — that Greece has made improvement in its fiscal
position over the last two years. If the European Commission, the
International Monetary Fund and the European Central Bank (known as the
troika) are giving Greece 283 billion euros ($327 billion) of financing in
return for good economic indicators — and credit ratings agencies like
Moody’s shake Greek and eurozone economies with pronouncements made on these
numbers — one would think they would want to verify the numbers, using Ipsas,
which would be much more transparent and something people outside the troika
could realistically evaluate.
But the Greeks are not the only ones content with
bad accounting and fishy numbers. The troika itself does not use Ipsas in
calculating Greek debt, but rather what is confusingly called the Maastricht
definition of debt, which is based on face value.
Think of face value as a promise to pay something
in the so-far-distant future because its value is essentially worthless
today if you don’t get interest payments. This means that the troika
calculates debt neither according to its financial worth, but rather
according to a political agreement that ignores very low interest rates and
the fact that money increases in value the longer you can hold and invest
it. This is working to Greece’s advantage, but Greece can’t show it, and
thus benefit from better credit ratings. Continue reading the main story
Continue reading the main story Continue reading the main story
Neither economic principles nor international
accounting standards would regard this as an acceptable way to report a debt
position. Greece was so cash-strapped and used to European Union handouts
that its leaders signed off on the bailout deal without international
accounting standards.
The fact that Germany has acted as a vigilant
gatekeeper over Greece’s agreement to abide by the agreed debt and austerity
measures should deserve scrutiny. Look again at the 57 billion euros ($66
billion) in German loans through the lens of accounting logic. The loans
have been made at under 2 percent with maturities as far out as 2054.
That means that, in reality, the interest on this
loan is under market rates. Giving loans well under market rates with gaping
repayment schedules amounts to a grant. According to Ipsas standards on
German debts, this portion of the debt alone would require only about 13
billion euros ($15 billion), leaving Germany with a considerable
44-billion-euro ($51 billion) loss.
But given the current draconian austerity
conditions, Germany might be able to avoid showing the losses on the loan,
yet it will destroy Greece in the process. Germany’s demands for both
austerity and overvaluing of the debt are both unjust and counterproductive
for Greek and European stability.
Greek debt is not what it seems. One reason might
be that the Germans have refused to price the debt fairly, or properly
report its value, which means in the short run that they extract more
austerity from the Greeks than they should, and that they also keep this
loan off the budget balance sheets because it would come up as a loss under
any legitimate accounting standard.
A little-known fact is that the Germans also do not
use Ipsas and have notably opaque public finance standards. This means their
potential loss on the Greek loan is out of sight of the German public, who,
not great fans of the Greek bailout, would be even less enthusiastic if they
understood the terms.
It should also be noted that the Greek crisis has
contributed to the 15 percent drop in value of the euro over the last year,
and, with this low rate, German exports have been given a huge boost.
By overstating Greek debt and effectively creating
a false sense of crisis (the Greeks have been bailed out), the troika is
undermining growth and investment through both the drama of overstated debt
and by austerity measures that are ripping apart Greek society. If Greece
continues with the yoke of this inaccurate debt number, it faces more
recession and possibly political unrest, further destabilizing a hobbled
Europe and the euro.
Greek leaders should demand neither more austerity
nor debt default. They should simply ask that the debt be calculated using
Ipsas. And while they are at it, they should implement Ipsas at home to
boost confidence, investment, credit and political stability. Clear
accounting would show the Greek debt to be lower, stabilize the country, and
bring confidence to Greece and, correspondingly, to the euro.
Jacob Soll, a professor of history and accounting at the University of
Southern California, is the author, most recently, of “The Reckoning:
Financial Accountability and the Rise and Fall of Nations.”
**How to Mislead With Statistics:
Over-Diagnosis and Over-Treatment
"The Case Against Early Cancer Detection," by Christie Aschwanden, Nate
Silver's 5:38 Blog, November 24, 2014 ---
http://fivethirtyeight.com/features/the-case-against-early-cancer-detection/
**How to Mislead With Statistics (Denominator Effect, Outliers )
American public schools
receive on average about 9% of their revenue from federal sources, 47% from
state sources, and 45% from local sources
School Districts Spending the Most
http://247wallst.com/special-report/2016/09/09/school-districts-with-the-highest-spending/?utm_source=247WallStDailyNewsletter&utm_medium=email&utm_content=SEP092016A&utm_campaign=DailyNewsletter
Jensen Comment
The USA school districts spending the most tend to be up to their necks in oil
and gas revenue in Alaska, but this is changing due to falling oil prices.
High valued property districts in New York rank high, in part, because New
York does not set limits on how much rich districts can spend per pupil.
However, the rankings regarding which districts spend the most is greatly
impacted by a "denominator effect" where they rank high to a great deal because
they have so few students. The joke in Vermont is that some school districts
have more school board members than students. Remember that the entire State of
Vermont only has about a half million people.
The "denominator effect" is illustrated most dramatically by a very small
(among the many small) school districts in Vermont ---
http://247wallst.com/special-report/2016/09/09/school-districts-with-the-highest-spending/2/
8. Rivendell Interstate School District, Vermont
> District spending per pupil: $33,975
> State spending per pupil: $16,988
> Median household income: $58,317
> Enrollment:
277 (all
grades)
Rivendell is the only
school district outside of Alaska and New York to rank among the 10 biggest
per pupil spenders. The district serves students from both Vermont and New
Hampshire and spends nearly $34,000 per pupil each year. However, due to
recently passed legislation designed to make Vermont’s many small and
disparate school districts more efficient, Rivendell will not likely remain
among the top spenders for long. In 2015, the state enacted legislation
known as Act 46, which stipulates that districts with less than 900 students
must merge
administrations
with other similarly small
districts. Though Rivendell is exempt from the law because it is an
interstate district, there are many strong financial incentives for it to
partner up with other districts.
**How to Mislead With Statistics (distortions)
The University of Maryland's "Incredibly Irresponsible" Research on the
Benefits of Chocolate Milk ---
http://www.vox.com/2016/1/16/10777050/university-of-maryland-chocolate-milk
**How to Mislead With Statistics
Paul Krugman Rejected by His Peers ---
Click Here
http://townhall.com/columnists/johncgoodman/2015/01/17/paul-krugman-rejected-by-his-peers-n1944174?utm_source=thdaily&utm_medium=email&utm_campaign=nl&newsletterad=
**How to Mislead With Statistics
The Gun Control Leaning Media Would Have Us Believe the USA Murder Rate is
Soaring When in Fact It's Not Soaring (albeit highly variable by city)
"Scare Headlines Exaggerated The U.S. Crime Wave: A full list of the top 60
cities gives a more nuanced picture." by Carl Bialik, Nate's Silver's
5:38 Blog, September 11, 2015 ---
http://fivethirtyeight.com/features/scare-headlines-exaggerated-the-u-s-crime-wave/
Question
Would you believe any study, even one pushed by the Washington Post,
that concludes that there is no racial difference between teenage crime in the
USA?
**How to Mislead With Statistics
'Another Bogus Academic Study Creates Bogus Headlines," by Colin
Flaherty, The American Thinker, February 2, 2015 ---
http://www.americanthinker.com/articles/2015/02/another_bogus_academic_study_creates_bogus_headlines.html
Thanks to the Washington Post, we have new entry in
what is surely the fastest-growing industry in academia: bogus studies that
purport to show there is no difference between black and white rates of
crime. The only difference comes from the big bad racist police,
prosecutors, parole officers, judges, juries, reporters, editors and others
who are also in on The Big Fix and relentlessly pick on black people, For No
Reason What So Ever.
Even in black cities with black mayors, black
police chiefs and black prosecutors -- like Washington.
This latest headline from the Post tells a shocking
story: “Black teens who commit a few crimes go to jail as often as white
teens who commit dozens.”
Or it would be shocking if it were true. But it is
not.
This headline, of course, flies in the face of
numbers that show violent crime for black people is astronomically out of
proportion: 5, 10, 50 times greater than crime rates for white people. Throw
Asians into the mix, and you can multiply that by 10 times more.
Turns out, they are also in on The Big Fix:
“Although there were negligible differences
among the racial groups in how frequently boys committed crimes,
white boys were less likely to spend time in a
facility than black and Hispanic boys who said they'd committed crimes just
as frequently, as shown in the chart above,” quoth the Post.
“Negligible differences among the racial groups?”
What? Where did that come from?
That gem of disbelief is contained in a study from
Tia Stevens Andersen of the University of South Carolina and Michigan State
University's Merry Morash.
And where did they get it? “Surveyors (from the
Department of Labor) asked youth whether they had stolen, destroyed
property, attacked someone or sold drugs in the last year.”
Read more:
http://www.americanthinker.com/articles/2015/02/another_bogus_academic_study_creates_bogus_headlines.html#ixzz3QdPFINSN
**How to Mislead With Statistics
"Computational Linguistics Reveals How Wikipedia Articles Are Biased Against
Women," MIT's Technology Review, February 2, 2015 ---
http://www.technologyreview.com/view/534616/computational-linguistics-reveals-how-wikipedia-articles-are-biased-against-women/?utm_campaign=newsletters&utm_source=newsletter-daily-all&utm_medium=email&utm_content=20150203
Jensen Comment
The biggest complaint I have with this article is that it does not explain or
even fully appreciate that Wikipedia is crowd
sourced. Articles about a man or about a woman cannot be written
or edited by that man or woman featured in the module. They modules have to be
written by others such as friends or colleagues. Consider the following
quotation from the BOVE article:
But there are other signs of a more insidious
gender bias that will be much harder to change. “We also find that the
way women are portrayed on Wikipedia starkly differs from the way men
are portrayed,” they say.
. . .
Wagner and co say that articles about women
tend to emphasize the fact that they are about a women by overusing
words like “woman,” “female,” or “lady” while articles about men tend
not to contain words like “man,” “masculine,” or “gentleman.” Words like
“married,” “divorced,” “children,” or “family” are also much more
frequently used in articles about women, they say.
There is no Wikipedia author or editorial board that writes the entries
about a man or a woman, although Wikipedia editors may modify the article
for slander or obviously inappropriate portrayals. But I deeply doubt that
the Wikipedia reviewers deliberately slant the article on gender issues.
That slant, if it exists, for a given entry was most likely put in by the
person who wrote or edited the entry, and there are millions of people
writing the entries about millions of men and women. My point is that
there's no single author or small group of authors who are writing these
entries.
Also virtually every biographical entry about a man or woman has a
"personal history" section that covers the history of marriages, divorces,
and children, and parents of the person in question. The words "married" and
"children" appear for virtually every person that was married and had
children irrespective of whether the person is male or female.
I'm not saying that there's not gender bias on occasion in Wikipedia.
What I am saying is that the gender bias over tens of millions of
biographies in Wikipedia are not the result of a gender-bias
conspiracy. That bias, when it appears in a module, exists is the result of
culture itself across tens of millions of authors of those biographies.
For example, I hypothesize that it's a culture thing when authors are
more apt to use the term "feminine" when writing about a woman versus
"masculine" when writing about a man. For centuries, authors about young
women frequently mention "tom boy" behaviors of young girls. How often do
authors talk about "girlie" features of young boys? It happens, but we've
read a lot more about "tom boys" in history than "girlie boys." --- Arnold
Schwarzenegger excepted.
the fact that gender bia is cultural does not make it right or wrong.
It is simply there, and perhaps we should applaud analysts trying to gather
data and change those cultural biases. Or perhaps we should applaud efforts
to keep those biases. As the saying goes "Viva Les Difference!"
Sometimes I think analysts go too far in misleading the public with their
statistics or in suggesting underlying causal intentions of those outcomes.
One of the best video clips from an American Accounting Association
annual meeting was the plenary speech of Jimmy Wales at the August 2014
annual meeting. I think this video is available only to AAA members (but I
could be wrong) ---
http://commons.aaahq.org/posts/0eddbcd42a
You can learn a lot about Wikipedia by watching this video.
Jimmy Wales is the leading cofounder of Wikipedia ---
http://en.wikipedia.org/wiki/Jimmy_Wales
And yet it describes how he was married three times. He is not described as
being "masculine" or "feminine."
Bob Jensen's threads on the history of professionalism and women ---
http://www.trinity.edu/rjensen/bookbob2.htm#Women
Before reading this tidbit it might be a good idea to read about why
statisticians cannot identify the "best" vegetable for you health even when cost
considerations are excluded ---
http://www.trinity.edu/rjensen/FraudConclusion.htm#BadNews
"The people who shaped higher education this year made their mark through
the courts; through the power of an idea; through the act of writing an open
letter; even in death. Here are 10 individuals who have had a lasting impact,"
by Ed O’Bannon, Chronicle of Higher Education, December 9, 2013 ---
http://chronicle.com/article/The-Chronicle-List-This/143485/?cid=wb&utm_source=wb&utm_medium=en
Jensen Comment
This listing is entirely subjective and highly controversial. For example,
should Aaron Schwartz be a role model because he openly and knowingly violated
copyright law? If he had not be punished by MIT it would be open season for
neglect of copyrights. If Aaron Schwartz has not been punished the wonderful
JISTOR scholarly journal archiving service might well have gone out of business.
Perhaps the most absurd choice of 2013 heroes are the philosophy professors
at San Jose State are called "MOOC Busters."
What makes MOOC busting ipso facto a good thing
to anybody except faculty unions and those who misunderstand the true purpose of
MOOCs?
**How to Mislead With Statistics
"Report by Faculty Group Questions Savings From MOOCs," by Lawrence
Biemiller, Inside Higher Education, October 16, 2013 ---
Click Here
http://chronicle.com/blogs/wiredcampus/report-by-faculty-organization-questions-savings-from-moocs/47399?cid=wc&utm_source=wc&utm_medium=en
In the second of a series of papers challenging
optimistic assumptions about massive open online courses, a coalition of
faculty-advocacy organizations asserts that online instruction “isn’t saving
money—and may actually be costing students and colleges more,” but that
“snappy slogans, massive amounts of corporate money, and a great deal of
wishful thinking have created a bandwagon mentality that is hard to resist.”
The paper,
“The ‘Promises’ of Online Higher Education: Reducing Costs,”
was released by the Campaign for the Future of Higher
Education, whose backers include a number of faculty unions. Drawing on news
articles and public-opinion surveys, it says that while the business model
supporting MOOCs is “still a work in progress,” the trend is to offer
courses free but charge for “a degree or a certificate or anything from the
MOOC that carries real value.”
Merely having taken one of the courses, the
paper says, is “virtually valueless in the marketplace.”
“The bottom line for students? The push for more
online courses has not made higher education cheaper for them. The promise
has always been that it will—but that day always seems to be in the future,”
the paper says.
MOOCs may also cost colleges money, the paper says,
citing an agreement between Udacity and the Georgia Institute of Technology
to offer
an online master’s degree in computer science.
“Udacity gets the intellectual content for a
master’s program of 20 courses at an upfront cost of $400,000,” the paper
says. “It borrows Georgia Tech’s reputation as its own, at a huge discount
(no training of graduate students, no support for labs, no decades of
accumulated know-how through which Georgia Tech earned its reputation). It
acquires these courses for a proprietary platform: Georgia Tech cannot offer
these OMS CS courses, created by its own faculty, to a competing
distributor.”
Continued in article
Jensen Comment
This is a classic study on how to mislead with statistics. The study does not
give credit to the fact that the MOOC effort commenced by Stanford that fits
totally within the Open Knowledge Initiative of MIT and other prestigious
universities was intended not to save money.
By definition, a MOOC is free to anybody in the world and does not have
prerequisites or admission standards. Anybody can take a MOOC free of charge by
the very definition of a MOOC. The prestigious universities offering such
courses intended these courses to give the world access to course materials and
some of the top teaching professors of the world.
There are adaptations like SMOCs, Future Learn, and Iversity that are
intended to become massive (10,000+ plus students) distance education courses
that are not MOOCs. And there are options to pay for transcript credits for some
MOOCs but this entails paying fees for competency-based examinations ---
http://www.trinity.edu/rjensen/000aaa/updateee.htm#OKI
Firstly, in my opinion the universities with hundreds of billions of dollars
in endowments given from rich sources that took advantages of tax deductions
when contributing to those endowment funds can well afford to offer some free
MOOCs. Were not talking in the case of Stanford, MIT, Harvard, Yale, Texas, etc.
about stealing tuition money paid by on-campus students and taxpayers to benefit
the poor people who take MOOCs. The universities offering free MOOCs can afford
to pay the costs from endowment funds ---
http://www.trinity.edu/rjensen/000aaa/updateee.htm#OKI
Second, what I find as inconsistent is that the same professors, often union
activists, arguing that: "Merely having taken one of
the (MOOC) courses, the paper says, is “virtually valueless in the marketplace,"
have not conducted any meaningful study of how many students who intently
completed MOOCs are using the knowledge gained. If they did they would find some
teachers who benefitted when taking licensure examinations to become teachers.
If they did they would find many college professors who added what they learned
in MOOCs to the courses they themselves teach. Most MOOCs, by the way, are
advanced courses on highly specialized topics like the literature of both famous
and obscure writers. Otherss are basic courses that contribute to career
advancement.
- For example, the business school at Penn, Wharton, now offers its core
MBA courses as free MOOCs. Some students who intently take these courses are
seeking to get into Wharton and other prestigious MBA programs.
- Sometimes the purposes of taking free Wharton MOOCs are to raise GMAT
scores to get into prestigious MBA programs and to do better in those
programs once admitted so that they too can tap those six-figure starting
salaries of graduates from prestigious MBA Programs.
- Sometimes the purposes of taking free Wharton MOOCs are to raise GMAT
scores to obtain better financial aid packages for further graduate study.
- Sometimes the purposes of taking free Wharton MOOCs are to perform
better on the job and thereby get better performance evaluations and raises.
Third, the above study ignores what universities save by having their
students take some off-campus free offerings. For example, the Khan Academy is
now partnering with various colleges that require free Khan Academy modules as
part of the curriculum. Those colleges do not have to hire as many instructors
like math instructors to meet the needs of students both at the introductory and
advanced levels of mathematics.
The study confuses free MOOCs with fee-based distance education. For example,
Harvard University offers many MOOCs as a free public service to the world. The
Harvard Business School, however, will soon offer expensive distance education
MBA courses because of enormous anticipated profits from those courses.
Fourth, if Georgia Tech is losing money on its online engineering degree it's
not necessarily a bad thing. Georgia Tech loses money on its on-campus
engineering degrees that require taxpayer subsidies to survive. Why are taxpayer
subsidies for Georgia Tech's online engineering degrees any worse in in
principle? An argument might be made that there is more justification since
taxpayers do not also have to subsidize room and board fees.
Five, distance education courses are gaining acceptance in the academic
sector, the private sector, and public sector. For example, a distance education
outfit called 2U has gained prestigious acceptance.
"3 Universities (Baylor, Southern Methodist, and
Temple Universities) Will Grant Credit for 2U’s Online Courses,"
by Steve Kolowich, Chronicle of Higher Education, July 30, 2013 ---
http://chronicle.com/blogs/wiredcampus/3-universities-will-grant-credit-for-2us-online-courses/45143?cid=wc&utm_source=wc&utm_medium=en
I have one word for the self-serving study cited above that contends;
"Merely having taken one of the (MOOC) courses, the
paper says, is “virtually valueless in the marketplace,"
My word for such an assertion is --- BARF!
Of course this not mean that there are not tremendous problems with MOOCs.
One of the problems is that most of them are advanced courses, thereby shutting
out introductory students.
Another problem is that most students sign up for MOOCs out of curiosity
without the intent, time, and ability to successfully complete the courses with
heavy sweat that is usually necessary for serious learning.. MOOCs probably
would pass the benefit-cost tests for these casual students, but the prestigious
universities are intending to make opportunities available to those students who
will successfully complete the courses for financial and other educational
benefits in their lives. These are courses they could never afford at on-campus
student prices.
Bob Jensen's threads on MOOCs and how to sign up for them from prestigious
universities in the USA, the United Kingdom, France, and now Asia ---
http://www.trinity.edu/rjensen/000aaa/updateee.htm#OKI
"News Bitcoin’s Rise Constrained by Heists and Lost Fortunes," by Tom
Simonite, MIT's Technology Review, December 11, 2013 ---
http://www.technologyreview.com/news/522411/bitcoin-loss-and-theft-woes/?utm_campaign=newsletters&utm_source=newsletter-daily-all&utm_medium=email&utm_content=20131211
A man showed up at a trash heap in Wales last month
with an unusual request: he needed help finding a hard drive he had thrown
out weeks earlier that held the cryptographic key to 7,500 bitcoins,
currently worth over $6 million.
James Howells is unlikely to ever be reunited with
that digital cash, and he’s far from alone in having lost a fortune in the
math-backed currency. Pioneers of Bitcoin are in high spirits due to the
currency’s rising value and the friendly reception it has received from U.S.
regulators (see “Regulators See Value in Bitcoin”). But the ease with which
bitcoins can be lost or stolen remains a barrier to mainstream adoption. And
no obvious remedy is in sight.
The problem is caused by the design of the software
that underpins Bitcoin. It uses cryptography to allow people to exchange
funds securely without trusting each other or needing a third party to
oversee the trade. But individual collections of bitcoins are secured using
an alphanumeric private key that is impossible to recover or reset if lost
or stolen, and is near impossible to memorize.
A private key resides in a simple text file called
a wallet file and looks something like this: E9 87 3D 79 C6 D8 7D C0 FB 6A
57 78 63 33 89 F4 45 32 13 30 3D A6 1F 20 BD 67 FC 23 3A A3 32 62. If
someone else learns that key or copies your wallet file, he or she can spend
your bitcoins; if you lose your key or wallet file, Bitcoin’s cryptographic
design makes it impossible to regain access to your bitcoins.
“The hackers figured this out really quickly. I
think this is a really bad thing for the bitcoin ecosystem,” said venture
capitalist William Quigley at the Future of Money conference in San
Francisco on Monday. He believes that bitcoins can’t become more than a
plaything for speculators unless tools and companies appear that make it
easier to manage and safeguard a bitcoin wallet.
It’s a concern echoed by other bitcoin investors
and entrepreneurs, including Steve Kirsch, a software entrepreneur turned
investor. He has converted over $1 million into bitcoins over the past six
months and has struggled to keep them both secure and accessible. “I think
that all of the existing mechanisms are problematic.”
Continued in article
**How to Mislead With Statistics
The 25 college majors that will lead to the lowest-paying jobs ---
http://www.businessinsider.com/college-majors-that-lead-to-the-lowest-paying-jobs-2015-5#ixzz3ZaIQmfD3
Jensen Comment
Such rankings on "pay" typically are misleading. Firstly, these are medians such
that half the people are earning more in each category and half the people are
learning less in each category. We need to know more about variances and reasons
for those variances --- often the variances are due to variances in living
costs.
Secondly, many of the low paying jobs are in education. But most of those low
paying jobs only entail working eight or less nine per year and can hardly be
compared with jobs that are nearly 12 months per year. Many parents are willing
to sacrifice pay for more opportunity to share time with their own families.
Many others take advantage of opportunities to earn more money in the off season
by writing books, working on organic farms, etc.
Some job categories are too vague to be compared. For example, what does a
job in "music" or "neuroscience" or "drama" entail? Typically music and "drama"
careers are highly variable in terms of time commitment. Performers may average
only a few hours or less per month in actual performance with highly variable
hours in practice and preparation. Music teachers, like other educators, are not
likely to have 12-month job commitments. Drama performers may not be so lucky.
Also majors do not necessarily translate to jobs requiring those majors. For
example about half of the law school graduates are now working in jobs that do
not require law degrees.
Lastly, it does not make much sense to compare "pay" without comparing
benefits. For example, teachers working for school systems typically get fairly
generous benefits in terms of medical insurance for 12 months while working less
than eight months on the job.
**How to Mislead With Statistics (distortion, misuse of the
word "proof")
"The Proof Liberal Arts Colleges Need?" by Scott Jaschik, Inside
Higher Ed, January 22, 2016 ---
https://www.insidehighered.com/news/2016/01/22/study-traces-characteristics-undergraduate-education-key-measures-success-life?utm_source=Inside+Higher+Ed&utm_campaign=2bec496f31-DNU20160122&utm_medium=email&utm_term=0_1fcbc04421-2bec496f31-197565045
January 23, 2016 reply from Bob Jensen
The study throws around the words "proof" or "proves" when
in fact the study is sloppy in terms of any scientific standards. Firstly,
the study ignores such issues as nepotism. For example, children of business
owners have the luxury of majoring in art history because a job to the top
is waiting for them after graduation in any major. And business owners can
afford the high tuition of prestigious liberal arts colleges.
Secondly, being active in social media often means you
have the time rather than having to spend 80 hours a week on the job with
almost no time for the social media, such as being a very successful
physician. For example, most physicians have less time to be active in the
social media and civic affairs than their stay-at-home spouses who majored
in art history at Swarthmore. And experiences in undergraduate education are
greatly confounded by what are often more meaningful experiences in graduate
education such as MBA school, law school, and medical school. And the study
would be terribly misleading if it focused only on undergraduates who did
not have any graduate education.
Thirdly there's an enormous problem in scientific studies
where humans self-report their behavior. No attempt was made to follow up
studies on the comparability of the self reports.
Fourthly, any type of "success study" is faces the
enormous problem of defining "success." I am reminded of a psychology
professor, Tom Harrell, that I had years ago at Stanford University. He had
a long-term contract from the U.S. Navy to study Stanford students when they
entered the MBA program and then follow them through their careers. The
overall purpose was to define predictors of success that could be used for
admission to the Stanford GSB (and extended to tests for admission into
careers, etc.) Dr, Harrell's research became hung up on "The Criterion
Problem (i.e., the problem of defining and measuring "success.") You will
have the same trouble whenever you try to assess graduates of any education
program whether it is onsite or online. What is success? What is the role
any predictor apart from a myriad of confounded variables?
You might take a look at the following reference:
Harrell, T.W. (1992). "Some history of the army general classifications
test," Journal of Applied Psychology, 77, 875-878.
Success may lie in advancement in the workforce into
leadership roles, but promotion and opportunity are subject to widely
varying and often-changing barriers and opportunities. A program's best
graduate may end up on a dead end track, and its worst graduate may be a
maggot who fell in a manure pile. For example, it used to be virtually
impossible for a woman to become a partner in a large public accounting
firm. Now the way is paved with all sorts of incentives for women to hang
in there and attain partnership. Success also entails being at the right
place at the right time, and this is often a matter of luck and opportunity
as well as ability.
Bob Jensen
**How to Mislead With Statistics (distortions, denominator effects)
Measuring human capital: a systematic analysis of 195 countries and
territories, 1990–2016
https://www.thelancet.com/action/showPdf?pii=S0140-6736%2818%2931941-X
Jensen Comment
Firstly, rankings can be easily distorted by denominator effects that compare
highly populated and diverse nations with small nations. It's like comparing
rates of growth of infants (who double their weight and height in few years)
with teenagers )that rarely double their weight and height). Also racial and
ethnic homogeneity coupled with small size account for a lot of Nordic country
attainment in human capital. Hundreds of thousands of unhealthy and poorly
educated immigrants are not pouring into Finland each year.
This study ignores the leading reasons why scholars from around the world are
seeking to go to graduate school (including medical school) in the USA relative
to Nordic countries, Singapore, and South Korea.
The study above is good for analyzing rates of improvement in human capital
of nations. But it's also misleading in terms of identifying nations favored by
immigrants if they're given a choice to live anywhere in the world. In spite of
its limitations the USA is still a great land of opportunity that does not show
up in the above rankings of nations. Of course that does not mean that our
public education system is serving the majority as well as Finland. It does not
mean that our health care system is serving the majority as well as Finland. But
Finland does not face the enormous problems that the USA faces in serving its
majority.
And yes Finland provides free college education. But it does so only for the
top third of its people. The other two thirds are not allowed into college ---
as is the case for virtually all European nations. And most of the training in
Finland for skills in the trades is provided by private sector companies rather
than taxpayers.
It's very easy to be mislead when comparing human capital betterments in
Finland with the USA. For example Finland's K-12 education system does very well
because of learning that nearly all children get in two-parent homes.
Finland does not have the high proportion of single-parent homes where learning
school work at home is doubly hard.
And remember that Finland is more of a capitalist nation than the USA.
Singapore is more capitalist than the USA. Capitalism can be very good for
attaining high human capital achievements.
**How to Mislead With Charts
"How to Lie with Charts," Harvard Business Review, December 2014
---
https://hbr.org/2014/12/vision-statement-how-to-lie-with-charts
The above link is only a teaser. You have to pay to see the rest of the article.
"BP Misleads You With Charts," by Andrew Price, Good Blog, May
27, 2010 ---
Click Here
http://www.good.is/post/bp-misleads-you-with-charts/?utm_source=feedburner&utm_medium=feed&utm_campaign=Feed%3A+good%2Flbvp+%28GOOD+Main+RSS+Feed%29
"Correlation or Causation? Need to prove something you already believe?
Statistics are easy: All you need are two graphs and a leading question," by
Vali Chandrasekaran, Business Week, December 1, 2011 ---
http://www.businessweek.com/magazine/correlation-or-causation-12012011-gfx.html
How to Mislead With Statistics
"Reminder: The FBI’s ‘Police Homicide’ Count Is Wrong," by Reuben
Fischer-Baum, Nate Silver's 5:38 Blog, November 12, 2014 ---
http://fivethirtyeight.com/datalab/reminder-the-fbis-police-homicide-count-is-wrong/
How to Mislead With Statistics
"Some Stats Are Just Nonsense," by Cullen Roche, Pragmatic Capitalism
via Business Insider, November 15, 2014 ---
http://www.businessinsider.com/historical-statistical-and-nonsensical-2014-11
How to Mislead With Statistics
Common Accountics Science and Econometric Science Statistical Mistakes ---
http://www.cs.trinity.edu/~rjensen/temp/AccounticsScienceStatisticalMistakes.htm
**How to Mislead With Statistics (distortions with fake data)
How a $9 billion startup (Theranos) deceived Silicon Valley ---
http://www.businessinsider.com/john-carreyrou-how-theranos-deceived-silicon-valley-startup-bad-blood-sample-technology-2018-5
John Carreyrou of The Wall
Street Journal broke the original story about how Theranos, a company that
pitched a revolutionary blood-testing system, was misleading investors,
patients, and business partners about how its technology worked. Carreyrou's
new book, "Bad Blood," documents the history of Theranos and how its CEO
Elizabeth Holmes sold a vision that was too good to be true. Carreyrou sat
down with Business Insider to talk how Theranos was able to pull off this
massive deception. Following is a transcript of the video.
Steve
Kovach:
Theranos was one of those Silicon Valley stories that sounded too good to be
true. It was going to revolutionize the laboratory testing industry. And it
turns out, it was too good to be true. John Carreyrou of The Wall Street
Journal charted that story about Theranos in his new book, Bad Blood. John,
thanks for joining us.
John
Carreyrou:
Thanks for having me.
Steve
Kovach: So,
let's talk about what Theranos was saying it's technology could do and what
it was actually doing behind the scenes. What were they selling to the
public and investors?
John
Carreyrou:
Right, so, when I started looking into the company in early 2015, they had
already gone live with the blood test for a year and a half.
Steve
Kovach: And
this was in Walgreens?
John
Carreyrou:
In Walgreens stores, they'd rolled out in a couple Walgreens stores in
Northern California and then another 40 or 45 Walgreens stores in the
Phoenix area. And the claim was that they had a technology that could run
the full range of laboratory tests from just a drop or two of blood pricked
from the finger, get you very fast results and do it at a fraction of the
cost as regular laboratories, even cheaper than Medicare. The reality was
that Theranos had a prototype that was the last iteration of its device
called the Mini Lab. And that was a malfunctioning prototype that it was
still trying to make work. And when they had gone live in the fall of 2013,
they had gone live with a previous iteration of the technology they called
the Edison, so named after Thomas Edison, that was actually a very limited
machine. It could only do one class of blood tests known as immunoassays.
And it didn't do those tests well. It was an error-ridden machine. And so
for the rest of the tests on the menu, and they had about 250 tests on the
menu, they had hacked machines made by the German conglomerate, Siemens.
They had modified them so that they could accommodate small blood samples.
And then there was a third bucket of tests that they just did the regular,
the old regular way with venous draws, drawing the same amount of blood as
everyone else and running it also on commercial analyzers.
Steve
Kovach: So
how does this happen? This is a highly regulated industry here in the US,
you would think something like this that was mostly smoke and mirrors
wouldn't be able to get past regulators let alone into a major retail chain
like Walgreens. What did Elizabeth Holmes and her colleagues do to sway
regulators and sway Walgreens into believing that this should actually be
put to use on real patients?
John
Carreyrou:
Right. So for one thing they exploited a, what I call a regulatory no man's
land, in the laboratory space. You have on the one hand the FDA which
regulates reviews and improves the laboratory instruments that labs use that
they buy off the shelf and that they use in their labs. And on the other
hand, you have CMS, the Centers for Medicare and Medicaid Services, which is
the regulator of clinical laboratories. But, then there's this category of
tests known as laboratory developed tests which are fashioned by labs with
their own methods that aren't really regulated by either of these entities.
And Elizabeth Holmes and her boyfriend, Sunny Balwani, were able to exploit
this third category and say we fall in this category, what are known as LDTs,
because we're using our own proprietary machine within the walls of our own
lab. Therefore, we don't have to be reviewed by the FDA or at least our
machines don't have to be reviewed by the FDA. And CMS which regulates labs
doesn't look closely at LDTs so that's the loophole that they were able to
exploit. Theranos had been doing, had been attempting to validate its
technology for years with pharmaceutical companies. All these validation
studies with big pharma companies had failed and in early 2010 it was
running out of options so it decided to go straight to consumers. And the
way to do that was to align with a retail partner and so they started
courting Walgreens. And they told Walgreens, we've got this great
technology, it's portable, it can do all these tests off just a drop of
blood and we want to partner with you. And Walgreens was desperate for a new
way to renewed growth. And so it started meeting with Elizabeth in Palo Alto
and in Chicago where Walgreens is based. And it hired a laboratory
consultant, named Kevin Hunter to help it do due diligence. And this guy,
Keven Hunter, as I explained in the book, very early on smelled a rat. And
tried to alert Walgreens executives to his suspicions and they just wouldn't
listen to him.
Steve
Kovach: So
these tests are being done in Walgreens, you know they're hyping the
technology, cover stories on famous magazines and so forth. Why weren't we
hearing much from the medical community or if we were why did it seem so
diminished? Why weren't there more flags from peers in the industry?
John
Carreyrou:
Right. There were whispers in especially the field of laboratory science.
But the bottom line is that the company was so secretive and very little if
anything was filtering out of the company itself. So, while there were some
skeptics in academia and in the field of laboratory testing, all they could
say was that there was this company that was getting a lot of hype, whose
founder was becoming a Silicon Valley celebrity, at the same time wasn't
doing what you usually do in medicine, which is that you publish studies
about your innovation and you publish them in peer-reviewed publications and
you have your peers check what you're doing and verify it. So there were a
couple laboratory scientists who actually wrote op-eds in scientific
journals. One of them was Dr. Ioannidis at Stanford who came out with a gen
op-ed in, I believe it was 2015. I'd already started digging into the
company at that point. A couple months later, a laboratory scientist at the
University of Toronto, I believe, had another op-ed in another scientific
journal.
Steve
Kovach:
Which no one reads these by the way, it's not like The Wall Street Journal
where everyone's going to see it. It's like these nerdy guys just talking
about it.
Continued in article
**How to Mislead With Statistics (distortions, correlations)
Zero Correlation Between Evaluations and Learning ---
https://www.insidehighered.com/news/2016/09/21/new-study-could-be-another-nail-coffin-validity-student-evaluations-teaching?utm_source=Inside+Higher+Ed&utm_campaign=ddd03ccf45-DNU20160921&utm_medium=email&utm_term=0_1fcbc04421-ddd03ccf45-197565045&mc_cid=ddd03ccf45&mc_eid=1e78f7c952
Jensen Comment
In fairness the article does caution against statistical quirks and misleading
conclusions.
The criticism that I would place on this is that there is no homogeneity
among sample items and an enormous problem of non-stationary states where
regression and correlation analyses fall apart.
Teachers get high student evaluations for many of the right reasons (personal
and individual time and attention) and the wrong reasons (fluff assignments and
easy course grading). The "zero correlations" have almost no meaning unless the
sampling populations are partitioned into reasons why teachers get high or low
evaluations that can sometimes be garnered from subjective comments such as the
comments in RateMyProfessor.com (where sample sizes are too small and self
selective for statistical analysis on numerical ratings). The best teacher that
I encountered in my 40 years in academe was a lousy classroom teacher. But she
spent and added 40+ hours one-on-one or two-on-one time in her office patiently
going over and over technical accounting rules until her students had a tough
accounting course etched in their brains. Her virtues were caring and patience
and rigor.
There's an enormous problem in defining "learning." In theory it should be
defined in terms of some performance measure that can be tested before a course
begins versus when a course ends. But even here there are all sorts of issues.
For example, my son had a third grade teacher in Tallahassee who could not
herself functionally read. She could hardly be evaluated for teaching of
reading. Yet she was a great inspiration to him in terms of wanting to learn in
general and received praises from him even though another teacher had to be
brought in to teach reading. Hence the variable "learning" is confounded with
the variable "inspiration."
Some universities have a course called "CPA Review" that's usually very
popular with masters of accounting students who are facing the tough nation-wide
CPA examination (with a 15% to 25% first-time pass rate) after graduation.
Teachers might be evaluated on "learning" according to their students' ultimate
pass rates the first time they take the CPA examination. But there are all sorts
of complications with that since teachers cannot control the amount of
self-study between when the course ends and when the student ultimately
graduates and sits the first time for the CPA examination. There are many other
confounding variables that make CPA exam pass rates poor measures of learning in
a CPA Review course.
At a minimum learning should be validated independently of the teachers as
often is the case in competency-based testing ---
http://faculty.trinity.edu/rjensen/assess.htm#ConceptKnowledge
But there are issues with this since it encourages teaching to the tests rather
than teaching to the students.
I think the numerical parts of teaching evaluations are more
misleading than helpful in most (not all) courses. The subjective evaluations
are sometimes much more helpful, but here again there are cautions. Repeated
complaints like "everything I learned in this course I
had to learn by myself" was a common complaint among students of
three top teachers who team-taught Intermediate 1 and 2 courses at the
University of Virginia. Getting such evaluations became the goals of these
three professors using a BAM pedagogy (students called it DAMN pedagogy) ---
http://faculty.trinity.edu/rjensen/265wp.htm
**How to Mislead With Statistics (distortions with fake data)
Minnesota child day care fraud cash going to terrorists? (Day Care Centers
Weren't Caring For Children at All) ---
https://www.twincities.com/2018/05/15/child-daycare-fraud-cash-going-to-terrorists-lets-unpack-this/
Here’s the idea that’s freaking people out: “$100 million in Minnesota
taxpayer child day care fraud is going to Islamic terrorists.”
It doesn’t look like all of that is true — but parts of it are.
There’s a lot of smoke — and a lot of fire — around this story, which KMSP-TV/Fox
9 broke this week and has sent lawmakers and bureaucrats at the state
Capitol into action. And these actions and reactions have been all over the
place, ranging from hunkering in echo chambers to demanding answers to
pouncing on red political meat to, well, everything in between.
The main one
is titled
“Millions of dollars in suitcases fly out of MSP, but why?”
A
second report is important,
too, since it backs up some of the assertions. Both reports were led by
reporter Jeff Baillon.
Here’s what the reports say: There’s child care fraud going on. It might be
$100 million. Some of it might be going to terrorists. There’s $100 million
in cash in suitcases leaving MSP. Some of that money heads to the Middle
East or East Africa, including Somalia. Some of that money probably gets
skimmed by terrorists. The reports cite a combination of sources, ranging
from those with names and firsthand knowledge to anonymous sources, whose
credibility can’t be judged from outside.
Here’s what the reports do NOT say: “$100 million in Minnesota taxpayer
child day care fraud is going to Islamic terrorists.” Although the report
does suggest that’s possible, no source involved with the report actually
said that.
But that doesn’t mean this isn’t important. So let’s get into it.
Continued in Article
**How to Mislead With Statistics (distortions, denominator effects)
Measuring human capital: a systematic analysis of 195 countries and
territories, 1990–2016
https://www.thelancet.com/action/showPdf?pii=S0140-6736%2818%2931941-X
Jensen Comment
Firstly, rankings can be easily distorted by denominator effects that compare
highly populated and diverse nations with small nations. It's like comparing
rates of growth of infants (who double their weight and height in few years)
with teenagers )that rarely double their weight and height). Also racial and
ethnic homogeneity coupled with small size account for a lot of Nordic country
attainment in human capital. Hundreds of thousands of unhealthy and poorly
educated immigrants are not pouring into Finland each year.
This study ignores the leading reasons why scholars from around the world are
seeking to go to graduate school (including medical school) in the USA relative
to Nordic countries, Singapore, and South Korea.
The study above is good for analyzing rates of improvement in human capital
of nations. But it's also misleading in terms of identifying nations favored by
immigrants if they're given a choice to live anywhere in the world. In spite of
its limitations the USA is still a great land of opportunity that does not show
up in the above rankings of nations. Of course that does not mean that our
public education system is serving the majority as well as Finland. It does not
mean that our health care system is serving the majority as well as Finland. But
Finland does not face the enormous problems that the USA faces in serving its
majority.
And yes Finland provides free college education. But it does so only for the
top third of its people. The other two thirds are not allowed into college ---
as is the case for virtually all European nations. And most of the training in
Finland for skills in the trades is provided by private sector companies rather
than taxpayers.
It's very easy to be mislead when comparing human capital betterments in
Finland with the USA. For example Finland's K-12 education system does very well
because of learning that nearly all children get in two-parent homes.
Finland does not have the high proportion of single-parent homes where learning
school work at home is doubly hard.
And remember that Finland is more of a capitalist nation than the USA.
Singapore is more capitalist than the USA. Capitalism can be very good for
attaining high human capital achievements.
**How to Mislead With Statistics (distortions)
What did Bill Clinton do to earn $17.6 million from Laureate University over a
five year appointment?
A (WSJ) Journal editorial has a tale
of two for-profit colleges,
one that paid Bill Clinton $17.6 million and one that did not.
Guess which one was allowed to stay in business
Technical Institute shut down
Tuesday under government pressure while Laureate International Universities,
which retained
Mr. Clinton
as its “honorary chancellor,” lives on. The editorial board notes that the Obama
Administration’s College Scorecard shows
Laureate’s five U.S. campuses have graduation rates comparable to ITT’s, but
with higher student debt levels.
WSJ Newsletter on September 7, 2016
Jensen Comment
This illustrates how to mislead by cherry picking comparison items. Laureate is
among various for-profit universities that is surviving thus far, and ITT is
among among various for-profits that have or soon will go down the tube. To
cherry pick a loser after the fact to compare with one that is still viable is
absurd in the context of the above WSJ references.
A more important question to ask is what did
Bill Clinton bring to Laureate to justify hi $17.5 million compensation?
About all I can figure is that it was not his time or his expertise in education
leadership that justify such an enormous amount of compensation. What he brought
is his name that, for any living USA ex-President, lends some legitimacy to a
business, charity, or other organization --- especially on the international
scene. Among the living USA ex-Presidents Jimmy Carter's name and George Bush
Sr.'s name are probably the most reputable. George W. Bush would be a less
reputable name among liberals and progressives.
Bill Clinton's name is badly tarnished by his disbarment in Arkansas and a
USA Supreme Court practice plus the nearly $1 million in fines and settlements
---
http://www.snopes.com/bill-clinton-fined-and-disbarred-over-the-monica-lewinsky-scandal/
Bill Clinton's impeachment proceedings marred his reputation, and most of
all, in my viewpoint, the most damaging blots on his reputation were the
scandalous pardons he sold to criminals on his way out of the White House ---
https://en.wikipedia.org/wiki/Bill_Clinton_pardon_controversy
But on the international scene where Laureate International Universities
operate the name "President Bill Clinton" still lends legitimacy to an
organization, although I suspect the name Jimmy Carter is even more valuable.
Republicans might also conjecture that Bill Clinton's wife, as the USA Secretary
of State, was probably doing favors for Laureate but I'm inclined to doubt that
the favors, if any, were all that scandalous.
Would Bill Clinton have given his name to ITT
for $17.6 million?
We can only speculate on this. Certainly the illegal activities of ITT were
known to the Department of Education for years before they came to a head in
2016. If Bill Clinton asked the Department of Education probably would have
shared what they knew with him in confidence. My guess is he would have learned
ITT was a hot potato. Bill Clinton's admirers would certainly give him the
benefit of the doubt when speculating about acceptance or rejection of millions
from ITT. Bill Clinton's detractors would claim he'll do anything if the price
is right. But all of this is pure speculation, and we will never know.
In any case the WSJ references cited above are misleading.
**How to Mislead With Statistics (distortions)
Data Set 1 (2010-2017)
Business Insider: 50
Cities Americans Have Been Abandoning in the Last Decade (or more) ---
https://www.businessinsider.com/50-cities-americans-have-been-abandoning-in-the-last-decade-2018-9
When I forwarded Data Set 1 a former colleague rightly
chewed me out by pointing out that the rankings of cities with vastly differing
populations was a "garbage ranking." I agree and was then inspired to attempt to
find the USA Census data upon which Data Set 1 was based. I failed to find this
data, but I agree with my colleague that you cannot compare numbers of outgoing
migrants from NYC with outgoing migrants from Anchorage, Alaska.
In my search I did find Data Set 2 from the USA Census
Bureau in a table that seems to make the same garbage rankings (in a bigger
way).
How to Mislead With Statistics
Data Set 2
USA Census Bureau: Metropolitan Statistical Areas Sorted by Net Migration (Year
2000)
https://www.census.gov/population/www/cen2000/migration/metxmet/indexn.html
I think my colleague would contend that the rankings in
Data Set 2 should've been made on the basis of the last column in the table
rather than the second-to-last column. I agree entirely!
Furthermore the size of the numbers in Data Set 2 suggest
that there may be many more problems with the numbers in Data Set 1.
**How to Mislead With Statistics (distortions, missing variables)
The Atlantic: As younger generations become more racially diverse, many states
are allocating fewer tax dollars to public colleges and universities ---
https://www.theatlantic.com/politics/archive/2018/05/american-higher-education-hits-a-dangerous-milestone/559457/
Jensen Comment
The article misleadingly overlooks the major causes of reduced spending for
higher education.
Soaring Medicaid expenses have become the biggest expenditure items in most
state budgets, expenditures that cannot be as easily reduced as expenditures for
higher education. Couple Medicaid with underfunded pensions for state workers
and we see funding for higher education being left in political dust.
By way of illustration look at the Medi-Cal portion ($101.5 billion) of the
2018-19 pie chart for California at
http://www.ebudget.ca.gov/2018-19/pdf/BudgetSummary/HealthandHumanServices.pdf
For California the higher education budget for 2018-19 is proposed at $33.7
billion in comparison ---
http://www.ebudget.ca.gov/2018-19/pdf/BudgetSummary/HigherEducation.pdf
Click on "States" in the upper left corner to see states grading as to fiscal
responsibility and debt crises ---
https://www.statedatalab.org/
In other words the "radical diversity" issue is not so much a cause of
reduced support higher education as is a budgeting choice issue devoting the
lion's share of state budgets to health and welfare, especially Medicaid. And a
major cause of the increase in Medicaid spending is the way citizens are
figuring out how to divert long-term assisted living and nursing home expenses
to Medicaid. If families plan ahead more than five years in advance, they can
funnel more of their parents and grandparents resources into their own pockets
and shift the long-term nursing care expenses over to Medicaid. And then they
complain that the states are paying less for their children's state-supported
higher education.
Medicare and Medicaid were never intended by government to pay for so much
long-term nursing care of the middle class, but by one means or another schemes
have been devised to make long-term nursing care and the cost of dying for the
middle class as well as the poor. Medicaid is picking up a larger share of
long-term nursing costs and Medicare is picking up the cost of dying
(hospital, medication, and doctor bills).. The cost of
dying became the largest budget item in Medicare and is exploding as the
population of the USA ages. This is also the major cause, along with underfunded
pensions, of funds being diverted by states from
higher education to Medicaid.
The bottom line is that as the population ages we're seeing a
massive shift in state (and Federal) spending from
the young to the old as education money is
massively being diverted to Medicaid (and Medicare).
**How to Mislead With Statistics
NYT: What Straight-A Students Get Wrong ---
https://www.nytimes.com/2018/12/08/opinion/college-gpa-career-success.html
Jensen Comment
What this article fails to mention is that the University of Georgia or Ohio
State University might well trounce any of the Top 4 college playoff teams if
only Georgia or Ohio State had made it to the 2018 college playoffs ---
https://www.foxnews.com/sports/college-football-playoff-alabama-clemson-notre-dame-and-oklahoma-chosen-as-final-four-teams
My point here is that in Google, Apple, Microsoft, Goldman
Sachs, or Deloitte the fact that 4.0 gpa students don't on average have higher
performance ratings that 3.7 gpa employees fails to overlook the fact that most
graduates hired by are rarely anything but high gpa students relative to other
graduates in their colleges' programs. There may be some adjustment such as when
employers may except a slightly lower gpa applicant from a prestigious
university that has the highest admission standards in the worlld.
My point is that to be a high
performance winner you have to get in the game, and only the highest
gpa students are likely to get in the game unless there is some mitigating
circumstance such as having a perfect GRE score or being a 2.85 gpa biology
major admitted to medical school because of a perfect MCAT score.
The problem for employers and
graduate school admissions officers these days is grade inflation across the USA
where nearly all applicants have close to a 4.0 gpa. This is why
employers and recruiting officers look to other criteria such as excelling in
extra-curricular activities and volunteer work such as teaching English or math
in Africa for a couple of years.
Having said this I concede that in terms of job
performance there are many criteria (and don't rule out luck) that frequently
override gpa or test scores. There's anecdotal evidence that CPA Exam gold medal
winners sometimes bomb out on the job (especially those with zero
personalities). There anecdotal evidence that incoming applicants with perfect
GMAT scores do worse that low GMAT performers with high grade averages.
The above NYT article makes some good points,
but it fails if some students become less concerned with
grades because they took the article to heart.
Luck, courage, and motivation may beat out grades and
skill --- but only if you are in the game to have a chance at high performance.
Think of those glum Georgia and Ohio State varsity
football players watching the 2018 college playoffs on television.
**How to Mislead With Statistics (missing variables, distortions)
Engineers Are Leaving Trump’s America for the Canadian Dream ---
https://www.bloomberg.com/news/features/2018-04-20/h-1b-workers-are-leaving-trump-s-america-for-the-canadian-dream
Jensen Comment
The above article is not so misleading in terms of the subset it deals with
coming into Canada --- engineers from nations other than the USA.
What is misleading, however, is that it ignores Canadian engineers coming into
the USA. I don't know the immigration ratio is for engineers, but the total
immigration ratio of Candada/USA is roughly 5/1. Among these some are most
certainly STEM graduates who cam down from Canada for college in the USA and
then stay on in the USA. It is not at all clear that engineers are leaving
America for Canada in terms of net migration patterns. Employment opportunities
for engineers are greater in the USA. Those with Ph.D.s certainly have many more
USA colleges and universities to choose from if they want to enter the Academy.
April 22, 2018 reply from Jagdish
Bob,
The educational standards in India are not uniform.
The quality of education at most Indian Universities is horrible even by
American standards. However, the standards at the national institutes (such
as Indian Institutes of Technology, Indian Statistical Institute, Indian
Institutes of Management, Indian Institute of Science, Indian Agricultural
Research Institute, All India Institute of Medical Sciences,...) are world
class. However, the competition for admissions is brutal. Many of the
candidates applying there use Ivy leagues as safety schools (example: the
billionaire Narayana Murthy, the chairman of Infosys. His son used Cornell
as a safety school while applying to IITs. He did not get into any of the
eight or so then IITs, but got in easily to Cornell). In 2014, 1.3 million
students appeared for the IIT joint entrance examinations. Of them the top
150,000 scorers were considered for the second round advanced entrance
examination, but only 27,152 qualified to take the advanced entrance
examination. Of these, about 10,000 were admitted. When I applied for
admission into IIMC, the two IIMs had 200 seats for which about 15,000
applied. Of the 100 selected 24 were whisked away by American universities
with admissions and hefty scholarships. These numbers should indicate why
not many students from the US go there for studies.
Of late, many Indian immigrants here do send their
children for medical schools to India when they do not get into schools
here. And private medical schools do charge them hefty fees. One of my
nieces went there after a degree from Berkeley when she could not get into
any medical schools here. And I have heard of some white ethnic American
students going to study medicine in India. Some medical schools here also
have sister med schools in India. For example, Loma Linda University where
my late wife practiced and taught residents had such a relationship with a
medical school in India (at the same university where Microsoft CEO Satya
Nadel studied engineering).
The American students who do go to India to study
are usually in areas such as anthropology, Linguistics, Music, and
occasionally political science and history. When my sister was doing her
masters in solid state physics in the late 1960s her roommate was an
exchange student from the US who was a music and dance major.
On the other hand, the number of Americans who go
to India as expats has sky-rocketed. All major US corporations have large
offices and do send their US executives there for international exposure.
Also, many Indian companies actively recruit Americans, but those companies
are quite snooty; they usually recruit primarily from Ivy leagues and other
private schools such as Chicago and Stanford.
Regards,
Jagdish
*I watched the video of the ejection of a NFL player for punching a player on
the ground. It was easy to see that it was punch. What I found difficult when
watching the video is assessing the intensity of
the punch ---
https://www.businessinsider.com/chris-jones-chiefs-ejected-punching-jaguars-player-nfl-review-2018-10
**How to Mislead With Statistics (Distortions)
Approval ratings of USA's most recent presidents when compared to President
Trump's approval ratings ---
https://projects.fivethirtyeight.com/trump-approval-ratings/?ex_cid=rrpromo
The green line in each graph depicts President Trump's
favorable approval rating
Note that you can see the numbers by passing your mouse
pointer over the graph lines
Also note that these comparisons only cover the first 625
days of the presidencies and not the entire 4-8 year terms. Yeah I know
President Nixon's second term was cut short way early by his resignation.
Jensen Comment
Probably the most surprising was the high (albeit declining) approval ratings of
President George W. Bush versus the relatively low approval ratings of
Presidents Obama, Clinton, Reagan, Carter, Ford., and Truman. Of course "W"
benefited from the quick and decisive success of the Gulf War.
In some cases approval ratings were greatly impacted beyond the 625-day
cutoff in the above article, e.g., the late-term impacts sex scandal in
Clinton's Oval Office and the second term impacts of the Watergate Scandal that
hammered President Nixon. The approval ratings of LBJ later declined as he got
us more bogged down in the Viet Nam War.
The sex scandals of Trump, JFK, and LBJ did not seem to affect approval
ratings greatly, although LBJ's affairs were not as widely publicized as those
of JFK and Trump.
So what's misleading about these 625-day graphical comparisons?
Probably the most misleading is that these graphs do not show the
intensity of the like versus dislike. For example,
the intensity of the "hate" for President Trump is much greater than the
intensity of the dislike for President Ford even though their approval rating
graphs are not all that different in the above article. I think the intensity of
the "love" for Presidents Kennedy, Obama, and Reagan were much greater among
those that approved of them relative to the approvals of Presidents Trump,
George W. Bush, Nixon, and LBJ. And I suspect that the hate for President
Clinton, even before Monica, was much greater than the hate all the other
presidents that followed until President Trump came on the scene.
My point is that the degree if polarization in the
political climate is not reflected in the approval rating line graphs. I
don't know that we have any indicators of the intensity of love versus hate for
USA presidents. But there are most certainly feelings in the air.
I anticipate that the level of polarization will only increase as the debate
between capitalism versus socialism intensifies along with the debates over
nationalized health care, free college education, military spending, taxes, and
climate change spending/regulations.
What greatly impacted the polarization is the decline in media's code of
politeness. The media mostly ignored the sex life of President Eisenhower until
after he died. The tabloids revealed JFK's "passion" for Hollywood sex goddesses
while he was in office. The polite media like the NYT became obsessed with the
affairs of Bill Clinton and Donald Trump before that entered the White House.
After the Kavanaugh hearings we will now be probing the middle-school
questionable behavior of future political candidates. Only saints since before
puberty will be allowed to be President of the USA.
Philosophy: How should we judge people for their past moral failings?
https://theconversation.com/how-should-we-judge-people-for-their-past-moral-failings-103982
**How to Mislead With
Statistics (definitions, distortions)
Chicago's mayor declared Chicago is on the firmest financial footing in
years, but taxpayers should understand that the pitch is deeply misleading ---
http://www.chicagobusiness.com/opinion/how-emanuel-misleading-you-citys-debt
ursing Homes ---
https://en.wikipedia.org/wiki/Nursing_home_care
**How to Mislead With Statistics (distortions)
Median prices per month for nursing homes in all 50 states ---
https://www.businessinsider.com/nursing-home-private-room-monthly-median-price-by-state-2019-3#10-delaware-10950-per-month-1
Jensen Comment
Firstly I might note that Medicare does not pay for long-term nursing care
whereas Medicaid does pay for long-term nursing care, and this leads to a
scramble by heirs to drain off parent or grandparent assets five or more years
before those older folks come into need of long-term care. However, Medicaid
caps of monthly care result in most of those "poverty" cases to be put in
low-standard nursing facilities well below the median prices in each state. Also
it's a crap shoot predicting if and when those folks will need long-term care.
Long-term care insurance has always been expensive and is often limited in
terms of what it will pay per month. To add pain to misery the premiums almost
doubled recently because insurance companies were losing so much money on
long-term care insurance do to such factors as exploding prices of nursing homes
and increased demand for nursing home care relative to supply --- due mostly to
the bubble of aging baby boomers ---
https://en.wikipedia.org/wiki/Baby_boomers
One of the things greatly increasing the new Democratic bill for
Medicare-for-All to over $30 trillion is that it proposes adding extremely
expensive long-term care coverage to everybody in the USA (including millions of
undocumented immigrants) ---
https://www.politico.com/story/2019/02/26/house-democrats-medicare-for-all-1189139
Now what's so misleading about the median prices reported by state?
https://www.businessinsider.com/nursing-home-private-room-monthly-median-price-by-state-2019-3#10-delaware-10950-per-month-1
Firstly, averages (whether mean or median) should be accompanied by
variance and skewness distribution information. Skewness at the low end for
cheap and substandard nursing homes in particular brings down those averages
such that heirs wanting better care for their elders can expect to pay much more
than the medians reported in this study.
Prices can also vary greatly in terms of services provided. My granddaughter
is a licensed pharmacist for a nursing center in Bangor, Maine. Many nursing
homes cannot afford pharmacists, expensive therapists, and expensive
recreational facilities. The quality of available physicians also varies a great
deal such when a nursing home in the boondocks is very far away from physicians.
I suspect this is one of the factors that greatly increases the cost of nursing
care in Alaska where, I suspect, that there's a shortage of physicians in most
of the state.
Most nursing homes also offer a menu alternative services that vary with
varying patient needs. This distorts medians reported in the above study ---
https://capitalretention.com/jimmy-buffett-long-term-care/
Insurance considerations ---
https://www.usatoday.com/story/money/2019/03/04/nursing-home-cost-care-makes-planning-ahead-important/3004694002/
**How to Mislead With Statistics: When "sexual assault" becomes mere
"assault" (Distortions, Definitions)
German Police Lie About Migrant Crime Statistics
“To Preserve Civil Peace” ----
https://gatesofvienna.net/2019/02/german-police-lie-about-migrant-crime-statistics-to-preserve-civil-peace/
. . .
from what I have understood, the police chief will
make a written note on the report which says: “Please review this.”
This is a signal to alert the police officer who
wrote the report to remove certain terms which are provocative and could
have a negative influence on the statistics.
In these statistics you will find the term
assault instead of sexual assault, without any further specification.
This means the statistical accumulations are
differently weighted and presented differently as what the clear insights in
detail would reveal.
Germany: Muslim migrant accused of gang rape with 10 others will be
tried in juvenile court; he’s 22 ---
http://www.freerepublic.com/focus/f-news/3730147/posts
**How to Mislead With Statistics
"U.K. Report Is Latest Evidence That Crime Stats Heavily Undercount
Rape," by Carl Bialik, Nate Silver's 5:38 Blog, November 18, 2014 ---
http://fivethirtyeight.com/datalab/u-k-report-is-latest-evidence-that-crime-stats-heavily-undercount-rape/
. . .
A similar problem has occurred in the United
States. Far more than a quarter of rapes reported to New Orleans police
weren’t followed up on, according to a
report released last week by the city’s inspector
general. The office randomly audited five sex-crimes detectives’ cases; it
found the detectives designated 65 percent of reports of sex crimes as
“miscellaneous,” rather than as sexual assaults, and followed up with
supplemental reports on just 14 percent of calls.
Continued in article
"In Torrent of Rapes in Britain, an Uncomfortable Focus on Race and
Ethnicity," by Katrin Bennhol, The New York Times, November 1, 2014
---
http://www.nytimes.com/2014/11/02/world/in-torrent-of-rapes-in-britain-an-uncomfortable-focus-on-race-and-ethnicity.html
"Norway Says Enough, Deports Record Numbers of Immigrants to Reduce Crime,"
Alipac, November 18, 2014
http://www.alipac.us/f12/norway-says-enough-deports-record-numbers-immigrants-reduce-crime-314610/
The Norwegian paper
The Local reported in September that asylum
seekers and illegal immigrants (euphemistically called "persons living in
Norway without papers") are over-represented in the country's crime
statistics:
Continued in article
Jensen Comment
Such deportations don't do much good in the USA. Persons that "were living in
the USA without papers" return in a matter weeks.
**How to Mislead With Statistics (distortions)
Bogus Straw Stats Popped Up in October 7, 2018 Shark Tank ---
http://reason.com/blog/2018/10/08/bogus-straw-stats-pop-up-in-last-nights
**How to Mislead With Statistics
PBS Nova: How did the polls get it so wrong?
http://www.pbs.org/wgbh/nova/next/body/why-did-the-polls-get-it-wrong/
Forbes: The Science Of Error: How Polling Botched The
2016 Election ---
https://www.forbes.com/sites/startswithabang/2016/11/09/the-science-of-error-how-polling-botched-the-2016-election/#6deb3b337959
Scientific American: Where Are the Real Errors in
Political Polls?
https://blogs.scientificamerican.com/guest-blog/where-are-the-real-errors-in-political-polls/
Examples of misleading statistics and polls ---
https://www.datapine.com/blog/misleading-statistics-and-data/
NYT: Affirmative Action Is an Example of How Polls Can
Mislead
https://www.nytimes.com/2017/08/04/upshot/affirmative-action-and-why-polls-on-issues-are-often-misleading.html
Misleading Charts
---
https://qz.com/580859/the-most-misleading-charts-of-2015-fixed/
The Top 10 Ways to Get Misleading Poll Results (many times these are
intentional mistakes for political purposes) ---
http://www.charneyresearch.com/resources/the-top-10-ways-to-get-misleading-poll-results/
Fake Polls are the Real Problem ---
https://fivethirtyeight.com/features/fake-polls-are-a-real-problem/
Supreme Court of the United States ---
https://en.wikipedia.org/wiki/Supreme_Court_of_the_United_States
**How to Mislead With Statistics (distortions and intensity issues)
Approval ratings of USA's most recent presidents when compared to President
Trump's approval ratings (March 3, 2019) ---
https://projects.fivethirtyeight.com/trump-approval-ratings/?ex_cid=rrpromo
The green line in each graph depicts President Trump's
favorable approval rating
Note that you can see the numbers by passing your mouse
pointer over the graph lines
Also note that these comparisons only cover the first 625
days of the presidencies and not the entire 4-8 year terms. Yeah I know
President Nixon's second term was cut short way early by his resignation.
Jensen Comment
Probably the most surprising was the high (albeit declining) approval ratings of
President George W. Bush versus the relatively low approval ratings of
Presidents Obama, Clinton, Reagan, Carter, Ford., and Truman. Of course "W"
benefited from the quick and decisive success of the Gulf War.
In some cases approval ratings were greatly impacted beyond the 625-day
cutoff in the above article, e.g., the late-term impacts sex scandal in
Clinton's Oval Office and the second term impacts of the Watergate Scandal that
hammered President Nixon. The approval ratings of LBJ later declined as he got
us more bogged down in the Viet Nam War.
The sex scandals of Trump, JFK, and LBJ did not seem to affect approval
ratings greatly, although LBJ's affairs were not as widely publicized as those
of JFK and Trump.
So what's misleading about these 625-day graphical comparisons?
Probably the most misleading is that these graphs do not show the
intensity of the like versus dislike. For example,
the intensity of the "hate" for President Trump is much greater than the
intensity of the dislike for President Ford even though their approval rating
graphs are not all that different in the above article. I think the intensity of
the "love" for Presidents Kennedy, Obama, and Reagan were much greater among
those that approved of them relative to the approvals of Presidents Trump,
George W. Bush, Nixon, and LBJ. And I suspect that the hate for President
Clinton, even before Monica, was much greater than the hate all the other
presidents that followed until President Trump came on the scene.
My point is that the degree if polarization in the
political climate is not reflected in the approval rating line graphs. I
don't know that we have any indicators of the intensity of love versus hate for
USA presidents. But there are most certainly feelings in the air.
I anticipate that the level of polarization will only increase
as the debate between capitalism versus socialism intensifies along with the
debates over nationalized health care, free college education, military
spending, taxes, and climate change spending/regulations.
What greatly impacted the polarization is the decline in
media's code of politeness. The media mostly ignored the sex life of President
Eisenhower until after he died. The tabloids revealed JFK's "passion" for
Hollywood sex goddesses while he was in office. The polite media like the NYT
became obsessed with the affairs of Bill Clinton and Donald Trump before that
entered the White House.
After the Kavanaugh hearings we will now be probing the
middle-school questionable behavior of future political candidates. Only saints
since before puberty will be allowed to be President of the USA.
Philosophy: How should we judge people for their past moral failings?
https://theconversation.com/how-should-we-judge-people-for-their-past-moral-failings-103982
Time Magazine: Approval Ratings for Donald Trump are Higher Than You
Think ---
Click Here
Machines will soon outwork humanity ---
http://reports.weforum.org/future-of-jobs-2018/
Humanity performs about 71% of the work in 2018. By 2015 that will drop to 50%
and not stop dropping in the foreseeable future.
I can't recall the science fiction movie from years ago in which humans are
fatted up in pasture-like settings and used only for food for monsters that rule
the machines. That's science fiction, but it's going to be
a serious issue concerning what to do with "humanity" once humanity is no longer
needed for work.
**How to Mislead With Statistics (distortions)
A World With Fewer Babies Spells Economic Trouble ---
https://www.bloomberg.com/news/articles/2018-09-14/humans-having-fewer-babies-is-a-big-economic-problem-quicktake
. . .
The
United Nations calculated the world’s population as of 2017 at
7.6 billion people,
a number it projects will grow to 11.2 billion at the end of this century,
after which it could begin to fall. But a lot of countries are going to
shrink
before then. With a fertility rate of only 1.6, China’s population will drop
28 percent by 2100, ceding the title of world’s most-populous nation to
India, the UN predicts. With a fertility rate of 1.4, Japan’s population
will plunge 34 percent by 2100. The U.S.’s headcount is expected to keep
growing, despite a low fertility rate of 1.8, because of large numbers of
immigrants,
though government policies could change that.
Continued in article
Jensen Comment
It's unbelievable that Bloomberg published such a misleading article that the
encourages increased birth rates at a time when climate change impacts on food
and water shortages are so dire for the next few decades while we await dramatic
and technologies to feed and water the existing world populace. The problem is
just not climate change. Before climate change was on everybody's mind
agricultural aquifers (think Nebraska and Oklahoma) were drying up from over
use.
It's unbelievable that Bloomberg would publish such a
misleading article when it's known that robotics and artificial intelligence
advances threaten so many labor markets, especially the unskilled labor markets
and even quite a few of the skilled labor markets where robots are even doing
complicated surgeries these days. Sure the birth rate in Japan is down, but a
high tech nation like Japan could lead the way in robotics and artificial
intelligence.
It's like Bloomberg merely wanted to paint a gloomy
picture of declining birthrates in some industrial nations while overlooking the
enormous problem of the ever-onward growth in world population amidst growing
resource shortages to meet that steady growth in global population. And we
really cannot rely on that growth leveling out in Year 2100 so far ahead in
time. The Mad Max era may have come and gone by then ---
https://en.wikipedia.org/wiki/Mad_Max
It's certain that there will be ever- increasing numbers
of immigrants in the USA and Europe because nothing,
certainly not walls, will stem the flow of undocumented immigration thru all
borders while health care, education, and higher incomes in the USA and Europe
serve as magnets for the sick and the poor.
**How to Mislead With Statistics: When "sexual assault" becomes mere
"assault" (Distortions, Definitions)
German Police Lie About Migrant Crime Statistics
“To Preserve Civil Peace” ----
https://gatesofvienna.net/2019/02/german-police-lie-about-migrant-crime-statistics-to-preserve-civil-peace/
. . .
from what I have understood, the police chief will
make a written note on the report which says: “Please review this.”
This is a signal to alert the police officer who
wrote the report to remove certain terms which are provocative and could
have a negative influence on the statistics.
In these statistics you will find the term
assault instead of sexual assault, without any further specification.
This means the statistical accumulations are
differently weighted and presented differently as what the clear insights in
detail would reveal.
Germany: Muslim migrant accused of gang rape with 10 others will be
tried in juvenile court; he’s 22 ---
http://www.freerepublic.com/focus/f-news/3730147/posts
**How to
Mislead With Statistics (Distortions)
Compensation Watch ’19: Internal Auditors ---
https://goingconcern.com/compensation-watch-19-internal-auditors/
Jensen
Comment
Salary studies like this mislead due averaging (Means or medians) across many
things, including company size, office location, public versus private sector,
fringe benefits (especially retirement plans), opportunities for growth,
technical expertice, and on and on and on. One can hardly compare the salary of
an internal auditor on Wall Street working for a huge investment bank with an
internal auditor working for a small agricultural products company in Ames,
Iowa. One can hardly compare an internal auditor trained primarily in
traditional accounting with an internal auditor highly proficient in blockchain
and artificial intelligence.
Averages, especially means, are misleading if standard deviations and skewness
(kurtosis) are not revealed. When Bill Gates walks onto a college campus
everybody on campus at that time becomes a millionaire.
**How to mislead with statistics
There Are 79 Jobs With Six Figure Salaries ----
https://247wallst.com/special-report/2019/08/06/there-are-79-jobs-with-six-figure-salaries-2/9/
Jensen Comment
This is among the most misleading rankings I've ever seen.
Firstly, many of the professionals included in the rankings don't have "jobs"
that pay salaries. They are business owners who rely on profits rather than
salaries. Thinks of surgeons who have their own offices, nurses, physician
assistants, receptionists, accountants, etc. They have many expenses, especially
malpractice insurance policies and claims pay out.
Secondly, many have profit sharing and bonus plans that are almost impossible
to predict above and beyond salaries included in this study.
Thirdly, these are averages with enormous standard deviations and skewed
distributions. For example, college professor salaries and physician assistant
salaries are truncated much lower than salaries of lawyers and brain surgeons.
Fourthly, the jobs vary greatly in terms of benefits. College presidents for
example get free housing, huge expense allowances, cars, etc.
Fifthly, salaries are cover varying parts of the year. Professors, for
example, are included in this study at their nine-month base. Those same
professors get added salaries for summer teaching, research, book royalties,
consulting, patent royalties, etc.
Sixthly, some jobs are conducive to added compensation, particularly outside
consulting, book writing, speeches, musical performances, etc.
The bottom line is that these rankings are mostly garbage and very misleading
for career aspirants.
**How to Mislead With Statistics
The No. 1 job in America with the ‘best career opportunities’ pays
$112,000 a year — and it’s not in tech ---
https://www.marketwatch.com/story/the-no-1-job-in-america-with-the-best-career-opportunities-pays-112000-a-year-and-its-not-in-tech-2019-08-14?mod=article_inline
Jensen Comment
There's a lot that can be deceiving in this article. Firstly, being a tax
manager is not an entrylevel job. The left tail is probably truncated at at
least $100,000 which distorts the mean. More importantly, most tax managers make
a lot more than their base salaries with bonus plans and profit sharing that can
easily double or triple the base salary. Hence, there's a lot of missing data in
the study. It would not be uncommon for the base salary of the tax manager to be
less than that of some of the tech specialists who report to her or him. But
they most likely do not share as heavily in the bonuses and profit sharing
compensations.
The job is sometimes filled with IRS senior agents who are very experienced
with IRS tax accounting and tax planning.
The job is also a stepping stone to becoming a Chief Financial Officer or a
Chief Accounting Officer.
But I do not think that on "average" the compensation of a tax manager is
nearly as high as that of a top surgeon and some other types of physicians. But
surgeons most often are not employees. They are entrepreneurships or
partnerships and receive compensation in the form of business profits after
expenses. The biggest problem when comparing careers according to compensation
is that databases like those of the Department of Labor really don't have
provide data on every aspect of compensation.
**How to Mislead With Statistics (distortions, correlation)
American Life Expectancy vs. Europe: It's Not About "Socialized Medicine" ----
https://mises.org/wire/american-life-expectancy-vs-europe-its-not-about-socialized-medicine?utm_source=Mises+Institute+Subscriptions&utm_campaign=ecd0810c45-EMAIL_CAMPAIGN_9_21_2018_9_59_COPY_01&utm_medium=email&utm_term=0_8b52b2e1c0-ecd0810c45-228708937
Everything You Know About Obesity Is Wrong ---
https://highline.huffingtonpost.com/articles/en/everything-you-know-about-obesity-is-wrong/
**How to mislead with statistics
There Are 79 Jobs With Six Figure Salaries ----
https://247wallst.com/special-report/2019/08/06/there-are-79-jobs-with-six-figure-salaries-2/9/
Jensen Comment
This is among the most misleading rankings I've ever seen.
Firstly, many of the professionals included in the rankings don't have "jobs"
that pay salaries. They are business owners who rely on profits rather than
salaries. Thinks of surgeons who have their own offices, nurses, physician
assistants, receptionists, accountants, etc. They have many expenses, especially
malpractice insurance policies and claims pay out.
Secondly, many have profit sharing and bonus plans that are almost impossible
to predict above and beyond salaries included in this study.
Thirdly, these are averages with enormous standard deviations and skewed
distributions. For example, college professor salaries and physician assistant
salaries are truncated much lower than salaries of lawyers and brain surgeons.
Fourthly, the jobs vary greatly in terms of benefits. College presidents for
example get free housing, huge expense allowances, cars, etc.
Fifthly, salaries are cover varying parts of the year. Professors, for
example, are included in this study at their nine-month base. Those same
professors get added salaries for summer teaching, research, book royalties,
consulting, patent royalties, etc.
Sixthly, some jobs are conducive to added compensation, particularly outside
consulting, book writing, speeches, musical performances, etc.
The bottom line is that these rankings are mostly garbage and very misleading
for career aspirants.
*
*How to Mislead With Statistics
(Definitions, Distortions)
How Much Accountants And Tax Preparers Earn In Every State --
https://taxprof.typepad.com/taxprof_blog/2019/02/how-much-accountants-and-tax-preparers-earn-in-every-state.html
Jensen Comment
I could make my usual criticisms such as cost of living differences and state
taxation differences that overwhelm the supposed earning differences by state.
I could also criticize the BLS mean statistics as not being accompanied with
data on variances and skewness.
Averages get distorted by wages of newly-hired college graduates mixed in with
employees having years of experience.
In tax season a whole lot of overtime gets paid to accountants who are tax
preparers where not so much overtime gets paid to accountants who don't work in
tax.
But mostly I will focus on the vagueness of what is a "an accountant and tax
preparer." Some are entrepreneurs and partnerships (including LLC corporations),
those equity owners of accounting firms. And accounting firms vary in size
from no employees to thousands of employees. And those firms most likely mix
revenues from tax preparation to systems consulting to auditing to whatever. It
would be misleading merge what partners make with the salaries they pay their
employee "accountants and tax preparers." And those salaries paid to employees
probably have a lot of benefits not picked up in the BLS data such as profit
sharing and bonuses and fringe benefits such as expensive training and day care
subsidies.
My basic point is
that "owners" of accounting firms are still doing a lot of the accounting,
auditing, consulting, and tax work alongside their employees. Public accounting
(and law) firms are not like NFL teams where owners are in the luxury
boxes and not getting knocked around on the playing fields. What is paid to an
employee in "salary" is typically only paid for the first 5-10 years until
employees either become part owners of the firm or are moved out of public
accounting into business firms or government (think FBI).
You just cannot compare what public accountants make in "salaries" with what
accountants make in business firms and government where accountants spend their
entire careers living on "salaries."
Most
public accountants are only on "salaries" for the first 5-10 years of their
careers.
After that they're working
owners
and no longer "public accountants working for owners."
And now we get to the most important reason the salaries
in the above article are so low. The problem is definitional. CPAs having
masters degrees are mixed in with "accountants and tax preparers" who might've
never graduated from high school. The non-CPAs' low
salaries drag down the BLS mean averages. Most candidates for the CPA
exam have masters degrees since they have to have 150 or more college credits to
even sit for the CPA exam.
**How to Mislead With Statistics (Distortions, Denominator Effects)
Measuring human capital: a systematic analysis of 195 countries and
territories, 1990–2016
https://www.thelancet.com/action/showPdf?pii=S0140-6736%2818%2931941-X
Jensen Comment
Firstly, rankings can be easily distorted by denominator effects that compare
highly populated and diverse nations with small nations. It's like comparing
rates of growth of infants (who double their weight and height in few years)
with teenagers )that rarely double their weight and height). Also racial and
ethnic homogeneity coupled with small size account for a lot of Nordic country
attainment in human capital. Hundreds of thousands of unhealthy and poorly
educated immigrants are not pouring into Finland each year.
This study ignores the leading reasons why scholars from around the world are
seeking to go to graduate school (including medical school) in the USA relative
to Nordic countries, Singapore, and South Korea.
The study above is good for analyzing rates of improvement in human capital
of nations. But it's also misleading in terms of identifying nations favored by
immigrants if they're given a choice to live anywhere in the world. In spite of
its limitations the USA is still a great land of opportunity that does not show
up in the above rankings of nations. Of course that does not mean that our
public education system is serving the majority as well as Finland. It does not
mean that our health care system is serving the majority as well as Finland. But
Finland does not face the enormous problems that the USA faces in serving its
majority.
And yes Finland provides free college education. But it does so only for the
top third of its people. The other two thirds are not allowed into college ---
as is the case for virtually all European nations. And most of the training in
Finland for skills in the trades is provided by private sector companies rather
than taxpayers.
It's very easy to be mislead when comparing human capital betterments in
Finland with the USA. For example Finland's K-12 education system does very well
because of learning that nearly all children get in two-parent homes.
Finland does not have the high proportion of single-parent homes where learning
school work at home is doubly hard.
And remember that Finland is more of a capitalist nation than the USA.
Singapore is more capitalist than the USA. Capitalism can be very good for
attaining high human capital achievements.
**How to Mislead With Statistics (distortions)
Tesla owners are more satisfied than any other auto brand's, according to
Consumer Reports ---
https://www.businessinsider.com/tesla-tops-consumer-reports-owner-satisfaction-list-2019-2
I might also point out that the Chevy Bolt electric car also came out in the Top
10
Jensen Comment
This is what I call "satisfaction" being conditioned on unmentioned supplements.
Nearly every owner of a Tesla or Bolt has a supplement of a second gas-guzzling
vehicle (think SUV or pick up truck). What would be more interesting to me is if
Consumer Reports asked two-car owners which car they would give up if they were
only allowed to keep only one of their two cars. My guess is that the most
satisfying single car owner might be one with a hybrid rather than severely
range-limited Teslas or
Bolts.
Alternately the survey question might be if two-car owners would be as happy
with two electric cars as with one electric
car and one conventional vehicle.
My point is that Tesla owners are conditionally satisfied as long as they have a
convenient supplemental vehicle option for driving 300+ miles without having to
spend so much time recharging batteries on longer trips.
Also sample selection is quite biased in this survey.
Roughly half the Tesla USA buyers live in sunny California with most
of those buyers living in or near larger California cities where there are
convenient Tesla recharging stations and service centers. We can't extrapolate
their wonderful experiences with electric cars to Great Falls, Montana owners
facing -30F frigid days of batteries working poorly and no Tesla recharging
center or service center.
Tesla shares fall after Consumer Reports says it will no longer recommend
Model 3 (due to reliability issues) ---
https://www.cnbc.com/2019/02/21/tesla-tanks-subaru-soars-in-consumer-reports-new-reliability-survey.html
**How to Mislead With
Statistics
Here are the average
retirement savings by age: Is it enough? ---
https://www.marketwatch.com/story/here-are-the-average-retirement-savings-by-age-is-it-enough-2020-11-16?mod=home-page
Jensen Comment
The first thing to do is have your students explain the wide disparity of means
and medians in this data.
Next have students how outliers
can distort statistical inference.
**How to Mislead a Little Less With Statistics --- those
Black Swans
October 16, 2016 Prior to the 2016 November Trump Win
Election Update: Why Our Model Is More Bullish Than
Others On Trump ---
https://fivethirtyeight.com/features/election-update-why-our-model-is-more-bullish-than-others-on-trump/
Nate Silver also predicted a Clinton victory but with a little less gusto
than the rest of the media
Jensen Comment
In particular note Assumption 3 regarding "Fat Tails" (known as Black Swans in
financial forecasting)
Black Swans ---
https://en.wikipedia.org/wiki/The_Black_Swan:_The_Impact_of_the_Highly_Improbable
**How to Mislead With Statistics (Distortions, Definitions)
Tesla’s Model 3 Is Becoming One of America’s Best-Selling Sedans ---
https://www.bloomberg.com/news/articles/2018-10-03/tesla-s-model-3-is-becoming-one-of-america-s-best-selling-sedans
Jensen Comment
This article makes you think Tesla and maybe other electric cars are moving up
to top selling automobiles in America in 2018. First note that the graph is for
only sedan sales in one quarter. And look again at
what statisticians call the abscissa on the graph. That's right. These are
quarterly sales numbers in the thousands while vehicle sales in the USA for the
same quarter are in the millions. It's estimated that by
2020 sales of all sedans will be less than 10% of total automotive sales
---
https://www.bloomberg.com/news/articles/2018-10-03/tesla-s-model-3-is-becoming-one-of-america-s-best-selling-sedans
In 2017 total electric vehicle sales amounted to less than 200,000 electric
vehicles ---
https://arstechnica.com/cars/2018/01/2017-was-the-best-year-ever-for-electric-vehicle-sales-in-the-us/
Divide that by 17.25 million total vehicle sales in 2017 in the USA alone
https://www.automobilemag.com/news/u-s-auto-sales-totaled-17-25-million-calendar-2017/
Electric vehicle sales rates are climbing really fast, but there are many
reasons why the electric car market is in its infancy. Huge advances in range
and battery technology are needed for the electric market to grow up. At the
moment in the USA electric vehicles are mostly purchased by high income families
that also can afford one or more gas guzzlers. Hydrogen fuel cell vehicles may
possibly beat out battery powered cars.
Tesla is becoming a popular sedan in the USA but sedans are a dying breed
that Ford dropped completely from its product line. Other large-scale vehicle
manufacturers will soon follow Ford's lead in cutting back on unpopular sedans.
USA buyers want SUVs and pickup trucks.
**How to mislead with statistics (distortions, missing variables) ---
The median cost of a private nursing home room has reached $100,375 per year,---
https://www.cnbc.com/2018/10/19/this-retirement-expense-has-hit-100000-annually-and-its-continuing-to-rise.html
Actuarial models of long-term care insurance providers greatly underestimated
the rapid rise in costs and recently had to more than double the monthly rates
for such insurance. The "median cost" of $100,375 is misleading in that this
cost has a wide overall variance and a median that differs substantially between
the 50 USA states. In fairness the article touches on this point slightly (such
as pointing the high cost of nursing homes in Alaska). There's also extreme
variability in terms of quality of care. This, in part, is due to the high
worker turnover in nursing homes and the tendency for many to hire unskilled
workers at minimum wage. My point is that comparing nursing homes is a lot like
comparing sweet cherries with sour lemons.
Sadly, parents that made the most sacrifices for their adult
children often are the least-supported in their own times of needs years later.
The good news is that with professional guidance more than five
years in advance, heirs can legally confiscate Grandma's estate so that she's
eligible later on for Medicaid-provided long-term nursing care. The bad news is
that the quality of many nursing homes that accept Medicaid patients is often
the worst in the USA. Maybe we should be more like the Germans who sometimes
ship their gaga grandmas and grandpas to to relatively good lower-priced nursing
homes in Poland.
Nursing Home and
Hospital Elderly-Care Fraud
Elderly residents given intensive therapy in the last weeks of life jumped 65
percent, a study shows, raising questions about financial incentives. ---
https://www.bloomberg.com/news/articles/2018-10-09/nursing-homes-are-pushing-the-dying-into-pricey-rehab?cmpid=BBD100918_BIZ&utm_medium=email&utm_source=newsletter&utm_term=181009&utm_campaign=bloombergdaily
Bob Jensen's threads on health care
http://faculty.trinity.edu/rjensen/Health.htm
**How to Mislead With Statistics (distortions, definitions)
Why the US needs better crime reporting statistics ---
https://theconversation.com/why-the-us-needs-better-crime-reporting-statistics-104731
Okay, makes sense. But here’s the catch: None of
these crimes are weighted. When a “beautiful, innocent 9-year-old child who
was laying on the bed doing her homework” is murdered in Ferguson as a
retaliation killing, it counts just the same as when an individual is
arrested for shoplifting US$50 or more from the Dollar Store. This flawed
metric allows for incredible confusion.
**How to Mislead With Statistics (distortions, missing variables)
Yahoo Finance MAP: The most and least tax-friendly states ---
https://finance.yahoo.com/news/map-least-tax-friendly-states-144250362.html
Jensen Comment
It's somewhat misleading compare states by aggregating their taxes. The main
problem is all the variations in tax breaks and exclusions. Sales taxes are not
equal in terms of products that have exemptions and states that have sales tax
holidays. California has the infamous Proposition 13 on property taxes, but
other states have somewhat similar, albeit more limited, exclusions. For
example, Bexar County (think San Antonio) gives seniors a limited property tax
break on school district taxes. New Hampshire has no general income tax but has
a sneaky tax on cash dividends and interest (that are not not part of retirement
plans) after a $5,000 exemption. New York has a 10-year income tax exemption for
executives whose companies partner with universities in research.
**How
to Mislead With Statistics (distortions)
P-value
---
https://en.wikipedia.org/wiki/P-value
**How to Mislead With Statistics (big deal, distortions)
P-values can be misleading when hypotheses are
incorrect
February 6, 2019 Message from Tom Dyckman (now retired from Cornell
University)
Bob:
Here is a new paper you might want to alert your readers too along with
Dave's blog today.
Greenland, S., S. J. Senn, K. R. Rothman, J. B.
Carlin, C. Poole, S. N. Goodman, & D. G. Altman,
2016. Statistical tests, p values, confidence intervals, and power: A guide
to misinterpretations. European Journal of Epidemiology, 31,
337-350.
https://fermatslibrary.com/s/statistical-tests-p-values-confidence-intervals-and-power-a-guide-to-misinterpretations
Abstract
Misinterpretation and abuse of statistical tests, confidence intervals,
and statistical power have been decried for decades, yet remain rampant.
A key problem is that there are no interpretations of these concepts
that are at once simple, intuitive, correct, and foolproof. Instead,
correct use and interpretation of these statistics requires an attention
to detail which seems to tax the patience of working scientists. This
high cognitive demand has led to an epidemic of shortcut definitions and
interpretations that are simply wrong, sometimes disastrously so—and yet
these misinterpretations dominate much of the scientific literature. In
light of this problem, we provide definitions and a discussion of basic
statistics that are more general and critical than typically found in
traditional introductory expositions. Our goal is to provide a resource
for instructors, researchers, and consumers of statistics whose
knowledge of statistical theory and technique may be limited but who
wish to avoid and spot misinterpretations. We emphasize how violation of
often unstated analysis protocols (such as selecting analyses for
presentation based
on the
P values
they produce) can lead to small P values even if the declared test
hypothesis is correct, and can lead to large P values even if that
hypothesis is incorrect. We then provide an explanatory list of 25
misinterpretations of P values, confidence intervals, and power. We
conclude with guidelines for improving statistical interpretation and
reporting.
Continued in article
**How to Mislead With P-Values
How Many Ways Can You Misinterpret p-Values, Confidence Intervals,
Statistical Tests, and Power? 25
https://replicationnetwork.com/2019/02/09/how-many-ways-can-you-misinterpret-p-values-confidence-intervals-statistical-tests-and-power-25/
Jensen Comment
The sad thing is that journal editors of leading accounting research journals
seem to not care --- they're addicted to P-values
**How to Mislead With Statistics (definitions and dumb expectations)
From the CFO Journal on October 18, 2018
New York taxpayers
sent about
$24 billion more to the U.S. government
last
year than the state got back in federal spending, Comptroller Thomas
DiNapoli reported Wednesday, according to Bloomberg.
Jensen Comment
What if all states expected to get at least the same amount back in federal
spending as they paid into the USA treasury? Who would pay for the USA military
and the gazillions more spent at the national level that only indirectly benefit
individual states?
What a dumb expectation!
**How to Mislead With Statistics (distortions)
Why a 70% Top Tax Rate Will Miss Its Mark ---
http://knowledge.wharton.upenn.edu/article/marginal-tax/
What's missing here are all the loopholes that make it possible to avoid the
top marginal tax rate.
When Top Rates Were So High: Do you really
think Bing Crosby and Bob Hope paid 90 percent of their income to the taxman?
https://www.bloomberg.com/opinion/articles/2019-01-29/hollywood-stars-didn-t-pay-90-percent-tax-they-created-loopholes
**How to Mislead with Statistics (distortions)
Muller: Law School Ruin Porn Hits USA Today
https://taxprof.typepad.com/taxprof_blog/2019/02/muller-law-school-ruin-porn-hits-usa-today.html
Jensen Comment
The basic complaint here is treating outliers like a norm.
This does not mean that outliers are not important --- think Black Swans in the
investment world ---
https://en.wikipedia.org/wiki/Black_swan_theory
But treating outliers like the norm is very misleading. The media these days is
prone to this such as when a student or faculty member posts a sexist or
racist message on the social media the entire university gets a black eye
How to Mislead With Statistics
Nate Silver thinks the polls weren't all that bad --- Yeah Right
https://fivethirtyeight.com/features/politics-podcast-why-polls-were-off-in-2020-and-why-they-werent-that-bad/
NY Times: A Black Eye’: Why Political Polling Missed the Mark. Again
---
https://www.nytimes.com/2020/11/12/us/politics/election-polls-trump-biden.html
Senator Susan Collins did
not lead in a single publicly
released poll during the final four months of her re-election campaign in
Maine. But Ms. Collins, a Republican, won the election comfortably.
Senator Thom Tillis, a North Carolina Republican, trailed in
almost every poll conducted in his race.
He won, too.
And most polls underestimated President Trump’s
strength, in Iowa, Florida, Michigan, Texas, Wisconsin and elsewhere. Instead of
winning a landslide, as the polls suggested, Joseph R. Biden Jr. beat Mr. Trump
by less than two percentage points in the states that decided the election.
For the second straight presidential election, the
polling industry missed the mark. The miss was not as blatant as in 2016,
when polls suggested Mr. Trump would lose, nor was the miss as large as it
appeared it might be on election night. Once all the votes are counted, the
polls will have correctly pointed to
the winner of the presidential campaign in 48
states — all but Florida and North
Carolina — and correctly signaled that Mr. Biden would win.
But this year’s problems are still alarming,
both to people inside the industry and to the millions of Americans who
follow presidential polls with a passion once reserved for stock prices,
sports scores and lottery numbers. The misses are especially vexing because
pollsters spent much of the last four years trying to fix the central
problem of 2016 — the underestimation of the Republican vote in multiple
states — and they failed.
Continued in article
. Or
when an undocumented immigrant commits murder or rape this means all
undocumented immigrants are criminally inclined.
**How to
Mislead With Statistics
(distortions, Missing variables)
It's undoubtedly a blue-state bastion. But far from being a socialist hellhole,
the Golden State is thriving after years of malaise ---
https://www.politico.com/magazine/story/2019/02/21/trump-california-attacks-economy-225191
Jensen
Comment
Politico is a popular liberal site that's very biased. It's not a fake news site, but
it does heavily cherry pick for liberal views and leaves out conservative
counterpoints. A good example is the above Politico site. Except for housing
costs it brings out the many positives of California and leaves out the
negatives such as high income taxes (just about the highest in the nation). high
fuel costs (highest in the nation), traffic (among the worst in the nation),
overcrowded prisons )it can no longer afford), and the severe natural disasters
such as forest fires and extreme cycle of droughts to floods and back again.
The
site fails to mention flight of businesses. Exhibit A is Apple's decision to
invest over a billion dollars in HQ2 in Austin, Texas ---
https://www.apple.com/newsroom/2018/12/apple-to-build-new-campus-in-austin-and-add-jobs-across-the-us/
The
site praises the trend downward in the number of undocumented immigrants flowing
across the southern border without giving any credit to the highly effective
fencing installed by the Federal government.
California is a sanctuary state that protects undocumented residents at the
expense of legal residents. For example, home and business cameras
now have options for face recognition software. But in places like San Francisco
face recognition technology is now banned because it might recognize
non-citizens ---
https://www.businessinsider.com/microsoft-cruel-to-stop-government-using-facial-recognition-2019-2
The
article never mentions that California lost the drug war ---
http://www.sfexaminer.com/sfpd-efforts-fight-opioid-epidemic-question-police-net-dozens-arrests/
Police in San Francisco have seized more than 125
pounds of narcotics and $500,000 in drug money so far this year, the latest
numbers on police efforts to curb the opioid crisis show.
A targeted operation in the Tenderloin and South of
Market netted 62 drug arrests in a single week last month, Cmdr. David Lazar
said at the most recent Police Commission hearing last Wednesday.
Yet drug users continue to inject on city
sidewalks and the usual street corners remain open-air drug markets. Several
members of the Police Commission questioned the merits of the enforcement
efforts.
“We know that jail isn’t working,” Police
Commissioner Cindy Elias said at the hearing. “It’s very frustrating for
officers who see these people day in and day out, even if they arrest them
it’s not making a difference.”
Are the slums of San Francisco worse than
slums of India, Haiti, Africa? (Possibly because of drug addiction)
https://townhall.com/columnists/johnstossel/2019/02/07/slum-by-the-bay-n2540841?utm_source=thdaily&utm_medium=email&utm_campaign=nl&newsletterad=02/07/2019&bcid=b16c6f948f297f77432f990d4411617f&recip=17935167
San Francisco Health
Department: There are about 24,500 injection drug users in San Francisco —
that’s about 8,500 more people than the nearly 16,000 students enrolled in San
Francisco Unified School District’s 15 high schools ---
http://www.sfusd.edu/en/assets/sfusd-staff/about-SFUSD/files/sfusd-facts-at-a-glance.pdf
And most of those injection drug users are among the
hordes of homeless defecating in the streets
https://www.theguardian.com/commentisfree/2018/aug/18/san-francisco-poop-problem-inequality-homelessness
The
article laments housing shortages but never mentions that much of the problem is
due to rent control.
Here's what left-leaning Nobel Prize winner Paul Krugman says about rent control
---
https://www.nytimes.com/2000/06/07/opinion/reckonings-a-rent-affair.html
. . .
The analysis of rent control is among the
best-understood issues in all of economics, and -- among economists, anyway
-- one of the least controversial. In 1992 a poll of the American Economic
Association found 93 percent of its members agreeing that
''a ceiling on rents reduces the quality and quantity of housing.''
Almost every freshman-level textbook contains a case study on rent control,
using its known adverse side effects to illustrate the principles of supply
and demand. Sky-high rents on uncontrolled apartments, because desperate
renters have nowhere to go -- and the absence of new apartment construction,
despite those high rents, because landlords fear that controls will be
extended? Predictable. Bitter relations between tenants and landlords, with
an arms race between ever-more ingenious strategies to force tenants out --
what yesterday's article oddly described as ''free-market horror stories''
-- and constantly proliferating regulations designed to block those
strategies? Predictable.
And as for the way rent control sets people against
one another -- the executive director of San Francisco's Rent Stabilization
and Arbitration Board has remarked that ''there doesn't seem to be anyone in
this town who can trust anyone else in this town, including their own
grandparents'' -- that's predictable, too.
None of this says that ending rent control is an
easy decision. Still, surely it is worth knowing that the pathologies of San
Francisco's housing market are right out of the textbook, that they are
exactly what supply-and-demand analysis predicts.
But people literally don't want to know. A few
months ago, when a San Francisco official proposed a study of the city's
housing crisis, there was a firestorm of opposition from tenant-advocacy
groups. They argued that even to study the situation was a step on the road
to ending rent control -- and they may well have been right, because
studying the issue might lead to a recognition of the obvious.
So now you know why economists are useless: when
they actually do understand something, people don't want to hear about it.
Brookings: What does (new) economic evidence tell us about the effects of
rent control?
https://www.brookings.edu/research/what-does-economic-evidence-tell-us-about-the-effects-of-rent-control/
Jensen Comment
We have friends whose son is a San Francisco chef. Their son lives in a tiny,
tiny and poorly maintained rent-controlled apartment with his wife. The
apartment is very convenient for walking to their jobs. The claim is that they
decided that they would rather keep their apartment rather than have children in
a studio apartment or commute from outlying areas. If true, this illustrates an
externality of rent control.
The article above concluded with the following paragraph:
Rent control appears to help affordability in the
short run for current tenants, but in the long-run decreases affordability,
fuels gentrification, and creates negative externalities on the surrounding
neighborhood. These results highlight that forcing landlords to provide
insurance to tenants against rent increases can ultimately be
counterproductive. If society desires to
provide social insurance against rent increases, it may be less
distortionary to offer this subsidy in the form of a government subsidy or
tax credit. This would remove landlords’
incentives to decrease the housing supply and could provide households with
the insurance they desire. A point of future research would be to design an
optimal social insurance program to insure renters against large rent
increases.
Note that having private insurance to mitigate rent increases would have to
be taxpayer-funded insurance since it makes no economic sense to have it be
tenant-funded. Insurance covers unlikely happenings. Rent increases are pretty
much likely happenings in urban areas much like the fact that the only owners
needing flood insurance are those owners likely to be flooded. Hence, the
government has to fund flood insurance. Similarly the government would have to
fund rent increase insurance.
Why might the government fund rent increase insurance that transfers taxpayer
dollars to renters and landlords?
There's probably not a good argument for a couple in San Francisco earning
nearly $250,000 per year. But there may be reasons for helping teachers,
firefighters, police, and other civil servants making less than $150,000 per
year. But I would argue that this type of subsidy to such renters is unfair,
because it helps only those willing to live in small apartments and penalizes
their colleagues who must pay commuting expenses in order to have larger and
safer homes and better schools for families. It's better, in my opinion, to
subsidize the wages lower-income folks providing necessary services rather than
subsidize only those who choose to rent closer residences to their jobs.
Faced with a housing shortage and skyrocketing rents, Oregon is
poised to become the first state to impose mandatory rent controls, with a
measure establishing tenant protections moving swiftly through the Legislature
---
https://outline.com/ZjFACN
House Speaker Tina Kotek, a Democrat, said
30,000 housing units must be built per year to meet the state’s current
housing deficit and to build for the future as more people move to Oregon.
Jensen Comment
Is Tina Kotek the comedian of the day?
What's the incentive to build new rental units? What prospective landlords would
want to invest in long-term housing subject to rent control limits on revenue
and unrestrained risk on expenses?
Short-term returns may not sound too bad in this era of low interest rates, but
over the long-term you've got to be stupid to invest under these rent-controlled
restrictions.
One year in the future Oregon will at last legislate landlord incentives to
invest, but not today.
This is not the answer to providing shelter for the homeless, many of whom are
addicts and/or on welfare
**How to Mislead With
Statistics (distortion, bias)
A Physics Journal Suggests Scientist Sampling Bias Might be Distorting View of
Upheaval Due to Global Warming ---
https://phys.org/news/2018-02-sampling-bias-distorting-view-upheaval.html
Critics
have argued that the evidence of an association between climate change and
conflict is flawed because the research relies on a dependent variable
sampling strategy. Similarly, it has been hypothesized that convenience of
access biases the sample of cases studied (the 'streetlight effect'). This
also gives rise to claims that the climate–conflict literature stigmatizes
some places as being more 'naturally' violent. Yet there has been no proof
of such sampling patterns. Here we test whether climate–conflict research is
based on such a biased sample through a systematic review of the literature.
We demonstrate that research on climate change and violent conflict suffers
from a streetlight effect. Further, studies which focus on a small number of
cases in particular are strongly informed by cases where there has been
conflict, do not sample on the independent variables (climate impact or
risk), and hence tend to find some association between these two variables.
These biases mean that research on climate change and conflict primarily
focuses on a few accessible regions, overstates the links between both
phenomena and cannot explain peaceful outcomes from climate change. This
could result in maladaptive responses in those places that are stigmatized
as being inherently more prone to climate-induced violence.
How to Mislead With Statistics
(bias)
Gun Buyback Claims and Media Lies
http://reason.com/blog/2018/03/01/media-reports-australians-handed-in-5700
Jensen Comment
I'm not against gun buybacks. But I'm against media bias in reporting almost
anything that distorts known facts.
**How to
Mislead With Statistics (bias, proportions versus totals)
The USA Spends $23 Billion More on White Districts than Black Districts
---
https://leaders.edweek.org/profile/angela-ward-supervisor-race-equity-programs-cultural-proficiency/?cmp=eml-enl-eu-news1&M=58762398&U=2290378&UUID=b16c6f948f297f77432f990d4411617f
Jensen
Comment
That there is still segregation in some school districts is a sad thing, but
almost no districts are entirely white anymore so some progress has been made.
Where this study is misleading is that it implies that more tax money is spent
on white children per pupil. That is
misleading in several respects. Instead it states the obvious. More money is
spent in aggregate on white children mostly because there are so many more white
children. Blacks only account for about 13% of the USA population, and Latinos
are from mixed races with some being white (usually when descended from
Europeans and colored (when descended from natives). Also in black districts
(think New Orleans and Memphis) white children are often sent to private schools
not funded by taxpayers. The study should've reported the proportion of taxpayer
money spent per pupil.
Bayesian Probability ---
https://en.wikipedia.org/wiki/Bayesian_probability
**How to Mislead Without Statistics: A Challenge for
Bayesians
Business Insider talked to psychologists to learn why people think they have a
shot at winning, despite the near-impossible odds ---
https://www.businessinsider.com/powerball-odds-why-people-think-theyll-win-2018-10#even-when-we-lose-we-think-were-just-short-of-winning-3
Jensen Comment
Probably the biggest mistake is thinking a succession of losses increases the
odds of winning --- thus keeping players clinging to a slot machine or throwing
the dice until morning's daylight or buying more and more lottery tickets after
a long string of losses.
There's a difference between buying a dream with one
lottery ticket (and expecting to lose with near certainty) and buying 20+
lottery tickets (and expecting you're due to win for a change).
There is a way of winning with certainty in some games by
more than doubling the bet with each succession of plays (known as the St.
Petersburg Paradox), but casinos and home poker players ban this by placing
upper limits on bets. In lotteries even millionaires cannot afford to follow a
SPP strategy.
The only real winners over time in a casino are the owners
of the casino, because odds always favor the casino over time.
The casino can of course lose to the one-time player who
gets lucky one time.
**How to Mislead With
Statistics
Can ‘White Resentment’ Help
Explain Higher-Education Cuts? ----
https://www.chronicle.com/article/Can-White-Resentment-/247921?utm_source=at&utm_medium=en&cid=at&source=ams&sourceId=296279
Blunt discussions
of racism are increasingly showing up in research of state higher-education
issues. A recent study into state appropriations for public colleges is one
of a growing number of efforts to try to understand how considerations of
race are driving policy decisions.
The researchers
found that Republican lawmakers were more generous to higher education in
places where there was a higher proportion of white students enrolled as
undergraduates.
Take state
appropriations, for example. Most studies of the issue rely on the
assumption that state lawmakers are seeking to make rational choices in
doling out tax dollars. One common explanation is that higher education
serves as a sort of “balance wheel” for the state budget: Money for higher
education increases in good economic times and decreases when state revenues
fall, according to a new paper by Barrett J. Taylor, at the University of
North Texas, and Brendan Cantwell, at Michigan State University.
But Taylor and
Cantwell eyed instead a more sinister explanation. They suspected that
Republican lawmakers, who are overwhelmingly white, would be less generous
to an increasingly diverse higher-education landscape. “Republican officials
may be more skeptical of higher-education funding when the presumed
beneficiaries of government spending are racially diverse,” they posit in
their paper.
Cantwell and
Taylor looked specifically at places where Republicans controlled both the
legislative and executive branches of state government. And they measured
how state appropriations differed when the undergraduate enrollment is
either more diverse or less diverse than the overall state.
They found that
Republican lawmakers were more generous to higher education in places where
there was a higher proportion of white students enrolled as undergraduates.
“The findings are quite robust,” said Cantwell, an associate professor of
educational administration.
People might
interpret those results very differently depending on their political
leanings, Cantwell said, because the study doesn’t establish that Republican
lawmakers are actively choosing to spend less on diverse populations of
college students.
Continued in article
Jensen Comment
This is one of the many articles that the Chronicle disallows comments,
because the Chronicle is opposed to opposing viewpoints that it cannot
referee in letters to the editor (only a miniscule number of letters are
published).
This article misleads by not
looking for other causes in the decline in state appropriations for higher
education.
I don't deny that some racism
and bias against higher education spending are involved by some lawmakers, but
the principle cause of the principle cause of the proportionate decline in in
state appropriations for higher education is the rise in
budget demands that take priority over higher education, mostly Medicaid.
Medicaid is heavily funded by state taxpayers, and costs of medical care
and medications rose faster than inflation. Added to this demand for funding is
the increased numbers of people eligible for Medicaid that arose by increasing
the income levels for eligibility for Medicaid that came about with Obamacare.
The Medicaid Expansion
Cheat ---
https://mises.org/wire/medicaid-expansion-cheat?utm_source=Mises+Institute+Subscriptions&utm_campaign=326849ea12-EMAIL_CAMPAIGN_2019_12_31_06_15_COPY_01&utm_medium=email&utm_term=0_8b52b2e1c0-326849ea12-2287089
The Washington Post:
Medicaid is Out of Control. Here's How to Fix It ---
https://www.washingtonpost.com/opinions/medicaid-is-out-of-control-heres-how-to-fix-it/2017/03/19/05167e9e-0b2e-11e7-a15f-a58d4a988474_story.html
. . .
But
the most significant Medicaid fact is this: Although three-quarters of
Medicaid recipients are either children or young adults, they account for
only one-third of costs. The elderly and disabled constitute the other
one-quarter of recipients, but they represent two-thirds of costs.
How
could this be? Doesn't Medicare — not Medicaid — cover the elderly and
disabled? Well, yes, but there’s a giant
omission: nursing home and other long-term care. Medicaid covers these for
the poor elderly and disabled.
At
the federal level, spending on the elderly — mainly for Social Security,
Medicare and Medicaid — is already crowding out nonelderly spending, as the
Trump administration's 2018 budget shows. Now pressures are tightening on
states.
Because they pay 40 percent of Medicaid, its escalating costs compete
directly with state and local services — schools, roads, police, parks,
sanitation — and lower taxes. Medicaid's “entitlement” nature means that
anyone who qualifies for support must get it. By contrast, schools and other
state services get what seems affordable. Slowly, Medicaid is usurping state
priorities.
Medicaid now claims nearly one-fifth of states' general revenues, reports
Robin Rudowitz of the Kaiser Family Foundation. Under present law, the
squeeze will worsen.
Fortunately, there’s a sensible solution to this problem. It isn't to gut
care for the elderly. Instead, we should
transfer Medicaids long-term care to the federal government, which would pay
all costs, probably by merging with Medicare.
In return, the states would assume all Medicaid’s costs for children and
younger adults, give up some or all of their federal aid for K-12 schools
and, if needed, trim other federal grants to ensure financial neutrality.
At
the outset, there would be no obvious winner. For every dollar of higher
federal spending on long-term care, there would be a dollar offset in lower
spending on medical care for children and younger adults plus less generous
federal grants. But over time, this swap of responsibilities would make
sense for everyone. It would concentrate oversight for the young at the
state and local levels while aid to the elderly and disabled would be firmly
lodged at the federal level.
Consider. For states, spending would no longer be tied to demographic trends
— an aging society — they can't change. Controlling schools and a
child-centered Medicaid, they would be in the best position to fight child
poverty, which is arguably the nation's most serious social problem. The
rising costs of long-term care, a national problem, would not handcuff them.
As
for the federal government, it would control all major programs for the
elderly and disabled. The present splintering is undesirable. It means that
a fifth of Medicare recipients are so-called “dual eligibles,” belonging
also to Medicaid. This raises costs and complicates caregiving. If benefits
for the elderly are to be cut (say, by raising eligibility ages), that job
is best done if the federal government can choose from all programs for the
old.
Unfortunately, there is little support for this sort of swap. Commentators
(including this reporter) periodically propose it and praise its benefits.
But national politicians seem uninterested. They prefer instead to bleed the
states.
Jensen
Comment
Hence if you take long-term care expenditures out of state Medicaid budgets you
would have more state money for higher education.
Sadly, the Federal government
is already running at a trillion dollar deficit. We can just keep expanding the
deficit. Other solutions are needed.
**How to
Mislead With Statistics (Distortions, Definitions)
Nearly Half of Undergraduates Are Students of Color. But Black Students
Lag Behind ---
https://www.chronicle.com/article/Nearly-Half-of-Undergraduates/245692?cid=at&utm_source=at&utm_medium=en&elqTrackId=4b25b4445cd449deab2ac48c46f77478&elq=e53c5591cbc9463eaa6a81d8ee5ad6fd&elqaid=22249&elqat=1&elqCampaignId=10942
The key data
points in the American Council on Education's new report on race and
ethnicity in higher education come as no surprise: College-student
populations are growing more diverse, yet achievement gaps persist among
different racial groups.
Still, the poor
outcomes for black students in particular are glaring.
All students of
color now make up more than 45 percent of the undergraduate population,
compared with less than 30 percent two decades ago, the association's report
found. Nearly one-third of graduate students are now people of color.
Hispanic students have shown the most growth; they are enrolling in and
completing college at levels never seen before.
Black students,
too, represent a larger share of the undergraduate- and graduate-student
population than 20 years ago, and a larger share of the students who earn
degrees. But black students who began college in the fall of 2011 had higher
dropout rates and lower six-year completion rates — 46 percent at public
institutions, 57 percent at private institutions — than any other racial
group.
The gender gap
for black students is wider than it is for any other group, as nearly
two-thirds of black undergraduates, and more than two-thirds of black
graduate students, are women. Black male students pursuing bachelor's
degrees were the most likely among any demographic group to drop out after
their freshman year.
Black
undergraduates also owed 15 percent more than other students after
graduation: an average of $34,010, compared with $29,669 for all students.
One-third of black students accumulated more than $40,000 in debt after
graduation, versus 18 percent of students over all.
Even with a
bachelor's degree, black graduates between the ages of 25 and 34 had lower
salaries than other graduates of a similar age, and their unemployment rate
was two-thirds higher, on average.
Continued in article
Jensen Comment
The phrase "color" is somewhat ambiguous in the USA --- especially since Latinos
are multiracial, particularly in terms of origins from Europe versus darker
native heredity ---
https://en.wikipedia.org/wiki/Demography_of_the_United_States#Race_and_ethnicity
It would seem that "whites" are now underrepresented in undergraduate
enrollments in the USA.
According to the 2010–2015
American Community Survey, the racial
composition of the United States in 2015 was:
|
Race |
Population (2016 est.) |
Share of total population |
|
Total |
318,558,162 |
100% |
|
One race |
308,805,215 |
96.9% |
|
White |
233,657,078 |
73.3% |
|
Black or African American |
40,241,818 |
12.6% |
|
American Indian and Alaska Native |
2,597,817 |
0.8% |
|
Asian |
16,614,625 |
5.2% |
|
Native Hawaiian and Other Pacific Islander |
560,021 |
0.2% |
|
Other races |
15,133,856 |
4.8% |
|
Two or more races |
9,752,947 |
3.1% |
|
White and Black or African American |
2,525,509 |
0.8% |
|
White and American Indian and Alaska Native |
1,884,407 |
0.6% |
|
White and Asian |
1,956,740 |
0.6% |
|
Black or African American and American Indian and Alaska Native |
318,302 |
0.1% |
Population distribution by race 1940-2010 (in %)
Hispanics
are shown like part of the races. Source:
U.S. Census Bureau, decennial census
of population, 1940 to 2010.[47]
|
Years |
1940 |
1950 |
1960 |
1970 |
1980 |
1990 |
2000* |
2010* |
|
White |
89.8 |
89.5 |
88.6 |
87.5 |
83.0 |
80.3 |
75.1 |
72.4 |
|
Black or African American |
9.8 |
10.0 |
10.5 |
11.1 |
11.7 |
12.1 |
12.3 |
12.6 |
|
American Indian and Alaska Native |
|
|
|
|
0.8 |
0.8 |
0.9 |
0.9 |
|
Asian and Native Hawaiian
and other Pacific Islander |
|
|
|
|
1.5 |
2.9 |
3.8 |
5.0 |
|
Some other race |
|
|
|
|
3.0 |
3.9 |
5.5 |
6.2 |
|
Two or more races |
|
|
|
|
|
|
2.4 |
2.9 |
|
Sum (%) |
99.6 |
99.5 |
99.1 |
98.6 |
100 |
100 |
100 |
100 |
*Data
are shown for the White, Black or African American, American Indian and
Alaska Native, Asian and Native Hawaiian and Other Pacific Islander, and
Some other race alone populations.
Moody's Continues New York Law School's Negative Financial Outlook, Citing
Its 26% Operating Deficit ---
https://www.law.com/newyorklawjournal/2019/02/08/new-york-law-school-still-faces-financial-challenges-moodys-finds/
I have not tracked the Wikipedia module over time for the NYLS. But I have
tracked some other Wikipedia modules over time. For example, at one time the
Wikipedia module for Paul Krugman cited articles that questioned his occasional
integrity lapses in using data. However, today all of these negative citations
have been removed from
https://en.wikipedia.org/wiki/Paul_Krugman
My point is that negativism is not always removed from Wikipedia modules. But
you cannot trust them to always be balanced for research purposes. They often
are biased toward the positive side, much like the bias that arises in reviews
of products on Amazon. Negative reviews often appear for products listed in
Amazon, but you can't trust them to be unbiased. Many of the positive reviews
are biased investors, employees, friends, and paid reviewers. Many of the
negative reviews are sponsored by competitors.
I don't think the Wikipedia modules suffer heavily from "fake news." However,
they do suffer hugely from cherry picking when it comes to biographies ---
https://en.wikipedia.org/wiki/Cherry_picking
It's possible in wikis to enter more balanced items, but don't count on those
newer entries to remain if they are bad news items.
As a test, investigate how often Wikipedia modules fail
to mention detected plagiarizing in their Wikipedia entries ---
http://faculty.trinity.edu/rjensen/Plagiarism.htm#Celebrities
It's surprising how often mention of plagiarism remains in their Wikipedia
modules, including those of Martine Luther King, Jr. and Jane Goodall.
Wikipedia is not entirely biased.
**How to Mislead With Statistics (well not exactly mislead so much as conclude the
obvious)
Law School GPA Is A Much Better Predictor Of Bar Passage Than LSAT Or UGPA
---
https://taxprof.typepad.com/taxprof_blog/2019/01/anderson-law-school-gpa-is-a-much-better-predictor-of-bar-passage-than-lsat-or-ugpa.html
Jensen Comment
Why is this surprising? The LSAT and UGPA predictors were recorded before
students entered law school. The data are three or more years out of date and
ignore everything that transpired in three or more years of law school. Is it
surprising that the Law School GPA that reflects performance in law school and
is much more up to date in terms of when the BAR exam is taken? Common folks!
We could also compare this data with IQ tests taken in the first grade when
students were six years old. Would it be surprising that the Law School GPA was
a better predictor than IQ?
What the report does tell us is that for ultimate BAR exam passage, the LSAT is
a better predictor than Undergraduate GPA. As suggested in the article this is
to be expected because UGPA is derived across so many different colleges that
inevitably have different grading standards and virtually all suffer from grade
inflation ---
http://faculty.trinity.edu/rjensen/assess.htm#RateMyProfessor
It does somewhat counter those analysts who try to argue that standardized tests
like the LSAT are worse predictors than grade --- don't believe it in terms of
BAR exam performance.
*
*How to Mislead With Statistics
(Definitions, Distortions)
How Much Accountants And Tax Preparers Earn In Every State --
https://taxprof.typepad.com/taxprof_blog/2019/02/how-much-accountants-and-tax-preparers-earn-in-every-state.html
Jensen Comment
I could make my usual criticisms such as cost of living differences and state
taxation differences that overwhelm the supposed earning differences by state.
I could also criticize the BLS mean statistics as not being accompanied with
data on variances and skewness.
Averages get distorted by wages of newly-hired college graduates mixed in with
employees having years of experience.
In tax season a whole lot of overtime gets paid to accountants who are tax
preparers where not so much overtime gets paid to accountants who don't work in
tax.
But mostly I will focus on the vagueness of what is a "an accountant and tax
preparer." Some are entrepreneurs and partnerships (including LLC corporations),
those equity owners of accounting firms. And accounting firms vary in size
from no employees to thousands of employees. And those firms most likely mix
revenues from tax preparation to systems consulting to auditing to whatever. It
would be misleading merge what partners make with the salaries they pay their
employee "accountants and tax preparers." And those salaries paid to employees
probably have a lot of benefits not picked up in the BLS data such as profit
sharing and bonuses and fringe benefits such as expensive training and day care
subsidies.
My basic point is
that "owners" of accounting firms are still doing a lot of the accounting,
auditing, consulting, and tax work alongside their employees. Public accounting
(and law) firms are not like NFL teams where owners are in the luxury
boxes and not getting knocked around on the playing fields. What is paid to an
employee in "salary" is typically only paid for the first 5-10 years until
employees either become part owners of the firm or are moved out of public
accounting into business firms or government (think FBI).
You just cannot compare what public accountants make in "salaries" with what
accountants make in business firms and government where accountants spend their
entire careers living on "salaries."
Most
public accountants are only on "salaries" for the first 5-10 years of their
careers.
After that they're working
owners
and no longer "public accountants working for owners."
And now we get to the most important reason the salaries
in the above article are so low. The problem is definitional. CPAs having
masters degrees are mixed in with "accountants and tax preparers" who might've
never graduated from high school. The non-CPAs' low
salaries drag down the BLS mean averages. Most candidates for the CPA
exam have masters degrees since they have to have 150 or more college credits to
even sit for the CPA exam.
**How to Mislead With Statistics
CNN: College grads earn $30,000 a year more than people with just a
high school degree ---
https://www.cnn.com/2019/06/06/success/college-worth-it/index.html
Jensen Comment
This study has the common misleading conclusions due to comparing averages
without also looking at variances and skewness. When Warren Buffett walks into a
restaurant having 50 diners the average customer becomes a billionaire for a few
moments.
The study is misleading because it lumps "college graduates" into one
sampling population. There are college graduates with four-year degrees,
five-year-degrees, and all the way up to brain surgeons who did not become fully
licensed until 12 years after graduating from high school. And among non-college
graduates there are those who had drive taxi cabs versus those who became
skilled airliner mechanics.
Incomes of both college graduates and non- college graduates are highly
skewed below means and medians. Think of all the parents where one parent mostly
stays at home to care for children, thereby having zero or very low part-time
wages. Since more than half of the high school graduates do not earn have
a college degree this makes the parental skewness more pronounced in the
non-college population.
There are huge measurement problems. Think of all the partners raising
children full time earn virtually zero in wages while sharing in the income of
their partners who have college degrees. My point is that these
measuring one parent's earnings as zero is misleading in
terms of family income.
And think of the many farm couples who really are partners in the earnings of
the farm. How do you partition the farm income between one spouse who has a
college degree from the other spouse who did not complete college?
Then there's the mistake of comparing "earnings" without comparing living
costs. College graduates more often are going to take jobs in urban areas where
both wages and living costs are higher then in rural areas Teachers make
more in Manhattan than in a small town because it costs outrageously more to
live in Manhattan. A carpenter in Swea City, Iowa can live a lot better on
$48,000 per year than many carpenters in Des Moines making higher wages. And a
college graduate cannot find a chemical engineering job in Swea City and is
forced to move to Des Moines or an more costly larger city.
And there's a huge problem of comparing workers in terms of lifetime
benefits. The high school graduate who elects to join the low-wage Air Force
rather than go to college does not end up so bad at Age 38 with a pension, free
medical care, and free medications for the remainder of her life while her best
friend became a third-grade teacher and cannot retire at Age 38 with any
lifetime benefits until reaching Social Security and Medicare age.
Why does the media persist in comparing apples and oranges using misleading
statistical comparisons?
**How to Mislead With Statistics
How median household income has changed (allegedly very little)
https://apnews.com/bfac20c7cdf14719ac03d750d8fdffbc/US-household-incomes-grew-in-2017,-yet-inequality-worsens
But Much depends on how "household income" is defined
Vox: Trump’s White House says wages are rising more than liberals think:
The White House is probably right ---
https://www.vox.com/2018/9/6/17823072/trump-cea-wages
**How to Mislead with Statistics
(missing variables, distortion, bias)
Guns Kill More U.S. Children Than Cancer
https://qz.com/1505227/guns-kill-more-more-us-children-per-year-than-cancer/
Jensen Comment
The headline and the bar chart are more misleading than the article itself that
provides added detail that some of those deaths by guns would've likely been
deaths by other means had guns not been available:
. . .
The researchers used data from a US Centers for
Disease Control database that compiles death certificates throughout the US;
2016 is the most recent year for which complete data is available. Of the
3,143 US childhood gun deaths that year, 1,865, or about 60%, were
homicides. Another 35% (1,102 deaths) were suicides, and 4% (126 deaths)
were unintentional shootings. The circumstances surrounding the remaining 1%
(50 deaths) were too unclear to be categorized in this way.
“Children in America are dying or being killed at
rates that are shameful,” Edward W. Campion, the executive editor of the New
England Journal of Medicine and a physician, wrote in an editorial that was
published the same day as the study. “The sad fact is that a child or
adolescent in the United States is 57% more likely to die by the age of 19
years than those in other wealthy nations. America’s children and
adolescents are at far higher risk for death than are youth in other
developed countries such as England, Sweden, and Australia.”
Continued in article
For example, of the 3,143 deaths by guns over a third were suicides. Chances
are that most of those children bent on committing suicide would've found other
means to die such as overdosing, jumping off balconies or crashing vehicles.
And how do we know that quite a few of the deaths attributed to vehicle
accidents were really undetected suicides.
Only 126 childhood deaths(4%) purportedly were unintentional --- a lot less
than is implied by the headline and bar chart. I'm not sure how deaths that were
accidental due to unintended victims of drive-by shootings are classified. Are
these homicides or unintentional?
What is the real tragedy in the USA is that nearly 2,000 childhood deaths per
year are from homicides. As with suicides, if guns were not available chances
are that many of those homicides would have resulted in deaths by other means
such as knives or beatings.
What is very misleading in the above article is the failure to report number
of lives saved and rapes prevented when a "child" is killed by a gun. A goodly
number of the teens killed by guns were teens threatening police or teens who
invaded households or were attempting to commit violent rapes or car jackings
with their own weapons. Some were killed in armed holdups. Some were killed in
various other types of self defense.
And it's very misleading to compare nations and different cultures on the
basis of childhood gun deaths. Nations with fewer gun deaths are likely to have
fewer homicides, rapes, and/or suicides for various cultural reasons or they are
more dangerous for children (especially females) for other reasons. If fewer
children are killed by guns in Mexico City than in Chicago or Dallas does that
make the streets safer for children in Mexico City (or Bangkok or Rio)?
I'm all in favor of gun laws with severe punishments for guns that are not
very securely locked in place. I don't think there's a need for assault rifles
to be sold to anybody other than law enforcement and the military. But I also
think that gun possession is a deterrent that is impossible to build into
statistics. It's impossible to measure the number of crimes that did
not take place because of any one deterrent. I
believe gun possession is a deterrent to crime in the grand scheme of things.
And while we're at it, cancer one of the very leading killers of adults. But
it's played up more in the media as a killer of children than is warranted,
especially by non-profits seeking money for cancer care and research. But if you
look at the bar chart in the above article, 9% of childhood deaths from cancer
is only slightly higher than 7% of dying from suffocation (apart from drowning)
that gets very little fund raising attention in the media. Aside from vehicle
deaths, childhood deaths are relatively low. We, with the help of nature,
protect our children pretty well in the USA.
Incomplete Analysis (including failure to report variances and skewness)
**How to Mislead With Statistics
America’s Worst Cities to Drive In ---
https://247wallst.com/special-report/2019/11/20/americas-worst-cities-to-drive-in/
Jensen Comment
You instantly recognize that something is wrong with any ranking that claims
it's worse to drive in Yuba City, Stockton or Modesto, California than in New
York City, Chicago, Houston, Boston, and Los Angeles you know that
the analysts were out of their minds.
Take for example a criterion like average commuting times in Stockton (37.2
minutes) versus Los Angeles (31.3 minutes). This totally ignores the standard
deviations and skewness of the distributions. Without being slowed by congestion
it's not uncommon for drivers in Los Angeles to routinely
spend over two hours commuting each way. This is unheard of within the city
limits of Stockton or Modesto or Yuba City.
The data show hours lost due to congestion for most cities but calculating
such a statistic for large cities like Los Angeles is
hopeless since there's congestion somewhere Los Angeles 24/7 each and
every week of the year.
The data does not include things like the health-hazards of "tension" while
driving. It has to be much more nerve wracking driving in cities like Houston
and Atlanta on freeways that have over 20 lanes (think of trying to get from an
inside lane to an outside lane or vice versa) than in driving in Stockton,
California ranked as being worse for driving than literally every large city in
the USA. Such tensions are totally ignored in this ranking of worst cities to
drive in. When my wife and I drive to Boston the tension of driving jumps
dramatically when we get within 30 miles of Boston. And there's maximum tension
driving at 55 mph bumper-to-bumper inside the traffic tunnels of Boston. How do
those country music song lyrics go: "Don't fence me in."
We tell our house guests who are flying into Logan Airport in Boston to catch
the bus to Concord, NH where we meet them at the bus station. This reduces our
blood pressure markedly compared for our having to drive all the way to Logan
Airport in Boston traffic and tunnels.
What the above ranking tries to tell us is that driving in most any city
(large or small) in California is worse than driving in most any of our largest
cities (think Chicago, New York, Dallas, Houston, Baltimore, Washington DC,
Atlanta, etc.).
I say baloney to this ranking!
**How to Mislead in Various Ways
Online Education is Better
https://marginalrevolution.com/marginalrevolution/2020/05/online-education-is-better.html
Jensen Comment
There are so many things to consider when comparing onsite versus online
education.
Firstly, there's the difference
in student levels and motivation. Many empirical studies (thousands?) conclude
that for highly motivated students pedagogy does not matter. Good students do
whatever it takes to get their A grades ---
http://faculty.trinity.edu/rjensen/assess.htm#AssessmentIssues
This often is the case for advanced students who tend to be more motivated
unless they're just curiosity seeking without the time or inclination to put in
the work needed to excel in a course.
For unmotivated, especially younger, students pedagogy tends to matter more,
especially when students are lethargic under Socratic Method. The teachers with
the highest teaching evaluations tend to be those that spoon feed in lectures
combined with relatively easy grading (virtually all top teachers at
RateMyProfessors.com are easy graders who also take personal interests in their
students). In advanced courses the knowledge of the instructor combined with
course preparation tends to increase in importance.
Secondly, there's the
fundamental difference in pedagogy such as synchronous versus asynchronous
pedagogy differences in either online or onsite learning ---
http://faculty.trinity.edu/rjensen/255wp.htm
Years ago in the SCALE Experiments for 30 courses across five years at the
University of Illinois students living on campus were divided in each course
into those students who learned virtually everything online asynchronously
versus those who had to go to synchronous classes. Each course was taught
by the same instructor using the same materials and examinations. The findings
are interesting ---
http://faculty.trinity.edu/rjensen/255wp.htm#Illinois
Thirdly, when referring to
"online education" there are huge differences in how it transpires. At one
extreme an instructor is available huge portions of each day and available for
"instant messaging" with a relatively small number of students. The gold
standard at this extreme is tax professor Amy Dunbar at the University of
Connecticut ---
http://www.cs.trinity.edu/~rjensen/002cpe/Dunbar2002.htm
At the other extreme there may be over a million students taking a MOOC course
from a prestigious university where the instructor has zero personal
communications with so many students. There are always some outstanding students
completing MOOC courses, but they are doing so without any outside help from
their instructors. Many more students get lost along the way and drop out.
My point here is that saying
"online is better" or "onsite is better" is over generalizing across varied
circumstances.
**How to Mislead With Statistics:
'Big 4' salaries, revealed: How much Deloitte, KPMG, EY, and PwC
accountants and consultants make, from entry level to executive roles ---
https://www.businessinsider.com/salary-of-consultants-accountants-big-4-deloitte-kpmg-ey-pwc-2020-7?nr_email_referer=1&utm_source=Sailthru&utm_medium=email&utm_content=Business_Insider_select&pt=385758&ct=Sailthru_BI_Newsletters&mt=8&utm_campaign=Insider%20Select%202021-01-06&utm_term=INSIDER%20SELECT%20-%20ENGAGED%2C%20ACTIVE%2C%20PASSIVE%2C%20DISENGAGED%2C%20NEW
-
In 2019, the so called
"Big Four" accounting firms — PricewaterhouseCoopers (PwC), KPMG,
Ernst & Young (EY), and Deloitte — employed well
over a million people.
-
These firms are known
for paying employees six-figure salaries right out of business
school.
-
To figure out how much
accountants and consultants make at these firms, Business Insider
analyzed the US
Office of Foreign Labor Certification's 2020 disclosure data for
permanent and temporary foreign workers.
-
For example, some
analysts and auditors made more than $120,000 at Ernst & Young (EY),
principals were given up to $950,000 in compensation at KPMG, and
managers at PwC made $123,019 or more.
The so called "Big
Four" accounting firms — PricewaterhouseCoopers (PwC), KPMG, Ernst & Young (EY),
and Deloitte — are known for paying their staff high salaries.
In 2019, the four firms combined employed well
over a million people worldwide. New
hires typically earn six-figure salaries from the get-go. An entry-level
consultant who just graduated from business school can make more
than $200,000 a year at the four firms when
you include base salary, bonuses, and relocation expenses.
The Big Four firms are planning to hire in 2021. A
spokeswoman at PwC previously told Insider that the firm typically brings in
13,000 entry-level and experienced employees on a yearly basis, and its
hiring volume for interns and full-time workers will be similar this year.
Deloitte and EY are both planning to expand
their workforces in India.
Insider analyzed the US
Office of Foreign Labor Certification's 2020 disclosure data for
permanent and temporary foreign workers to find out what PwC, KPMG, EY, and
Deloitte paid employees for jobs ranging from entry-level to executive
roles. The salary data analyzed were based across the US.
We looked through entries specifically for
roles related to management consulting and accounting. Performance bonuses,
signing bonuses, and compensation other than base salaries are not reflected
in this data.
Here's how much PwC, KPMG, EY, and Deloitte
paid their hires last year.
Deloitte is organized
into three main service areas that offer
different salaries. These areas include the human capital division, the
strategy and operations division, and the technology division. Deloitte had
the greatest
number of employees, topping
312,028 in 2019, according
to research platform Statista.
It also applied for the greatest number of
visas compared to other leading consultancies. The company applied for 7,444
visas in the last half of 2019 and the first half of 2020. Deloitte did not
immediately respond to a request for comment on the salary data.
Deloitte delayed many of its full-time hires' start
dates, shortened internship programs for students, and laid off 5,000
US workers and 200
people in Canada in response to the
coronavirus pandemic.
Here are the salary ranges for consulting and
accounting roles:
-
Analyst: $58,261
to $116,500 (includes analysts specialized in business, human capital,
project delivery, and solutions)
-
Consultant:
$91,000 to $122,100
-
Senior consultant: $81,167
to $118,384
-
Manager: $107,640
to $160,480
-
Senior manager: $187,253
-
Consulting managing
director: $191,300
-
Audit and assurance
assistant: $58,822
-
Tax consultant: $47,570
to $55,195
-
Tax senior
manager: $124,909
Continued in article
Jensen Comment
Averages almost always are misleading without knowing standard deviations and
skewness. The most misleading part of this is differences in cost of
living. A $125,000 salary does not go far in San Francisco, London, or anywhere
in Switzerland. It goes quite a ways in Des Moines, San Antonio, and
Tallahassee.
My advice to my graduate students about to go to work full time was to almost
ignore starting salaries and look at the more important aspects of the first
job, including training, type of experiences, direct contact with clients, etc.
Especially important was and still is the type of training and experience. One
of my best graduating students in the specialty of accounting for financial
derivatives and hedging activities went with the Big Four that promised to let
him work mostly for a client in Houston having billions or dollars in derivative
contracts. In short time that student became a genuine expert on FAS 133 and
IFRS 39 to a point that in about six years he took on a new job as a financial
executive with Microsoft. Guess why Microsoft needed him?
One of my students who spoke Russian went with a firm that would send him to
Moscow. By doing so he was offered a partnership in a Big Four firm in what I
consider to almost be record time relative to his classmates that went with the
Big Four in the USA.
Sometimes my students complained that auditing and tax graduates are offered
less from the large accounting firms relative new graduates in engineering. I
consoled them by saying that accounting can often be a faster track to the
executive suite, especially the executive suite in finance and accounting.
Corporations often hire very few, if any, new (entry-level) graduates in
accounting. But they make very good deals with accountants who have become
specialized (think derivatives accounting, insurance accounting, lease
accounting, SEC accounting, etc.) after a few years of working for large
accounting firms.
There's also another aspect of high paying jobs to consider. Consultants in
the Big Four often start at higher salaries, but they are constantly living
under pressures to obtain new clients. Audit and tax clients, on the other hand,
tend to be the same clients year after year. For example, KPMG audited GE for
over 100 years before finally losing GE as an audit client. In comparison, KPMG
consultants had to keep competing for new consulting contracts year after year.
It can be very tedious writing consulting proposals year after year after year.
Another thing to contemplate when offered what seems like a huge starting
salary. The thing to ask is how much of that salary is based upon commissions
that create a lot of tensions on the job, especially when there is stiff
competition coming from other consulting firms writing proposals.
**How to Mislead With
Statistics
Research: Women Are Better
Leaders During a Crisis ---
https://hbr.org/2020/12/research-women-are-better-leaders-during-a-crisis?utm_medium=email&utm_source=newsletter_weekly&utm_campaign=weeklyhotlist_not_activesubs&deliveryName=DM113092
Jensen Comment
Firstly, I wonder if this study would have been published by Harvard if the data
revealed men are better leaders in a crisis. In this era I doubt it.
Irrespective of how the survey
data turned out, I don't like comparing opinion poll averages of gender
differences in leadership "during a crisis." Crises are highly specific events
in specific circumstances. They vary from such extremes as a local crisis (think
of someone passing out in a presidential cabinet meeting) to very global crisis
(think of missiles sinking of a USA aircraft carrier in the China Sea or Persian
Gulf). I think gender differences are negligible compared with a person's unique
history, training, experience, personality, data understanding, etc. in a
particular crisis at a particular time.
We're not dealing with fungible items in stationary processes with most types of
"crises."
The study is not restricted to
a particular types of crises such as when pilots experience engine failures in
fighter aircraft. The study refers to any type of crisis, and I think the survey
outcomes are garbage with respect to leadership in every type of crisis in every
type of circumstance. There are instances where a particular leader, man or
woman, can step up to the plate like a rather lousy leader in many respects
named Winston Churchill stepped forward marvelously when Hitler was on the verge
of taking over all of Europe.
Of course there are types of
crises were gender might be an important element of leadership, but there are
certainly many other types of crises where gender is probably irrelevant among
all the most important factors affecting great leadership at the moment.
**How to Mislead With Statistics
California's Energy
Regulations Hurt the Poor, While 'Green' Subsidies Benefit the Rich ---
https://reason.com/2020/07/10/californias-energy-regulations-hurt-the-poor-while-subsidies-benefit-the-rich/
Jensen Comment
This is a classic problem of short-term versus long-term benefits.
The real issue is whether subsidies to wealthy corporations and wealthy
universities might greatly benefit all earthlings (rich and poor) in the
long-run. For example, R&D supplements to Big Oil may help those companies find
and develop low-carbon energy solutions that are much more important to the
planet than solar panels on housing for the rich and poor owners.
And it's not just R&D. Big Oil companies are already investing heavily in
alternative energies (think windmill farms) --- possibly more than the public
sector is investing in such alternatives. Subsidies to Big Oil might hasten
their replacement of carbon-based energies.
**How to Mislead With
Statistics
Post-tenure Law Professors in
the USA ---
http://www.americanbarfoundation.org/uploads/cms/documents/after_tenure_report-_final-_abf_4.1.pdf
MIND THE GAP: GENDER PAY
DISPARITIES IN THE LEGAL ACADEMY
https://privpapers.ssrn.com/sol3/papers.cfm?abstract_id=3699208&download=yes
A
wealth of research has demonstrated that the gender wage gap in the legal
profession is both pervasive and persistent. Our investigation of a rich and
unique dataset of tenured law professors reveals gender stratification in
the legal academy, clearly demonstrated by our finding that tenured women
law professors—and especially women of color—receive lower compensation than
their male colleagues. We find evidence that women law professors are very
likely to earn lower salaries and additional income than men, even when they
both enjoy the same protection of tenure. 126 Moreover, we find that
gendered earnings disparities are experienced more acutely by women of
color. In addition to documenting that gendered earnings disparities exist,
it is important to examine the mechanisms that underly these persistent
forms of gender—and racialized—inequality. 127 Our findings demonstrate the
salience of human capital and social capital in mediating the relationship
between gender and earnings in the legal academy.
Jensen Comment
Firstly, the fact that the American Statistical Association now tends to
discourage rather then encourage p-value analysis of statistical inference data
is never mentioned by the authors as they continue to rely on somewhat dubious
p-values
Time to say goodbye to “statistically significant” and
embrace uncertainty, say statisticians ---
https://retractionwatch.com/2019/03/21/time-to-say-goodbye-to-statistically-significant-and-embrace-uncertainty-say-statisticians/
Three years ago, the American Statistical Association (ASA) expressed
hope that the world would move to a “post-p-value
era.”
The statement in which they made that recommendation has been cited more
than 1,700 times, and apparently, the organization has decided that
era’s time has come. (At least one journal had already banned
p values by 2016.)
In an editorial in
a special
issue of
The American Statistician out today, “Statistical Inference in the 21st
Century: A World Beyond P<0.05,” the executive director of the ASA, Ron
Wasserstein, along with two co-authors, recommends that when it comes to
the term “statistically significant,” “don’t say it and don’t use it.”
(More than 800 researchers signed onto a piece
published in Nature yesterday calling
for the same thing.) We asked Wasserstein’s co-author, Nicole
Lazar of the University of Georgia,
to answer a few questions about the move.
So the ASA
wants to say goodbye to “statistically significant.” Why, and why now?
In the past few
years there has been a growing recognition in the scientific and
statistical communities that the standard ways of performing inference
are not serving us well. This manifests itself in, for instance, the
perceived crisis in science (of reproducibility, of credibility);
increased publicity surrounding bad practices such as
p-hacking (manipulating the data until statistical significance can be
achieved); and perverse incentives especially in the academy that
encourage “sexy” headline-grabbing results that may not have much
substance in the long run. None of this is necessarily new, and indeed
there are conversations in the statistics (and other) literature going
back decades calling to abandon the language of statistical
significance. The tone now is different, perhaps because of the more
pervasive sense that what we’ve always done isn’t working, and so the
time seemed opportune to renew the call.
Much of the
editorial is an impassioned plea to embrace uncertainty. Can you
explain?
The world is
inherently an uncertain place. Our models of how it works — whether
formal or informal, explicit or implicit — are often only crude
approximations of reality. Likewise, our data about the world are
subject to both random and systematic errors, even when collected with
great care. So, our estimates are often highly uncertain; indeed, the
p-value itself is uncertain. The bright-line thinking that is emblematic
of declaring some results “statistically significant” (p<0.05) and
others “not statistically significant” (p>0.05) obscures that
uncertainty, and leads us to believe that our findings are on more solid
ground than they actually are. We think that the time has come to fully
acknowledge these facts and to adjust our statistical thinking
accordingly.
Continued in article
Secondly, in a survey sample of
1,210 tenured law professors, 378 are people of color. Among those 378, roughly
100 are Women of Color that includes African Americans, Asians, Hispanics, etc.
In comparison there are 278 Males of Color.
Keeping in mind that there are
over 4,500 tenured law professors in the USA, most any inferences from a
non-random sample of 1,210 respondents must be suspect. For example, are
disgruntled respondents more apt to have completed this survey? There's
some evidence of a higher response rate among Women of Color than among White
Men ---
http://www.americanbarfoundation.org/uploads/cms/documents/after_tenure_report-_final-_abf_4.1.pdf
The reason may be that Women of Color are more disgruntled among tenured law
faculty.
Table 14 is a key table
featured in the conclusions of this study. The focus is mainly on the average
salary differences between Women of Color and the other average salary groupings
in the study. The study does not devote much attention to the outcome where Men
of Color have very nearly the same average salary as White Men. This should be
more praiseworthy than is given by the authors in the study. Instead the focus
of this study is on how Women of Color and White Women have a lower average
salary differences than both Men of Color and White Men. This finding supports
other studies in law schools showing women faculty are paid less on average.
This has been the basis of a number of lawsuits against lawsuits, some of which
have been successful for the women who sued.
The authors in the study do not
focus on the implications that average salary standard error measures for both
Women of Color and Men of Color are much higher than for White Men and White
Women? What do these larger standard errors imply?
For me, higher standard errors suggest that outliers may be having more impact
on both Women and Men of Color.
This is one of those studies
where I tend to agree with the conclusions even though those conclusions are
supported by some rather doubtful statistical inference mumbo jumbo.
What is more disturbing to me
is that women are less likely to reach the top in our largest and most
prestigious law firms.
"Why Do So Few Women Reach the Top of Big Law
Firms?" by Timothy L. O'Brien, The New York
Times, March 19, 2006 --- http://www.nytimes.com/2006/03/19/business/yourmoney/19law.html
Although the nation's law
schools for years have been graduating classes that are almost evenly split
between men and women, and although firms are absorbing new associates in
numbers that largely reflect that balance, something unusual happens to most
women after they begin to climb into the upper tiers of law firms. They
disappear.
According to the National
Association for Law Placement, a trade group that provides career counseling
to lawyers and law students, only about 17 percent of the partners at major
law firms nationwide were women in 2005, a figure that has risen only
slightly since 1995, when about 13 percent of partners were women.
Even those who have made
it to the top of their profession say that the data shows that women's legal
careers involve distinct, often insurmountable hurdles and that those
hurdles remain misunderstood or underexamined.
"You have a given
population of people who were significantly motivated to go through law
school with a certain career goal in mind," says Ms. Plevan, who notes that
Proskauer has always provided her with a welcoming professional home. "What
de-motivates them to want to continue working in the law?"
FOR years, one pat
response to that question was that once law school graduation rates
substantially equalized between men and women, that pipeline would fuel firm
diversity and cause partnerships to equalize as well. Yet the pipeline has
been gushing for about two decades and partnership disparity remains.
Although women certainly
leave firms to become more actively involved in child-rearing, recent
detailed studies indicate that female lawyers often feel pushed into that
choice and would prefer to maintain their careers and a family if a
structure existed that allowed them to do so. Some analysts and many women
who practice law say that having children isn't the primary reason most
women leave law firms anyhow; most, they say, depart for other careers or
for different ways to practice law.
"Firms want women to
stay. Men at the firms want women to stay, and women want to stay. So why
aren't they?" asks Karen M. Lockwood, a partner at Howrey in Washington.
"Law firms are way beyond discrimination — this is about advancement and
retention. Problems
with advancement and retention are grounded in biases, not discrimination."
With law firms courting
major corporations that demand diversity within the ranks of those advising
them, and with women increasingly dominating the top tiers of law school
graduates, veteran lawyers say that promoting women's legal careers is not
just a matter of goodwill or high-mindedness. It's also a winning business
strategy.
. . .
Research conducted by the
Project for Attorney Retention, a program sponsored by the University of
California's Hastings College of the Law, has also identified an inflexible,
billable-hours regime as an obstacle to job satisfaction for both sexes, a
trend that is more pronounced among the most recent crop of law school
graduates. Some veteran lawyers witness this dissatisfaction firsthand and
say that it tugs more powerfully at women than men because of social
expectations about household roles and child-rearing.
We are very accommodating
with leaves and flexible schedules, and even with that we still lose women,"
says Edith R. Matthai, who founded a Los Angeles law firm, Robie & Matthai,
with her husband in 1987. "I think the pressures on women from spouses,
family, peers, schools and others is huge.
"I think the real
solution is a reassessment of the role that women play in the family," adds
Ms. Matthai, who is president of the Los Angeles County Bar Association.
"One thing we need is a sense of shared responsibilities for the household
and, most importantly, shared responsibilities for taking care of the kids."
Ms. Matthai said that
conditions for women had improved a good deal over the last 30 years, but
added: "We have a long way to go. It's my dream that more women will stick
it out in the law until they get to the fun part, and it just breaks my
heart to see them giving up the dream."
Research conducted by the
New York City Bar Association and other groups indicate that women who
temporarely give up their professional dreams to pursue child-rearing or
other personal goals have a difficult, if not impossible, time finding
easily available on-ramps when they choose to re-enter the legal world.
Continued in article
**How to Mislead With Statistics
New York Is Having a Violent Summer, But It's Not Because of Bail Reform ---
https://reason.com/2020/07/09/new-york-is-having-a-violent-summer-but-its-not-because-of-bail-reform/
Jensen Comment
This article is misleading because it fails to mention the effect of bail reform
on lesser crimes, particularly shoplifting. To the extent that bail reform
essentially legalizes shoplifting it can do great harm to areas where
shoplifting is heaviest. For example, in the poor parts of Los Angeles, Chicago,
St. Louis, and Baltimore having no punishments for shoplifters means that stores
in those poor parts will close up giving less shopping alternatives (think
grocery stores, pharmacies, Walmarts, Targets, etc.) to the poorest residents of
the cities.
If you want more stores in the ghettos
you have to prevent shoplifting in most every way possible, including punishing
the shoplifters.
**How to Mislead With
Statistics
The average cost of car
insurance in the US ---
https://www.businessinsider.com/personal-finance/average-cost-of-car-insurance
Jensen Comment
The article initially warns of some misleading things about the averages listed
for states. Much depends upon age and driving records. Also much depends upon
package deals where home owner's insurance, personal liability insurance, and
auto insurance are bundled into one deal.
Also much depends upon such
things as deductible choices (having a high deductible usually saves a lot of
money) and "only paying for what you need" such as choosing to forego collision
and theft insurance on older vehicles. Risk of car theft varies greatly by state
such as Texas versus Vermont.
**How to Mislead With
Statistics
The Hard Truth Of Poker —
And Life: You’re Never ‘Due’ For Good Cards ---
https://fivethirtyeight.com/features/the-hard-truth-of-poker-and-life-youre-never-due-for-good-cards/
Jensen Comment
Never Say Never
Much depends upon whether you're talking about the next play (flip, hand, roll,
game) in a succession of plays. Consider the flipping of a fair coin in which
you always bet on "heads." You're never due for a head on any given flip. The
probability head is always 50% as long as the coin is fair. However, probability
of not getting a single head in a million flips is virtually (asymptotically)
zero. This is why casinos will never allow you to keep doubling your bet with
each successive play for an unlimited number of plays of any casino game. In
other words casino owners are well aware of the St. Petersburg Paradox.
St. Pertersburg Paradox ---
https://en.wikipedia.org/wiki/St._Petersburg_paradox#The_paradox
Thus the odds of not getting a
head on the first coin flip is 1/2. But the odds of not getting a head in the
first two flips is 1/4=(1/2)(1/2). The odds of not getting a head in the first
three flips is 1/8 etc.
Thus to claim you are "not due"
for a head on any single flip is correct. But to say your are "not due" for the
first head in a succession of flips is not mathematically correct. The
probability of getting the first head in a succession of flips keeps increasing
toward a 100% probability.
Of course with poker this
becomes more complicated since there are so many more outcomes or each hand that
is dealt and strategy comes into play. In penny ante poker that strategy does
not usually entail bluffing. But in high stakes poker bluffing also becomes a
major part of the play and messes up mathematical probabilities a great deal.
This is why most poker games
have constraints.
One constraint is a betting limit for each hand played.
Another constraint is usually a preset quitting time, especially in penny ante
poker.
In penny ante poker who wins the most in a night usually depends greatly upon
that preset quitting time when betting limits are in place and bluffing is a
hopeless strategy.
And if your strategy is to
frequently call bluffs of a given player in the game of higher stakes poker you
are increasingly due to win a hand since the probability of a bluffer always
having the winning hand become successively very low as the night goes on. That
of course does not mean that you are more likely to be a winner for the night.
**How to Mislead With Statistics
Does having more police lead to a lower crime rate? ---
https://www.data-z.org/news/detail/does-having-more-police-lead-to-a-lower-crime-rate
Dr. Fauci: ‘You Can’t Rely On The Models,’ Too Many Variables ---
https://www.dailywire.com/news/fauci-you-cant-rely-on-the-models-too-many-variables
Jensen Comment
Missing variables are often overlooked problems by social science, finance, and
accounting researchers. Not only are there too many missing variables, but some
of those variables are ignored because they can't be reliably quantified and/or
are not in purchased databases that "lazy" researchers prefer to use rather than
gather their own data. Models don't deal well with qualitative variables. In
accountancy these variables are called intangibles and are often ignored by
model builders.
An even bigger problem is the assumption of stationary that does not apply to
a non-stationary world. This is especially a problem in a pandemic.
Academic researchers keep using defective models if they can get them tenure
and promotions with the help of journal referees who belong to the same clubs.
**How to Mislead With
Statistics
The Cost of
Variance Around a Mean of Statistically Discriminating Beliefs ---
https://blog.supplysideliberal.com/post/2020/8/27/the-cost-of-variance-around-a-mean-of-statistically-discriminating-beliefs
**How to Mislead With Quotations
College is "not for learning" and "basically
for fun."
Elon Musk
Elon Musk said a college degree isn't required for a job at Tesla —
and Apple, Google, and Netflix don't require employees to have 4-year degrees
either ---
https://www.businessinsider.com/top-companies-are-hiring-more-candidates-without-a-4-year-degree-2019-4?utm_source=Sailthru&utm_medium=email&utm_content=BIPrime_select&utm_campaign=BI%20Prime%202020-03-11&utm_term=BI%20Prime%20Select
Jensen Comment
But what proportion of
professional employees (computer scientists, engineers, accountants, lawyers,
nurses, financial analysts, etc.) have college degrees?
My guess is over
99%.
Some professionals must have college degrees (maybe even advanced
degrees just to be licensed). For example CPAs and lawyers cannot be licensed
without advanced degrees.
Prodigies hired without college degrees are few
and far between, although there are interesting stories about Harvey Firestone,
Bill Gates, and others who became wealthy CEOs without diplomas on the wall. You
don't have to have a diploma to lead a company, but that company is not going to
hire a notable proportion of professionals without college diplomas.
I hate it when Elon Musk encourages students to
party it up in college rather than make the primary goals learning and completion
of one or more degree programs.
**How to Mislead With Statistics
How Germany is managing its coronavirus epidemic, and reacting with
disdain to Trump’s policies ---
https://theconversation.com/how-germany-is-managing-its-coronavirus-epidemic-and-reacting-with-disdain-to-trumps-policies-134758
The solid and publicly funded German health system
is also credited for Germany’s relatively low death rate. There are over
28,000 intensive care beds with sufficient respirators available at German
hospitals, more than in most other parts of the world.
Jensen Comment
The author of the above article makes no note that it's almost impossible to
compare Germany (with 83 million people crowded into a land mass less than half
the size of Texas)
with the USA (with over 350 million residents spread over vast square miles of
sparsely populated land as well as being concentrated in some cities). The
author of the above article would not dare mention that the USA has over 34.7
critical care beds
per 100,000 capita
compared with Germany's 29.2 critical care beds. That author would not dare
mention that the USA has more new drug patents than the rest of the world each
year ---
https://sccm.org/Blog/March-2020/United-States-Resource-Availability-for-COVID-19
The world is more eagerly awaiting a new vaccine from the USA than it is waiting
for one from Germany.
The huge problem with comparing the USA health care with that of Germany is that
the patients in the USA are spread over such a vast territory compared to
Germany. The Coronavirus case has hit some parts of the USA (think the areas
around NYC and Seattle) very hard relative to vast system of thousands rural
communities that have zero or less than a handful of Coronavirus cases. There
are a lot of supplies (think masks, gowns, and ventilators) in the USA stored
unused in USA hospitals that have never seen a Coronavirus case (we have a son
who works in one of these hospitals in Maine). But it would be unwise for these
rural hospitals to strip their supplies when there are risks of sudden outbreaks
anywhere in the USA.
Since Germany has a national health care plan progressives
think think that these "free" health care services must be vastly superior to
the USA's health care coverage. The fact of the matter is that Germany's free
plan is quite basic and relatively inferior to the free plans in other parts of
Europe. The Germans that can afford it pay for private medical insurance to get
better health care coverage.
Health Insurance in Germany --- http://www.toytowngermany.com/wiki/Health_insurance
I think the USA should consider the German insurance plan.
Germany does have some economic advantages over the USA. Since it has much
less National Debt/GDP relative to the USA it's much
easier for the Germans to borrow in order to finance a huge economic stimulus
package relative the USA that will probably have to rely on printing money for
the first stage of a stimulus package ---
https://worldpopulationreview.com/countries/countries-by-national-debt/
A problem for the EU right now is that this pandemic further threatens to
break up the EU since the more prosperous European nations are weary of
supporting their poor neighbors.
**How to mislead with statistics
Here's how much flight attendants in 10 airlines say they make ---
https://www.businessinsider.com/how-much-flight-attendants-make-in-major-airlines-2019-5
Jensen Comment
You cannot compare all hourly wages workers without being misleading in terms of
what what extra hours it takes to get hours that pay. For example, an hourly
factory worker typically gets eight hours of pay for each working day, but there
are no extra unpaid hours required as long as you do not count commuting time
that varies with choices of where to live outside of work. Flight attendants, on
the other hand, often put in extra hours for which they are not paid such as
when a flight attendant puts in ten hours on a flight to London and then has to
wait 14 hours for a return flight for pay. Sure there's discretionary personal
time in the 14 extra hours, but it's not the same discretionary time as time at
home with family. And then there are the days of not being paid while waiting
for an opportunity to catch a paying flight. A flight attendant supposedly
making $35 per hour may in reality be making less per week than an hourly worker
having steady work eight hours per day at least five days per week every week.
Gig workers paid by the job can have even more misleading "hourly wages." An
adjunct professor earning $4,500 for teaching a course that meets for 45 hours
per term is seemingly is getting $100 per hour. But when you add in the time it
takes to prepare a course, grade papers and exams, and communicate (think office
hours and email) with students outside of class the pay rate is probably much
less than $100 per hour. And then there are the unpaid days between classes and
between terms.
It's very hard to compare compensation for different lines of work. You can
compare annual wages on W-2 tax forms, but that form does not compare the
differences in working time versus discretionary time. A teacher may report
$65,000 to the IRS while an accountant may also report $65,000 to the IRS. But
the accountant may put in 40 hours per week for 50 weeks of the the year. The
teacher has several months of free time for summers, holidays, term breaks, etc.
My point here is that it's very difficult to compare compensation levels for
differing careers. For example, when I was a college student it seemed like my
professors were "working" less than 15 hours per week. However, these professors
were also responsible for working hours that I never observed such as study and
research time, service time on campus, service time off campus, etc. When I
became a professor I was often working more than 60 hours per week and was
unable to find the time I wanted for my family.
**How to Mislead With
Statistics
Research Finds that High
School GPAs Are Stronger Predictors of College Graduation than ACT Scores
---
https://www.aera.net/Newsroom/Research-Finds-that-High-School-GPAs-Are-Stronger-Predictors-of-College-Graduation-than-ACT-Scores
Jensen Comment
This study is all well and good about what it sets out to do. What's misleading
is the implication that ACT scores do not have predictive values. ACT scores
have predictive values above and beyond high school grades when predicting
college grades. High school grades are not very good at predicting high school
grades because of grade inflation in most USA high schools. If most applicants
to a prestigious universities have nearly perfect grade averages, how can those
universities sort out which applicants will perform better in college than other
applicants who will also likely graduate from college?
When the problem is to predict
college gpa, standardized admission tests have value cutting through grade
inflation and fine tuning among a set of applicants all having high grades from
high school.---
http://www.act.org/content/dam/act/unsecured/documents/5931-research-report-2016-7-examining-the-validity-of-act-composite-score-and-hs-gpa.pdf
Of course there are other
useful college performance predictors other than high school grades and
standardized test scores. For example, other predictors might find promise among
some students who have both poor grades and low ACT scores such as students who,
with remedial education and maturity, become shining stars.
**How to Mislead With Statistics
Freedom from Fossil Fuels is Good for Your Health ---
https://www.nakedcapitalism.com/2020/02/freedom-from-fossil-fuels-is-good-for-your-health.html
Jensen Comment
This is a very superficial article that mentions many of the benefits of a world
without fossil fuels. It totally ignores the costs and risks. For example, is
starvation good for health? We don't really know how loss of fossil fuels (think
farm machinery) and petrochemicals will affect food production for over seven
billion people worldwide, but there are a huge degrees of agricultural
productivities and efficiencies that might be adversely affected by abrupt shut
down of fossil fuels. Then there's the global distribution of food that
currently relies upon fossil fuels from cargo ships to fleets of trucks between
farms and markets around the world.
Certainly there are positives about eliminating fossil fuels from heating our
homes, cooling our homes, and transporting us to jobs and other places we want
to travel. But are there no negatives in the alternatives to replacing fossil
fuels? For example, there are tremendous environmental problems with all the
battery production needed to accompany solar and wind electricity production.
Petrochemicals are now essential in the production of vital medicines.
Realistically, nuclear energy is about the only known solution to the massive
shortage of power lost with the elimination of fossil fuels. Nuclear energy is
getting safer and more economically feasible, but the cost for seven billion
people on earth will still be tremendous and require great economic sacrifices
on nations trying to do without fossil fuels.
Certainly one day in the future fossil fuels will no longer be necessary (or
even available) for any life that remains on earth. However, articles on ending
reliance upon fossil fuels must consider the advantages and disadvantages of
living without fossil fuels and why it will take so long to do so ---
https://www.bartleby.com/topics/Essay-on-Fossil-Fuels
Certainly our politicians are not doing us big favors by ignoring (think
Trump) the carbonization problem or by making decarbonization political
promises that are absurd.
MIT: Pete Buttigieg’s $2 trillion climate plan is
infeasible, but less so than most ---
https://www.technologyreview.com/s/615265/pete-buttigieg-2-trillion-climate-plan-is-infeasible-but-less-so-than-most/
MIT on Promises That are Literally Impossible to Keep: Elizabeth Warren
has a ($3 trillion) climate change plan ---
https://www.technologyreview.com/s/615212/climate-change-elizabeth-warren-has-a-3-trillion-plan-for-that/
Much depends upon future research discoveries that are hard to predict in terms
of types and timing (think flow batteries) ---
https://www.computerworld.com/article/2918235/can-elon-musks-battery-really-cut-your-power-lines.html
Petrochemicals ---
https://en.wikipedia.org/wiki/Petrochemical
Examples of Petrochemicals and Petroleum Products (think medicines and food)
---
https://www.thoughtco.com/petrochemicals-and-petroleum-products-603558
Chronicle of Higher Education
Data-Visualization And Student Evaluations: Male Profs Are Brilliant And
Funny; Female Profs Are Mean And Rude ---
https://taxprof.typepad.com/taxprof_blog/2019/11/data-visualization-and-student-evaluations-male-profs-are-brilliant-and-funny-female-profs-are-mean-.html
Jensen Comment
These and other conclusions are reached after an analysis of millions of course
evaluations on RateMyProfessors.com. Keep in mind that course evaluations are
self selecting on RMP and accordingly do not meet the criteria for statistical
analysis. However, the volume of such samples makes them somewhat informative. I
always ignore the numbers and read the subjective comments for insights.
The above study looks at various other aspects of courses other than teacher
genders.
Given my own rather extensive experiences reading RMP course evaluations I find
it's a mistake to think that most of the responders are disgruntled students.
Although there are clearly a lot of disgruntled students, it seems to me that
most evaluations are positive rather than negative --- possibly
meaning that teachers who suspect they will get positive
evaluations may prompt students to submit evaluations to RMP. I doubt that any
teacher who anticipates negative submissions ever mentions RMP. This
biases the millions of RMP submissions to be more positive than negative.
I was glad to see that RMP dropped its "Red Hot Chili Pepper" competition
that attempted to identify the most popular college teachers in the USA with
pictures of red hot peppers. This encouraged popular teachers to promote their
students to send in RMP evaluations.
The bottom line is that the numerical evaluations don't mean much on RMP due
to self-selecting samples. However, I find that the subjective comments do
provide some information about course difficulty, teaching style, and course
rigor.
In general I'm against making student evaluations of any kind a factor in
promotion and tenure and performance evaluations by college administrators. The
reason is that these evaluations are one of the primary causes of disgraceful
grade inflation ---
http://faculty.trinity.edu/rjensen/assess.htm#RateMyProfessor
Statement Against Student Evaluations for Promotion and Tenure Decisions
(American Sociological Association) ---
https://www.asanet.org/sites/default/files/asa_statement_on_student_evaluations_of_teaching_sept52019.pdf
**How to Mislead With
Statistics
Study: Grades Are 5 Times
Stronger Than ACT Scores ---
https://www.insidehighered.com/quicktakes/2020/01/29/study-grades-are-5-times-stronger-act-scores?utm_source=Inside+Higher+Ed&utm_campaign=663a7e06a4-DNU_2019_COPY_02&utm_medium=email&utm_term=0_1fcbc04421-663a7e06a4-197565045&mc_cid=663a7e06a4&mc_eid=1e78f7c952
Jensen Comment
I question how much this can be extrapolated beyond Chicagopublic schools. The
sample is based only on Chicago public schools. It's doubtful whether most any
study of one school system can be extrapolated to other schools systems without
serious risks.
There is also a criterion
problem here. The performance criterion of college grade gpa is itself gradually
becoming more and more meaningless as the median college graduate gpa has become
A- and is being lifted for other students from C to B, D to C, etc. ---
http://faculty.trinity.edu/rjensen/assess.htm#RateMyProfessor
The Atlantic: Has College Gotten Too Easy? Time spent studying is down,
but GPAs are up ---
https://www.theatlantic.com/education/archive/2019/07/has-college-gotten-easier/594550/
Grades are perhaps better than
standardized test scores in measuring motivation. However, grades are gradually
becoming less reliable due to grade inflation in both colleges and K-12 schools
across the USA. A C grade is no longer an average grade. The median grade among
students who graduate is more apt to be A- or B+. If half the graduating
students have A or A- grades, how do you differentiate between them. Put another
way, if virtually all applicants to a flagship state university have B or higher
grade averages and more than half have A averages how do admissions officials
differentiate between such high grade average applicants?
Grades are probably the least
predictive among students who do not even apply for college. There's a trend for
high schools to give diplomas to some students who can barely read and cannot do
simple arithmetic. ACT and SAT scores will in most instances be very predictive
of the college performance of those students (especially those who do poorly in
remedial programs)
And remember that Albert
Einstein had poor grades. High SAT/ACT test scores sometimes give second chances
to students with poor grades. In particular boys mature on average much slower
than girls. Bad grade averages often reflect lateness in maturing. This is why
colleges that no longer require ACT or SAT scores still allow them to be
submitted on application forms.
Grades become more predictive
among students who apply to flagship state universities or Ivy League schools.
But those universities may be flooded with more A-average applicants than they
can possibly admits. There are no simple answers when comparing grades and the
ACT/SAT. The analysis is complicated especially along the spectrum of ability,
motivation, and grade inflation. The analysis is also complicated by subject
matter, For example, grades in mathematics and science may be less predictive
than grades in other subjects ---
https://www.latimes.com/california/story/2019-12-22/grades-vs-sat-scores-which-is-a-better-predictor-of-college-success
. . .
If UC drops the SAT
and ACT in favor of giving grades greater weight, systemwide graduation
rates are likely to drop. But the benefits will be substantial to students
who otherwise might not have qualified for UC admission because of low test
scores, said Zachary Bleemer, a
research associate at UC Berkeley’s Center for Studies in Higher Education.
His analysis last
year looked at the academic records of about 8,000 UC students who enrolled
under a program that guaranteed admission to the top 4% of each high
school’s graduating class between 2001 and 2011, but whose average SAT
scores were nearly 300 points below their peers at the UC campuses they
attended.
Their five-year
graduation rate was 77% compared with an average 83% among UC peers. But it
was substantially higher than it would have been if they had attended a Cal
State or community college campus, his analysis found. The UC students also
earned nearly $15,000 more annually six to eight years after enrolling.
The findings
suggest that students with high grades but lower test scores can thrive at
UC schools and counter the “mismatch hypothesis” that less competitive
students are better off at less selective universities, Bleemer said.
For university
officials who must weigh the complexities of the criteria in their
admissions decisions, there are no easy answers.
Emily Engelschall,
UC Riverside director of undergraduate admissions, says she sees the
shortcomings of standardized testing but that the scores do help evaluate
grades across vastly different high schools. She also worries that dropping
the testing requirement could exacerbate grade inflation.
“If you don’t have
some sort of standardized tests to balance out grade inflation,” she said,
“then that does take one piece of the puzzle away from an admissions
professional to help make a decision about a student.”
Jessica
Howell, the College Board’s vice president of research, has
said that a greater reliance on high school grades in the name of equity
would be “misguided” because grade inflation is associated with wealth.
The College Board
points to a 2018
study of North Carolina public school students in grades eight through
10 between 2005 and 2016. The study found that median GPAs rose across the
board over time, but did so more in affluent schools than in low-income
ones.
The study also raised
questions about the reliability of grades in measuring mastery of content.
It found that only 21% of students who received A’s in algebra I achieved
the highest proficiency level in end-of-course exams and 57% of those who
received Bs failed to score marks indicating college and career readiness.
“The latest research
is resoundingly clear,” Howell said in a statement.
“Grade
inflation is a serious problem, particularly in high schools that serve more
affluent communities.”
Jensen Comment
Since Chicago public schools tend not to "serve more affluent communities" and
are mostly minority students studies on only Chicago's high school graduates are
difficult to extrapolate to the USA in general.
It's important to realize that
the SAT and ACT probably would've been dropped years ago if they'd not had some
value as predictors above and beyond other predictors, although even SAT and ACT
authorities tell us that
standardized test scores are best used in combination with other predictors like
grades.
Comparing SAT and ACT
Scores—Official New Concordance
https://www.compassprep.com/concordance-and-conversion-sat-and-act-scores/
**How to
Mislead With Statistics
A
relatively small increase in the minimum wage significantly reduced the
occurrence of suicide amongst low-income people
---
https://qz.com/1785050/the-link-between-minimum-wage-and-suicide-shows-inequality-is-a-public-health-issue/
Jensen
Comment
The problem in this study is that it invites
extrapolations that are unwarranted. For example, if a $1 per hour
increase in the minimum wage results in a small number of suicides then larger
minimum wage increases will lead to even larger reductions in suicide rates. The
reason for concern is that small increases in the minimum wage will not destroy
many jobs, but large increases in the minimum wage can be job destroyers where
becoming unemployed entirely invites more suicides. ---
https://www.vox.com/2019/7/8/20686392/federal-15-minimum-wage-raise-the-wage-act
A
University of Washington study that the Mayor of Seattle did not want disclosed
found that the jump to a minimum wage of $15 in Seattle did cause a serious
number of closures of small businesses.
In other
instances not studied people thrown out of work become exploited by employers in
the underground economy who do not offer benefits like medical insurance,
unemployment compensation, etc. For example, a landscaping company forced to pay
$15 per hour plus benefits may shift to picking up day laborers on the streets
for a lower wage and no benefits,
The above
study did not focus on suicide can be caused by job losses.
And those who do not lose their jobs often take home less income with higher
minimum wage. For example, some restaurant workers in Seattle discovered that
customers tip a lot less when menu prices jump to cover minimum wages. Some food
servers complain that they're getting less take home pay on a higher wage.
The issue
of minimum wage is very complicated when comparing urban versus rural workers.
Job losses in big cities are likely to be less problematic when minimum wages
are increased versus job losses in rural areas where small businesses are barely
hanging on even in good times. Where I live in New Hampshire's White Mountains
there are many B&B Inns that are hanging on by a thread even in good times. A
major problem in this industry is that revenues are often very seasonal making
it hard to maintain staff across the very slow weeks and even months. For
example, most B&Bs up here are either open only in the summer or they try to
scrape by in winter with some skiing and snowmobile tourist revenues being
highly subject to global warming weather. For example, in 2018 we had great snow
before Thanksgiving whereas in 2019 we had to wait until January 2020 for some
decent snow. It's hard to keep employees (think chefs) covered during weeks with
almost no revenue. If New Hampshire should have to double its minimum wage many
people who now have jobs will be thrown out of work. If not thrown out of work
they will take home less money in their new status as
part-time seasonal workers.
**How to Mislead With Statistics
Crescent Dunes Solar Energy Project ---
https://en.wikipedia.org/wiki/Crescent_Dunes_Solar_Energy_Project
Another Failed Extrapolation from Small to Big
--- The feds bet $737 million on a salt
tower for solar power
https://www.wsj.com/articles/the-best-laid-energy-plans-11579219416
Government planning and subsidies will make America the
world’s green-energy superpower, create millions of jobs, and supercharge
the economy—or so we’re told. The reality is closer to Crescent Dunes, a
Nevada solar-energy plant that has gone bust after receiving a $737 million
federal loan guarantee.
An inconvenient truth is that the sun sets each day, but the
Obama Administration’s green planners had an app for that. They decided to
invest in the Crescent Dunes facility that would use molten salt to store
heat from the sun, produce steam, and generate electricity even at night.
The utility NV Energy had already agreed to buy the electricity. Government
support would carry the project to sunny success.
In September 2011, the Energy Department described how the
110-megawatt facility would “be the first of its kind in the United States
and the tallest molten salt tower in the world,” powering more than 43,000
homes a year. The precedent was Solar Two, a small pilot plant
decommissioned in 1999 that had shown it was technically feasible to use
molten salt to store and generate power. But in a 2006 report the Energy
Department said the 10-megawatt facility “was never expected to be a viable
commercial-scale plant and, in fact, did not validate economic feasibility.”
No worries. It’s only taxpayer money, and the feds jumped
into Crescent Dunes anyway. The Department of Energy finalized its loan
guarantee on Sept. 23, 2011, a week before the federal loan program expired.
A month earlier Nevada had approved $119.3 million in tax abatements for
Crescent Dunes over 20 years. The plant also received some $140 million in
private investment.
**How to Mislead With Statistics
The Nobel went to economists who changed how we help the poor. But some
critics oppose their big idea (Randomized Control Trials) ---
https://www.vox.com/future-perfect/2019/12/11/20938915/nobel-prize-economics-banerjee-duflo-kremer-rcts
Scroll down to the major criticisms
**How to Mislead by Avoiding Statistics
The Worst Mistake in the History of the Human Race ---
https://www.discovermagazine.com/planet-earth/the-worst-mistake-in-the-history-of-the-human-race
The above article avoids the obvious thing that's needed --- data in the number
of hunters and gatherers and the amount of food that can be gathered to
sustain each human in the surrounding environment. Agriculture has the obvious
advantage of being able to,in general, to provide for increasing amounts of food
to meet the growth in population and the invention of technologies for
preserving, storing, and trading food. If food became scarce hunters and
gatherers had to relocate to more plentiful environments. If they invented other
means of providing goods and services with trading potential (think
manufacturing) then they could stay in their homes (think cities), export their
produce (think clothing and shoes), and import their food from rural farmers.
The major problem with hunting and gathering and also agriculture is the
Malthusian problem of population explosion ---
https://en.wikipedia.org/wiki/Malthusian_growth_model
Through the animal and vegetable
kingdoms, nature has scattered the seeds of life abroad with the most
profuse and liberal hand. ... The germs of existence contained in this spot
of earth, with ample food, and ample room to expand in, would fill millions
of worlds in the course of a few thousand years. Necessity, that imperious
all pervading law of nature, restrains them within the prescribed bounds.
The race of plants, and the race of animals shrink under this great
restrictive law. And the race of man cannot, by any efforts of reason,
escape from it. Among plants and animals its effects are waste of seed,
sickness, and premature death. Among mankind, misery and vice.
— Thomas
Malthus, 1798.
An Essay on the Principle of Population.
Chapter I
**How to Mislead With Statistics
Is China Actually Stealing American Jobs and Wealth?
by John L. Graham and Benjamin Leffel
Harvard Business Review
https://hbr.org/2019/11/is-china-actually-stealing-american-jobs-and-wealth?utm_medium=email&utm_source=newsletter_monthly&utm_campaign=finance_not_activesubs&referral=00209&deliveryName=DM57237
Jensen Comment
It's hard to believe that the authors can conclude that China is not hurting USA
incomes or jobs without ever mentioning the balance of trade between the two
nations and the so-called "China Shock" ---
https://hbr.org/2019/11/is-china-actually-stealing-american-jobs-and-wealth?utm_medium=email&utm_source=newsletter_monthly&utm_campaign=finance_not_activesubs&referral=00209&deliveryName=DM57237
. . .
Some Democratic
lawmakers, labor groups, and manufacturers also criticize the deficit on the
grounds that some foreign countries—especially
China—have used unfair practices like currency manipulation, wage
suppression, and government subsidies to boost their exports, while blocking
U.S. imports. Some economists argue that
China’s competitiveness stems from its protectionism and state involvement
in the economy, giving its exports an unfair edge and violating global trade
rules. Research by Peterson Institute economists C. Fred Bergsten and Joseph
E. Gagnon blames China’s
“massive and sustained” currency manipulation from 2000 to 2010 for widening
the trade deficit to historic levels.
Though such
aggressive manipulation has eased since then, CFR Senior Fellow Brad Setser,
a former Treasury official, writes that there is still an East
Asian “savings glut,” in
which exceptionally high savings rates in the region, partially due to
government policy, drive large trade surpluses, which must be absorbed by
deficit countries, like the United States.
Meanwhile, the deficit’s concentration in
the manufacturing sector has heightened concerns among some economists over
job losses and their repercussions in local communities. (Of the $891
billion goods deficit, over $650 billion consisted
of [PDF]
manufactured consumer goods and automobile parts.) Research by the Economic
Policy Institute suggests
that the
surge in Chinese imports has lowered wages for non-college-educated workers
and cost the United States 3.4 million jobs from 2001-2015, while research
published by the University of Chicago put
that number [PDF]
at closer to 2 million over a similar period (1999-2011). Many economists
fear that import-related job losses are driving a populist backlash to trade
and globalization that will cause political volatility.
Some economists
worry about the consequences of large and persistent imbalances. The
Peterson Institute’s Gagnon warns that
the debt necessary to finance the deficit is heading toward unsustainable
levels. Former Federal Reserve chairman Ben Bernanke and Jared Bernstein, an
economic advisor to Presidents Bill Clinton and Barack Obama, have
argued that
the large inflows of foreign capital that accompany trade deficits can lead
to financial bubbles and may have contributed to the U.S. housing crash that
began in 2006. Others note that a growing deficit has been associated with a
weak economy, as in the early 2000s, which they say is evidence of the
potential for a large deficit to drain demand from the domestic economy and
slow growth when the economy is performing under its potential.
Continued in article
Jensen Comment
The above article points out that it's possible to put too much emphasis on the
trade deficit when setting trade policy with China. However, Graham and Benjamin
Leffel clearly leave out the unfair trade practices of China in their article,
especially the blocking of imports from the USA to the
detriment of fair trade between the two nations.
This is a political article rather than a scholarly
article.
**How to Mislead With Statistics
How classroom technology is holding students back ---
https://www.technologyreview.com/s/614893/classroom-technology-holding-students-back-edtech-kids-education/
Jensen Comment
I would not object if the title of the article was changed to "holding some
students back." Technology is not for everybody, especially those less able
and/or less motivated to learn. But it is espcially suited to our most motivated
top students. Time and time again the "No Significant Differences" empirical
outcomes show that pedagogy does not matter for our top students --- they excel
in any learning environment ---
http://faculty.trinity.edu/rjensen/assess.htm#AssessmentIssues
Where pedagogy matters most is with students who are not motivated to learn
for whatever reason, including being slow learners. An example is where some
prison inmates are able to learn much better from technology than other prison
inmates. In prisons the students are much less likely to encounter great
teachers than they are in colleges. And yet in prisons some, certainly not all,
of the students excel beyond most college students by using technologies to
learn on their own ---
https://www.inc.com/chris-denson/how-visiting-a-prison-changed-this-investors-life-forever.html?cid=search
I return to my oft repeated example at BYU where the first two accounting
courses are video courses where students mostly learn on their own or in teams.
---
http://faculty.trinity.edu/rjensen/000aaa/thetools.htm#BYUvideo
This pedagogy works at BYU because nearly every accounting student at BYU is
highly motivated to learn accounting. The pedagogy is less successful in
community colleges where there are a greater proportion of low motivated
learners.
Even at BYU video courses would be less successful in advanced accounting
courses where students tend to learn more from their professors and from each
other, especially in case-method Socratic courses.
**How to Mislead With Statistics
11 mind-blowing facts about China's economy ---
https://markets.businessinsider.com/news/stocks/china-economy-facts-2019-5-1028172022#china-imports-more-us-agricultural-products-than-canada-and-mexico1
The article fails to mention the impact of China's terrible record on human
rights affecting millions of poor people, particularly its minority Muslim
population.
The article also fails to mention the enormous economic corruption.
Jensen Comment
The claim that "With a much bigger population, China has fewer poor people than
the US" is misleading because different definitions of "poor" are used. The
World Bank defines being poor in China as living on less than $1.90 per day ---
https://en.wikipedia.org/wiki/Poverty_in_China
The USA has many more safety nets for the poor such as Medicaid coverage of
poor people, including those in nursing homes, as well as much more generous
welfare programs ---
https://en.wikipedia.org/wiki/Welfare
There are wider differences in quality of medical care and education in China
relative to the USA ---
https://en.wikipedia.org/wiki/Poverty_in_China
In fairness, China has done spectacularly in reducing poverty.
But it's far better to be poor in the USA relative to China ---
https://en.wikipedia.org/wiki/Poverty_in_the_United_States
Also poverty is significantly overstated in the USA by failing to factor in the
$2+ trillion underground economy where cash wages of poor people are never
recorded.
**How to Mislead Without Statistics
While the USA West Coast Beats Math Down as Racist
Seattle Schools Propose To Teach That Math Education Is
Racist—Will California Be Far Behind? ---
https://www.hoover.org/research/seattle-schools-propose-teach-math-education-racist-will-california-be-far-behindseattle
Asia Expands its Math Curriculum Down to the Second Grade
Vietnam to Introduce Statistics, Probability in 2nd Grade in New Syllabus ---
https://saigoneer.com/vietnam-news/17753-vietnam-to-introduce-statistics,-probability-in-2nd-grade-in-new-syllabus
SEATTLE PUBLIC SCHOOLS K-12 Math Ethnic Studies Framework (20.08.2019)
https://www.k12.wa.us/sites/default/files/public/socialstudies/pubdocs/Math SDS
ES Framework.pdf
Thank you Zafar Khan for the heads up
Power and oppression, as defined by ethnic studies,
are the ways in which individuals and groups
define mathematical knowledge so as to see “Western” mathematics as the only
legitimate expression of mathematical identity and intelligence.
This definition of legitimacy is then used to disenfranchise people and
communities of color. This erases the historical contributions of people
and communities of color.
Jensen Comment
I find it interesting that Seattle public schools asserts "Western" mathematics
disenfranchises communities of color as if "Eastern" communities of color don't
count. Throughout history "Eastern" mathematics (think India and China) is
probably more rigorous in terms of mathematics than Seattle's so-called
oppressive "Western" mathematics.
My link to how Vietnam is including statistics and probability in the second
grade merely reflects the emphasis "Eastern" communities place upon mathematics
and statistics.
Why do "Ethnic Studies" always blame the West for the disenfranchisement of
"communities of color." This same disenfranchisement of some communities of
color is far grater in "Eastern" communities of color.
The problem with the above Math Ethnic Studies Framework is that the changing
of math studies from how it is taught in the Western hemisphere and Asia
serves to further disenfranchise some communities of color
for being competitive in colleges and careers. All communities of
whites and color should get credit for mathematical contributions in history.
But we should avoid current "Ethnic Studies" form of mathematics that
disenfranchises some color groups from the rigors of mathematics as taught in
both the West and the East.
Nursing Homes ---
https://en.wikipedia.org/wiki/Nursing_home_care
**How to Mislead With Statistics (distortions)
Median prices per month for nursing homes in all 50 states ---
https://www.businessinsider.com/nursing-home-private-room-monthly-median-price-by-state-2019-3#10-delaware-10950-per-month-1
Jensen Comment
Firstly I might note that Medicare does not pay for long-term nursing care
whereas Medicaid does pay for long-term nursing care, and this leads to a
scramble by heirs to drain off parent or grandparent assets five or more years
before those older folks come into need of long-term care. However, Medicaid
caps of monthly care result in most of those "poverty" cases to be put in
low-standard nursing facilities well below the median prices in each state. Also
it's a crap shoot predicting if and when those folks will need long-term care.
Long-term care insurance has always been expensive and is often limited in
terms of what it will pay per month. To add pain to misery the premiums almost
doubled recently because insurance companies were losing so much money on
long-term care insurance do to such factors as exploding prices of nursing homes
and increased demand for nursing home care relative to supply --- due mostly to
the bubble of aging baby boomers ---
https://en.wikipedia.org/wiki/Baby_boomers
One of the things greatly increasing the new Democratic bill for
Medicare-for-All to over $30 trillion is that it proposes adding extremely
expensive long-term care coverage to everybody in the USA (including millions of
undocumented immigrants) ---
https://www.politico.com/story/2019/02/26/house-democrats-medicare-for-all-1189139
Now what's so misleading about the median prices reported by state?
https://www.businessinsider.com/nursing-home-private-room-monthly-median-price-by-state-2019-3#10-delaware-10950-per-month-1
Firstly, averages (whether mean or median) should be accompanied by
variance and skewness distribution information. Skewness at the low end for
cheap and substandard nursing homes in particular brings down those averages
such that heirs wanting better care for their elders can expect to pay much more
than the medians reported in this study.
Prices can also vary greatly in terms of services provided. My granddaughter
is a licensed pharmacist for a nursing center in Bangor, Maine. Many nursing
homes cannot afford pharmacists, expensive therapists, and expensive
recreational facilities. The quality of available physicians also varies a great
deal such when a nursing home in the boondocks is very far away from physicians.
I suspect this is one of the factors that greatly increases the cost of nursing
care in Alaska where, I suspect, that there's a shortage of physicians in most
of the state.
Most nursing homes also offer a menu alternative services that vary with
varying patient needs. This distorts medians reported in the above study ---
https://capitalretention.com/jimmy-buffett-long-term-care/
**How
to Mislead With Statistics
NYT:
The Rich Really Do Pay Lower Taxes Than You ---
https://www.nytimes.com/interactive/2019/10/06/opinion/income-tax-rate-wealthy.html
Jensen
Comment
The article is misleading in two major respects. Firstly, the title implies that
the rich pay less taxes than you. How can that be true
since nearly half the USA "taxpayers" who file tax returns pay zero income taxes
---
Washington Post:
https://www.washingtonpost.com/blogs/fact-checker/post/a-fierce-tax-debate-without-much-light/2012/06/18/gJQAijuEmV_blog.html
Add to that the number, millions *rich and poor) in the underground
economy, who don't even file tax returns.
Add to that the fact that the rich pay more in other taxes, especially property
taxes that largely fund USA K-12 schools.
This
does not mean that the rich are paying as much as they should be paying, and the
rich have tax havens and other tax avoidance/deferral strategies (legal
andillegal) to reduce their income taxes. But it is false to write that "The
Rich Really Do Pay Lower Taxes That You." The rich in general pay more taxes
than you. They just don't usually pay as much as they should be paying. But
that's a different statement.
U.S.
Taxes are Progressive: Comment on “Progressive Wealth Taxation” ---
http://www.davidsplinter.com/Splinter-TaxesAreProgressive.pdf
U.S. federal taxes are
progressive, as shown by Congressional Budget Office and Tax Policy Center
estimates, with average tax rates increasing with income. In fact, the OECD
(2011) estimated that the U.S. has the most progressive household taxes
among developed countries. Moreover, the 2017 tax reform is expected to have
little effect on overall tax progressivity (Tax Policy Center, 2017; Joint
Committee on Taxation, 2019). But Saez and Zucman (2019) argue that average
tax rates are nearly equal over the income distribution. To examine this
claim, this paper compares other estimates of average tax rates by income
group, all of which suggest a high degree of progressivity. Three issues are
found to bias the average tax rates presented in Saez and Zucman (2019).
After correcting for these issues, their estimates align more closely with
other estimates that show U.S. taxes are progressive.
I. Comparing Estimates
of Average Tax Rates There are two types of average tax rate estimates in
the literature, one based on federal taxes and another on taxes from all
sources. Figure 1 considers average federal tax rates over the income
distribution, showing estimates from Piketty and Saez (2007), Tax Policy
Center (2018, hereafter TPC), Congressional Budget Office (2019, hereafter
CBO), and Auten and Splinter (2019, hereafter AS). The left side presents
tax rates excluding payroll taxes.2 For 2004, Piketty and Saez (2007)
estimated a second quintile average tax rate of –1%, with the negative rate
resulting from refundable credits, while the top 0.01 percent tax rate was
33%. The other three estimates are for 2014, with CBO and TPC estimating
bottom quintile tax rates of –8% and –4% and top 1 percent rates of 32% and
31%. AS estimated a bottom 50 percent tax rate of 2% and a top 1 percent
rate of 29%. These average tax rates increase with income, suggesting
significant progressivity.
Figure 1, right side,
includes payroll taxes. This generally increases federal tax rates by about
10 percentage points for the bottom 99 percent of the income distribution
and 2 percentage points for the top 1 percent—a result of the Social
Security contribution taxable maximum.3 Average tax rates taxes are very
similar among these four estimates and imply a highly progressive federal
tax system.4 The Joint Committee Taxation (2019) also estimated average
federal tax rates. For 2019, before accounting for the effects of the 2017
tax reform, these tax rates almost exactly match those of Piketty-Saez. For
2015, U.S. Treasury (2015) data indicate that average federal tax rates were
more progressive than those presented in Figure 1: rangin
from –5% for the bottom
quintile to 39% for the top 0.1 percent.5 Note that Figure 1 exaggerates the
share of the population at the top. While this emphasizes differences in top
tax rates, Figure 2 instead uses an equal-spacing approach that shows how
average tax rates truly spike for a small share at the top of the
distribution.
. . .
Saez and Zucman (2019)
argue that the U.S. has a relatively proportional tax system across all
income levels. However, federal taxes are progressive, as shown by Piketty
and Saez (2007), Auten and Splinter (2019), The Urban-Brookings Tax Policy
Center, the Joint Committee on Taxation, the U.S. Treasury, and the
Congressional Budget Office. Three issues with the Saez and Zucman (2019)
methodology for calculating tax rates are shown to explain much of their
deviation from other measures.
The
second thing that is misleading is that the article implies that back in the
1950s when the tax rates on high income people were much higher (think 70%) that
the rich really paid those high rates. Multimillionaire Bing Crosby was
not paying 70% in 1950. The rich took advantage of tax loopholes as much
or more in the 1950s as they do in the 21st Century. And the levies for state
income taxes and property taxes were much, much lower.
**How to Mislead With Statistics
Here's what (non-medical) college professors get paid at the 50 best
public universities in America
https://www.businessinsider.com/professor-salaries-best-colleges-in-america-2018-8
Jensen Comment
These "averages" are misleading because of the usual suspects such as lack of
information regarding distributions, standard deviations, outliers, and
demographic factors such as living costs and taxation. And there are huge
variations by discipline. A very highly paid scientist for example is an outlier
that distorts the mean average and fails to account for the fact that that
scientist may bring in far more revenue to the university than the university is
paying her/him in salary and other expenses.
UCLA and UC Berkeley pay quite well, but housing prices are enormous compared
to lower paying Miami University at Oxford and Binghamston University - SUNY.
Universities in New York and California get hammered with income taxes and other
taxes relative to universities in Florida, Texas, and Delaware.
Some universities in this listing avoid high cost academic programs such as
business and law where top faculty are very expensive. An example is the
University of California at Merced that has no business or law schools.
Universities that pay high salaries for business and law professors come out
ahead if those programs are cash cows for those universities (think UCLA,
Michigan, and UC Berkeley).
My main point is that paying very high salaries is not necessarily a bad
thing when the programs with highly paid professors are cash cows that support
programs not bringing in much money to a universi
**How to Mislead With Unrealistic Hope
New 2-Year Degree Promises Gen-Ed Basics and Fast-Track Career Skills ---
https://www.chronicle.com/article/New-2-Year-Degree-Promises/247600?utm_source=at&utm_medium=en&cid=at&source=ams&sourceId=296279
Jensen Comment
There are two types of certificate (badges) programs. The terrific one adds
specialties to students who already have considerable knowledge and experience
in a discipline like accountancy, finance, engineering, computer science, and
the various STEM degrees. The other provides a certificate after two years to a
kid with a high school diploma. It's a little like
studying brain surgery without first becoming an MD.
Sounds great to teach blockchain or machine learning in the first two years
out of high school. A student could actually learn
quite a lot about programming in one or two of the computer languages listed at
https://en.wikipedia.org/wiki/List_of_programming_languages
But this would be a lot like learning to type without learning how to
write. Students with "typing" degrees can work in typing pools but this is a
dead end career without learning deeper in a more promising career.
**How to Mislead With Statistics
America's Best and Worst States for Taxes ---
https://finance.townhall.com/columnists/danieljmitchell/2019/10/24/americas-best-and-worst-states-for-taxes-n2555297?utm_source=thdaily&utm_medium=email&utm_campaign=nl&bcid=b16c6f948f297f77432f990d4411617f
The
combining of "taxes" can be misleading. For example, compare the above ranking
with the following ranking.
01 New Jersey
(highest taxes)
02 New York
03 California
04 Connecticut
05 Arkansas
06 Minnesota
07 Vermont
08 Maryland
09 Iowa
10 Louisiana
. . .
41 Indiana
42 Utah
43 Oregon
44 Nevada
45 New Hampshire
46 Montana
47 Florida
48 Alaska
49 South Dakota
50 Wyoming (lowest taxes)
Jensen Comment
There's no one state that's best or worst on all types of taxes. And even with
respect to one tax, the outcomes can be misleading. Take property taxes.
California is horrible for recent home buyers, but property taxes are relatively
low for long-time home owners because of Proposition 13 ---
https://en.wikipedia.org/wiki/1978_California_Proposition_13
And states that appear to be best
in terms of all taxes in the above ranking are among the worst for some types of
business taxes. And some taxes that are the highest taxation states often make
the best deals for attracting and keeping businesses with tax breaks and
subsidies --- Exhibit A is New York.;Exhibit B is New Jersey; and Exhibit C is
Illinois.
But the biggest problem lies in
how multiple tax burdens are aggregated across different taxpayers. Compare the
ranks above with the ranks below.
States with the highest, lowest state and local tax collections ---
https://taxfoundation.org/state-local-tax-collections-per-capita-2019/?fbclid=IwAR3zpltt_AMIquAps_TtHDDUk482ovmEqO9sU1jUu3GQX32Ttp-g1p4Amrs
01 New York
(highest taxes)
02 Connecticut
03 New Jersey
04 North Dakota
05 Hawaii
06 Massachusetts
07 Minnesota
08 California
09 Maryland
10 Vermont
. . .
41 Missouri
42 Georgia
43 Mississippi
44 Arizona
45 Idaho
46 Florida
47 Oklahoma
48 South Carolina
49 Tennessee
50 Alabama (lowest
taxes)
Jensen Comment
This is a classic case of ranking based upon averages that ignore sampling
distributions (particularly skewness), standard deviations, and outliers.
For example, Alabama supposedly offers the best tax deal, but not necessarily
if you make over $250,000 per year. Alabama has all types of taxes, including an
income tax. If you make over $250,000 per year you're probably better off in a
state without an income tax like Nevada or Florida. The problem is that Alabama
has a skewed distribution with lots of low income people who pay little or no
income tax. In comparison New York has a much higher proportion of very high
income people who pay lots and lots of income tax.
Wealthy people are fleeing high income tax states like New York and Vermont,
but not many are choosing to relocate in
Alabama because Alabama supposedly, according to the above article, offers the
best tax deal among all 50 states. That alone should tell you something is wrong
with the above ranking of states.
Taxation was a factor in my decision about where to retire, especially when
comparing high tax states like California, Wisconsin, Vermont, and Maine with
with relatively low taxing New Hampshire (that has no sales tax or income tax).
It's also hard to compare some types of taxes. California, for example, is
exceedingly difficult to evaluate in terms of property taxes without knowing the
context of the comparisons. If you've owned a big house in Palo Alto, California
for 40 years property taxes are not a killer because of Proposition 13 that
locks you into paying less than $25,000 per year. However, if you sell your
house the buyer may have to pay way over $250,000 per year in property taxes on
that same house.
Even outside California property taxes are much different than income taxes
and sales taxes. For example, I pay relatively high property taxes on my
four-acre home site in New Hampshire. However, I hope to get some of those taxes
returned if and when I elect to sell the property. However, there would be no
return of sales and state income taxes if New Hampshire had taxes on sales and
incomes.
This is something I considered when I chose to
retire in New Hampshire. But. given my level of retirement income I
would never consider buying a house in Palo Alto after retiring from my job in
Texas. I could not afford to pay property taxes of $250,000+ per year even if
one day in the future some of those taxes were returned in the selling price of
my Palo Alto house.
How to Mislead With Statistic
Americans Increasingly Are
Leaving High-Tax States For Low-Tax States ---
https://taxprof.typepad.com/taxprof_blog/2020/11/americans-increasingly-are-leaving-high-tax-states-for-low-tax-states.html
Jensen Comment
The phrase "statistically" significant in the context of state taxation is
misleading. State taxation can be a major factor in state migrations, but there
are other factors that work interactively with state taxation to "cause" state
migration. These include nearness to children, climate, economic opportunity
(including remote work), health facilities, real estate availability/cost, other
living costs, scenery. recreation, entertainment (think Broadway), etc.
For example, San Antonio is a
very popular place to live among retired military. The fact that Texas has no
income tax and the relatively low real estate prices are important factors to
consider, but for some retired military the big attraction is medical services
from the enormous Brooke
Army Medical Center and the
Audie Murphy Veterans Hospital. Retired military can get surgeries and other
medical services from BAMC even if they are no longer on active duty.
**How to Mislead With Statistics
Which Accounting Jobs Pay the Most?
https://www.accountingweb.com/practice/practice-excellence/which-accounting-jobs-pay-the-most
Jensen Comment
Firstly, this study has all the deficiencies of other studies based upon means
without providing information about variances, outliers, and distributions,
particularly skewness. For example, when their are outliers such as extremely
high paid workers means can be skewed upwards. If the data are skewed downwards
by very low clerical employees means can be misleadingly low.
Secondly, the study does not include fringe benefits that can vary a great
deal. For example, some organizations invest heavily in job training make it
easier to advance within an organization or jump to another organization. Some
organizations even pay for college tuition such as accountants who work for
Statbucks, Walmart, McDonalds, Poppa Johns, etc. Some of these firms will even
pay for graduate school. Also firms vary greatly with respect to vacation
allowances, paternity leave, sick leave, parking, travel allowances, etc.
Thirdly, jobs vary a lot in terms of job security. For example, it's
virtually impossible to fire a civil service employee short to being jailed for
a felony. For example, IRS workers who were fired for extreme absenteeism and
poor performance were recently hired back.
My Latest Web Document
Over 500 Examples of Critical Thinking and Illustrations of How to Mislead With
Statistics ---
http://faculty.trinity.edu/rjensen/MisleadWithStatistics.htm
**How to Mislead With Statistics
U.S. Funding for University Research Continues to Slide ---
https://itif.org/publications/2019/10/21/us-funding-university-research-continues-slide
The United States continues to fall further behind
world leaders in funding for university research. To reverse course, it
should increase support by $45 billion per year and provide stronger
incentives for businesses to increase their investments.
KEY TAKEAWAYS
Research
universities play a critical role in generating innovation-based economic
growth and driving U.S. global innovation leadership.
According to the
most recent OECD data, the United States has slid to 28th of 39 nations in
government funding for university research as a share of GDP, with the 12
leading governments investing more than double the U.S. investment.
Between 2011 and
2017, U.S. government funding for university research as a share of GDP fell
by nearly a quarter—0.06 percentage points. On average, nations decreased
0.03 percent of GDP during that time.
Congress should
commit to increasing university research support by $45 billion per year,
which would place the United States among the top seven nations in the world
in funding for university research.
Congress
should also expand the energy-related collaborative research and
experimentation tax credit to apply to any field of university research
investment—not just energy research—made by businesses.
Continued in article
Jensen Comment
How can these statistics possibly be misleading? One huge way is in failing
to count much of the research funding. For example, in the USA universities have
undergraduate and graduate business programs to a much larger extent than
colleges and universities in the rest of the world. Indeed the business college
on a USA campus is often the largest college on a university campus, especially
in most state-supported universities. There are also large humanities programs
such as modern languages. Whereas science and engineering colleges on campus
rely heavily on government and business research grants, the colleges of
business and humanities have few such grants counted in the above study as
"research." However, in colleges of business and humanities the tenure and
performances of faculty are heavily weighted on research performance. Over the
years teaching loads of upwards of five courses per semester dropped to two or
three courses per semester to support the research mission. In graduate schools
of business it is now common to only require one or two course preparations per
year. Plus most universities fund sabbatical leaves and summer research.
My point here is that in the USA much of the funding for business and
humanities research did not get counted in the above study. Faculty instead get
teaching relief and other university stipends that were overlooked in the above
study. In other parts of the world business education programs, if they exist at
all on campus, are part of science divisions (think economics) where government
research grants are more readily available than they are for business colleges
in the USA.
If research funding is so great in Switzerland, Norway, and Denmark why don't
the Chinese and Russians spend billions more trying to steal their research
relative to what is spent trying to steal the research of the USA?
Apart from university campuses, the above study ignores much of the research
taking place in business and government in the USA. The problem is that research
funding is confounded with funding of other job duties. The best example here is
product development in business firms where research is only part of the entire
heavily-funded total operation of product development. It's virtually impossible
to separate what part of product funding is development and what part is
comprised of other aspects of product development.
The above study ignores output volumes in terms of research publications of
the largest countries like the USA, China, and India. My hunch (strictly a guess
at this point) is that the USA, China, and India produce more research
publications than the rest of the world combined, although counting home
countries of authors gets complicated because of the rise in joint authorships
between USA authors and foreign authors.
The above study ignores funding of research facilities (link science,
medical, and computing laboratories in universities and business firms) where
the USA dominates.
If the other nations of the world are doing such a great job funding research
where are their new patents?
New Drug Patents by Country ---
https://www.americanactionforum.org/wp-content/uploads/2016/05/2016-05-17-Drug-Patents-Checkup.pdf
Over the past half century, the United States
has been the birthplace of the majority of the world’s biomedical
innovations.1 Despite a global slowdown in the development of new medical
interventions, due to the scientific shift towards more complex biologic
treatments, innovation in the U.S. has remained relatively steady thanks to
strong financial incentives to invest in research and development (R&D). In
fact, the below chart may underrepresent American contributions to
pharmacological breakthroughs in the past two decades as a result of U.S.
corporations relocating their headquarters to Switzerland and the U.K. to
take advantage of those countries’ lower corporate tax rates.
Jensen Comment
This does not justify some of the evil pricing schemes of big pharma in the USA,
especially pricing by patent trolls. But it does illustrate how complicated the
invention of biomedical innovations (that includes more than drugs) becomes,
especially when comparing the USA with the more highly populated European Union.
Why doesn't the EU lead in discovery of biomedical innovations? Why aren't
Russia and China inventing new biomedical innovations as fast as they are
inventing technology innovations?
I think that the highly defective and misleading ranking of nations on the
basis of research funding is secretly political in a subtle scare-tactic effort
to get lawmakers to greatly increase taxpayer funding of research in the USA. It
would be more meaningful if it did not leave out so much data on the total
funding of research in the USA.
**How to mislead with statistics
There Are 79 Jobs With Six Figure Salaries ----
https://247wallst.com/special-report/2019/08/06/there-are-79-jobs-with-six-figure-salaries-2/9/
Jensen Comment
This is among the most misleading rankings I've ever seen.
Firstly, many of the professionals included in the rankings don't have "jobs"
that pay salaries. They are business owners who rely on profits rather than
salaries. Thinks of surgeons who have their own offices, nurses, physician
assistants, receptionists, accountants, etc. They have many expenses, especially
malpractice insurance policies and claims pay out.
Secondly, many have profit sharing and bonus plans that are almost impossible
to predict above and beyond salaries included in this study.
Thirdly, these are averages with enormous standard deviations and skewed
distributions. For example, college professor salaries and physician assistant
salaries are truncated much lower than salaries of lawyers and brain surgeons.
Fourthly, the jobs vary greatly in terms of benefits. College presidents for
example get free housing, huge expense allowances, cars, etc.
Fifthly, salaries are cover varying parts of the year. Professors, for
example, are included in this study at their nine-month base. Those same
professors get added salaries for summer teaching, research, book royalties,
consulting, patent royalties, etc.
Sixthly, some jobs are conducive to added compensation, particularly outside
consulting, book writing, speeches, musical performances, etc.
The bottom line is that these rankings are mostly garbage and very misleading
for career aspirants.
**How to Mislead With Statistics
Children’s average allowance in 2019: $120 a month ---
https://www.journalofaccountancy.com/news/2019/oct/average-child-allowance-2019-201922088.html?utm_source=mnl:cpald&utm_medium=email&utm_campaign=01Oct2019
Jensen Comment
How could this conclusion possibly be misleading? Firstly, it's an average based
upon an unknown distribution that may must have a huge standard deviation,
outliers (think of all the families that do not pay a cash allowance), and
variations over time (there are weeks where a given child gets less allowance or
more allowance. And there are variations in what students must buy with their
allowances and duties they must perform for their allowances. Some have to buy
their own ski lifet tickets, equipment, and clothing, including tennis shies,
whereas others get many things like clothing extra. Some are required to save
portions of allowances.
The bottom line is that "allowances" are not fungible items in sampling
distributions.
**How to Mislead With Statistics
Here's how much money doctors across the US make ---
https://www.businessinsider.com/how-much-money-do-doctors-make-gender-pay-gap-doximity-study-2019-3
Jensen Comment
This article is a great example of how statistical reports can be misleading if
they only focus on mean averages without added information about standard
deviations and skewness and missing variables. For example, consider
neurosurgery. My wife's spine surgeon in Boston is what he calls a "big-back"
surgeon. He performs spinal surgeries that 95+% of the back surgeons in the USA
refuse to perform. He actually broke Erika's spine into three pieces and then
attached four rods from her hips to her neck. Afterwards, however, she can still
pick up a tissue off of the floor when bending her spine. Needless to say his
rates, sometimes exceeding tens of thousands of dollars per surgery, are greater
than the rates of "little-back" surgeons who also work out his office. By the
way, he's not on the faculty of the Harvard Medical School. However, every time
I've spoken with him he was followed by two or three Harvard Medical School
neurosurgery residency physicians who were what I called his "puppies."
By the way, it might be interesting to study details of his malpractice
insurance premiums and lawsuits. He's amazing because he has the guts to be a
"last-chance" neurosurgeon in spite of the circling lawyers. By last chance I
mean when patients can no longer find a neurosurgeon who will operate on their
spines he's their "last chance." Erika had over a dozen spine surgeries before
she at last found this "big-back" surgeon in Boston.
There are also many other troubles with the above article. For example,
malpractice insurance is very high priced in the USA relative to all other
nations. And malpractice insurance costs vary greatly with specialties such as
being very high for obstetrics (lawyers sue for every bad baby) versus
neurosurgery versus psychiatry versus primary care physicians.
Let's consider an example. According to the study the average pay for a
neurosurgeon is $617,000. But that does not account for differences in whether
that salary is net of malpractice insurance premiums. Such netting out is
complicated because many neurosurgeons make this much or much more without
having to pay malpractice insurance premiums. My wife's spine surgeon who
installed her morphine pump is an employee of the Dartmouth Hitchcock
Medical Center that pays malpractice insurance for virtually all employees and
medical school faculty. However, many neurosurgeons who operate in that same
medical center are not employees and must pay their own malpractice insurance.
Similarly, there's a nearby Veterans Hospital where VA neurosurgeons do not have
to pay their own malpractice insurance. But if the VA has to outsource a
particular type of surgery that surgeon's bill to the VA will include
malpractice insurance.
Incomes of many specialists vary when they must pay for their own staff
versus have no expenses for staff. For example, the Dartmouth Hitchcock Medical
Center pays for all staff such as receptionists, nurses, technicians,
accountants, etc. It even pays for lawyers when needed. The
private-practice physicians who may also perform surgeries at this medical
center must pay for their own office space and staff. How do you compare a
salaried employee of that medical center with the profits of a private-practice
physician?
I might point out a political problem related to all of this. There's an old
saying: "Show me a bad doctor, and I'll show you a rich professional." The
point is that even at the lowest end of the income distribution medical doctors
in the USA are well paid.
The Democratic candidates for the 2020 presidential nomination have created a
paradox.
Most, not all, students are drawn to medical school in anticipation of
relatively high after-tax incomes. The
politicians advocating Medicare-for-All want to fund this $30+ trillion cost
with greatly increased taxes (think 70% of a physician's income). At the same
time more than twice as many physicians will be needed to staff
Medicare-for-All. Eventually, the progressives will also legislate free medical
school education. But how many students will flock to medical schools even if
they are free? My guess is very few if you are gong to tax away 70% of their
income when they at long last begin to practice medicine.
The problem with becoming a physician is not just the cost of
medical school. The problem is the ordeal --- those years of education and
training needed to become masters of their crafts. The time needed varies with
specialties, but you don't become a neurosurgeon without years of ordeal in
training before you can bill your first paying patient. And there's a lot of
blood, sweat, and tears in those training years. Even worse is that there's a
lot of weekly tension and risk of burn out in the years of practice that follow.
Tell that to the advocates of Medicare-for-All combined with soaring taxes.!
If you want to double the number of physicians in the USA you not only have
to make medical school free; You have to let them be the highest paid
professionals on average after taxes.
PS
You can read more about Erika's ordeal with pain and surgeries at
http://www.cs.trinity.edu/rjensen/Tidbits/ErikaBob/ErikaPain/Set01/Set01.htm
I might add that the electronic pain stimulator installed eventually proved to
be worthless. The same surgeon who installed it removed it and replaced it with
a morphine pump. The pump is no magic bullet, but its more effective than the
electronic wiring up and down her spine
Fun Facts About Animals (perhaps "facts" should have quotation marks) ---
https://lefactsle.blogspot.com/2019/06/funanimals.html
Jensen Comment
Some "facts" above are probably more like averages and may not apply in all (or
even most ) cases. For example, polar bear mothers do not always starve
themselves after giving birth. And hummingbirds have some types of
"intelligence" but crows, hawks, and other birds can be trained about some
things you can't teach a hummingbird. Much depends upon how "intelligence" is
defined and related to the mysteries of instinct (such as navigation mystery).
Tigers and lions usually have different habitats and rarely fight. If they
fight much depends upon size and skill and health. And they rarely cross breed.
Some names are given here are less general than other names. For example a "zebroid"
is a more general name, whereas a "zorse" is that subset resulting from mating a
zebra stallion with a horse mare ---
https://en.wikipedia.org/wiki/Zebroid
In fairness the site states male zebra and female horse. This leaves us
wondering about the mating of a female zebra with a male horse.
In any case this is an informative fun site.
12 incredible "facts" about jellyfish ---
https://www.businessinsider.com/jellyfish-facts-things-you-didnt-know-2019-6
For academics, what matters more: journal prestige or readership?
https://www.sciencemag.org/careers/2019/07/academics-what-matters-more-journal-prestige-or-readership
Jensen Comment
The more interesting question is more complicated depending upon what one means
by "journal." It also varies with needs of the academic. Exhibit A is Paul
Krugman who has a Nobel Prize in Economics and a very popular blog in the New
York Times. It's misleading to compare whether a NYT Blog article or an article
in liberal media magazine called Slate or an article in the Journal of
Political Economy matters most to Paul.
Paul Krugman ---
https://en.wikipedia.org/wiki/Paul_Krugman
An occasional publication in a very prestigious and rigorously refereed
article such as the JPE matters a great deal to Paul
for maintaining respect as an economic theorists.
But the following article a choosy popular press magazine (Slate) gets
across an important and controversial message that he wants to be read
worldwide. For example, the following reference is very important to him
because, in defending multinational corporations, he riled the core audience of
the liberal Slate and even riled his core constituency in general.
Publishing this article in the WSJ or JPE would not have had the same emotional
worldwide impact.
"In
Praise of Cheap Labor," by Paul Krugman,
Slate, March 21, 1997 ---
https://slate.com/business/1997/03/in-praise-of-cheap-labor.html
In this article Paul demonstrates academic independence which I'm sure pleased
him even though his core constituency emotionally disagrees with his conclusions
in this article.
But it must please him even more when he stirs up his conservative critics
--- something he does regularly in his NYT blog. Yeah I know that in most blogs
and Websites the publications do not pass through a rigorous refereeing process
that chooses whether to publish or not publish an article. But once published or
cited in a popular blog the article may obtain hundreds or thousands of
commentaries.
Paul Krugman’s Most Evil Idea ---
https://marginalrevolution.com/marginalrevolution/2019/08/paul-krugmans-most-evil-idea.html
Especially note to number and range of commentaries --- including my own comment
published on August 2, 2019:
Never fear. Paul Krugman will swoop down from Fantasy Heaven
and show the USA how to raise $20+ trillion dollars to fund the Democratic
Party platform programs for Green Initiative costs combined with free
Medicare-for-All, free medications, free nursing homes, free college,
guaranteed annual income for 350+ million residents of the USA, interest on
eventual $200+ trillion of national debt, free food, free housing, Social
Security benefits, pensions, and other safety nets. Please swoop down and
save the USA pensions and the rest of the USA economy Paul.
Meanwhile the economy seems to be rolling along with
relatively low unemployment and record stock prices and record pension fund
levels. Those damn Republicans are really killing us Paul --- that is before
you swoop down to make big improvements in our economy and its incoming
hordes of undocumented immigrants.
It never dawned on me that you can raise $20+ trillion just
by using the printing presses.
Added Jensen Comment
My added point this morning is that I don't think you can compare whether
journal prestige or readership matters most to an academic. Too much depends
upon circumstances. Whether you are an untenured assistant professor or a Nobel
Prize winner publishing in a prestigious journal that is rigorously refereed is
very important for for respect among your academic peers. Blogging controversial
articles that are widely read around the world is very important if you've
already earned a Nobel Prize. Doing so as an untenured assistant professor is
not at all advisable when the articles are controversial.
Also blogging popular articles daily probably takes too
much time for an untenured assistant professor.
My point is that the importance of journal prestige versus
readership varies considerably with stage of life and emotional attachment to
causes (think politics). I don't think we can really answer the question of
whether a publication in JPE matters more or less to Paul Krugman. relative to
publishing an article in Slate or the NYT. All are vitally important to
him for different reasons. An untenured assistant professor does not get such
luxury.
Canadian doctors still make dramatically less than U.S. (and UK and
German) counterparts: study ---
https://nationalpost.com/news/canada/canadian-doctors-still-make-dramatically-less-than-u-s-counterparts-study
Canadian doctors make less than the OECD average, although they do not pay
nearly as much as USA physicians for malpractice insurance, office space, and
labor assistants like office nurses ---
https://en.wikipedia.org/wiki/Physicians_in_Canada
. . .
Canada
should not ignore the wage gap, as a sudden shortage of certain specialists
in the States could trigger a drain from here, said Dr. John Haggie,
president of the Canadian Medical Association. Canada saw a net loss of
doctors to the U.S. in the 1990s, as provinces instituted doctor pay caps
and tried to rein-in fee increases as a way to corral health costs.
But
Dr. Haggie voiced no particular envy Tuesday at the statistics just
published in the journal
Health Affairs
Jensen Comment
I read where there are 72,000 physicians employed in the Canadian health system.
The population of Canada is 37+ million spread over nearly 4 million square
miles.
In the USA
Patients experience long waits (months) for doctor appointments largely due to
the shortage of Canadian physicians. Delays for elective procedures such as knee
and hip replacements are so long that many Canadians use their own savings to
get such surgeries performed in the USA.
In the USA there are over 950,000 physicians who, on average, are the
highest paid professionals in the USA..
https://en.wikipedia.org/wiki/Physicians_in_the_United_States#Demographics
Also see
https://247wallst.com/special-report/2017/03/08/states-with-the-highest-and-lowest-paid-doctors/
The population of the USA is nearly 10 times that if Canada if you include the
undocumented immigrants. USA residents are spread over roughly the same number
of square miles as Canada, although the distribution is not as skewed as that of
Canada is skewed toward the south.
Bernie Sanders: "You’re Damn Right We’re Going to Destroy Private Health
Insurance" ---
Click Here
The average federal employee earned $84,153 in 2014—roughly 50% more than
the average worker in the private economy
**How to Mislead With Statistics (incomplete analysis)
From a Wall Street Journal newsletter on November 20, 2015
Mac Zimmerman cites a Cato
Institute report showing that “the average
federal employee earned $84,153 in 2014—roughly 50% more than the average
worker in the private economy. When you include benefits like health care
and pensions —
nearly 80% higher than
everyone else.”
The Editorial ---
http://www.wsj.com/articles/the-sweet-gig-of-being-a-bureaucrat-1447978181?mod=djemMER&alg=y
Jensen Comment
Comparisons like this should contrast differences in public sector versus
private sector distributions of income. Relative to the public sector the
private sector has a much larger standard deviation in a distribution that is
not at all normal (think of the millions of minimum wage workers in contrast to
a much smaller number of overpaid corporate executives). The public sector
nearly always pays more than minimum wage but even the USA President Obama's
salary is paltry compared to the highly paid corporate CEOs with all sorts of
side deals like bonus plans and stock options.
In comparison to the public sector, many private sector employees are on
potentially lucrative pay-for-performance plans such as performance commissions
and bonuses. And there are usually more overtime opportunities in the public
sector.
Anecdotally, most graduates from accounting masters degree programs are
seeking to pass the CPA examination and make a career in the private sector.
There must be a reason. A few might seek to become glamorous pistol-packing FBI
agents but most of the relatively small number of graduates looking for public
sector jobs (like joining the IRS as a staff accountant) do so because they were
passed over by the private sector. Many of those in the public sector like
those who become IRS agents are seeking opportunities to break into higher
paying jobs in the private sector.
A huge lure of the private sector is the possibility (however remote) of
rising to compensation levels well above opportunities for above-average
compensation in the public sector.
How a renowned researcher beat the roulette odds, stumped casino owners
around the world, and walked away with a fortune
---
https://thehustle.co/professor-who-beat-roulette/
. . .
Though roulette was considered by many
to be purely a game of chance, Jarecki was convinced that it could be
“beat.”
He noticed that at the end of each
night, casinos would replace cards and dice with fresh sets — but the
expensive roulette wheels went untouched and often stayed in service for
decades before being replaced. Like any other machine, these wheels acquired
wear and tear.
Jarecki began to suspect that tiny
defects — chips, dents, scratches, unlevel surfaces — might cause certain
wheels to land on certain numbers more frequently than randomocity
prescribed.
The doctor spent weekends
commuting between the operating table and the roulette table, manually
recording thousands upon thousands of spins, and analyzing the data for
statistical abnormalities.
“I [experimented]
until I had a rough outline of a system based on the previous winning
numbers,” he told the
Sydney Morning Herald
in 1969. “If numbers 1, 2, and 3 won the last 3 rounds, [I could determine]
what was most likely to win the next 3.”
Jarecki’s
approach wasn’t new:
Joseph Jagger,
thought to be the “pioneer” of the so-called “biased wheel” strategy, had
won hefty sums this way in the 1880s. In 1947, researchers
Albert Hibbs
and Dr. Roy Walford used the technique to buy a yacht and sail off into the
Caribbean sunset. Then, there was
Helmut Berlin,
an ex-lathe operator who, in 1950, hired a team of cronies to track wheels
and made off with $420,000.
But for Jarecki, it
wasn’t about the money: He wanted to perfect the system, repeat it,
and “beat” the wheel. It was a matter of man triumphing over machine.
After months of collecting
data, he scraped together $100 (his rainy day savings) and hit the casino.
He’d never gambled — and though he trusted his research, he knew he was
still up against “the element of chance.”
In a matter of hours, he
flipped his $100 into $5,000 (~$41,000 today). And with this validation, he
turned to much higher stakes.
Breaking the odds
In the mid-60s,
Jarecki moved to Germany and took up a post at the University of Heidelberg
to study
electrophoresis
and forensic medicine.
He’d recently won a highly
prestigious peace prize (one of only 12 awarded worldwide) for his work on
international cooperation in medicine, and, as a result, had gained entry
into an elite group of doctors and scientists.
But Jarecki had his
eyes on a different prize: The nearby casinos.
. . .
In
the decades following Jarecki’s dominance, casinos invested heavily in
monitoring their roulette tables for defects and building wheels less prone
to bias. Today, most wheels have gone digital, run by algorithms programmed
to favor the house.
Continued in article
Jensen Comment
This illustrates one of the major flaws of statistical analysis --- assuming
randomness that is not random. Lottery officials must these days must be
especially concerned with maintaining randomness.
The Michael Milken Project: How did a 70-year-old ex-con barred for
life from Wall Street become one of its most respected men?
https://www.institutionalinvestor.com/article/b1f6wj9ghqxv8h/The-Michael-Milken-Project
Jensen Comment
After being released from prison, one of Milken's pet projects was for-profit
education ---
https://en.wikipedia.org/wiki/Michael_Milken
Milken and his brother Lowell founded Knowledge
Universe in 1996, as well as Knowledge Learning Corporation (KLC), the
parent company of KinderCare Learning Centers, the largest for-profit child
care provider in the country. He is currently chairman of the company.
He established K12 Inc., a publicly traded
education management organization (EMO) that provides online schooling,
including to charter school students for whom services are paid by tax
dollars, which is the largest EMO in terms of enrollment.
Continued in article
However, Milken badly overestimated how corporations would "eat the lunch" on
traditional (including prestigious) colleges ---
https://journals.uic.edu/ojs/index.php/fm/article/view/858/767#w2
In general the profit model has not panned out in higher education. Reasons are
very complicated, but to date for-profit experiments did not attract top faculty
or top students. Even when investing in a few top faculty, the for-profit
experiments could not overcome the attractions of top students for prestigious
colleges and universities.
**How to Mislead With Statistics
From MIT: Living Wage Calculator ---
http://livingwage.mit.edu/
Jensen Comment
There are quite a few sources of error. For example, I live in Grafton County,
New Hampshire. Within Grafton County, the cost of housing has a wide variation
between Hanover (home of Dartmouth College) having very, very high housing
purchase and rental costs versus decadent mill towns in Grafton County like
Lisbon. But the Living Wage Calculator does not
distinguish between the living wage in Hanover versus the living wage in Lisbon
that has to much lower than that of Hanover.
Another source of error arises between larger towns and very small villages.
For example, larger towns in New Hampshire have free transportation services for
the poor and elderly. Small villages do not even have local taxi services. In
comparison large cities like Boston have various options for low cost public
transportation that do not exist for most of the rest of New England. Also a
city like Boston has wider ranging rental prices for housing that vary in
different parts of the city. The living wage calculator does not factor in the
fact that non-unionized big stores like Wal-Mart are not allowed in Boston,
thereby increasing the shopping costs of residents of Boston.
The living wage calculator factors in taxes when comparing living costs of a
New Hampshire county having no income or sales taxes versus an adjacent Vermont
county having the highest income, sales, and property taxes in New England. The
Living Wage Calculator will not, however, adjust for the fact that a Vermont
resident has a high probability of both working and shopping in New Hampshire if
the commuting distances are relatively short. Thus reported differences in
living wages for many counties in Vermont can be misleading.
Residents in northern New England have access to Canada's inexpensive
prescribed medications, where it is much more costly and inconvenient for
residents of southern New England to traverse back and forth to Canada.
Residents in San Antonio can and do live fairly well without air conditioning
(there's breeze almost every night caused by the
Balcones Fault). But residents of New England cannot live without heat. I'm
not certain how the Living Wage Calculator adjusts for this difference, but my
guess is that it factors in the costs of cooling and heating without accounting
for the fact that it's possible in many warm climates to live fairly well
without cooling. I should add, however, that I would not want to live in San
Antonio without air conditions, but many, many residents there do live without
air conditioning.
The list of variations in "living" expenses that are not factored into the
"Living Wage Calculator" is enormous.
No one variation may be significant but in aggregate I think they can add
significant error to the numbers pumped out of the "Living Wage Calculator."
**How to Mislead With Statistics
Although the current drought in California is really bad, it is not the worst
in history for California
"California hasn't had a drought this bad since at least 1895," by Brand
Plummer, Vox, August 15, 2014 ---
http://www.vox.com/2014/8/15/6006467/california-hasnt-had-a-drought-this-bad-since-at-least-1895
**How to mislead with statistics
"More than half of Harvard's most recent graduates had an A- GPA or better,"
by Peter Jacobs, Business Insider, May 27, 2015 ---
http://www.businessinsider.com/more-than-half-of-harvards-most-recent-graduates-had-an-a-gpa-or-better-2015-5
Jensen Comment
This is misleading in a sense that the GPA is not a normal distribution. Grades
are truncated more above A- (since no grades higher than A are awarded) whereas
grades below A- are less truncated (with possibilities of B+, B, B-, C+, C, C-,
D+,D, D-, and F). This means that a whole lot of students probably got A grades
to bring the mean clear up the A-.
Bob Jensen's threads on grade inflation ---
http://www.trinity.edu/rjensen/Assess.htm#RateMyProfessor
**How to Mislead With Statistics,
"Federal Error Rates Criticized," by Michael Stratford, Inside Higher
Ed, May 20, 2015 ---
https://www.insidehighered.com/news/2015/05/20/education-department-inspector-general-slams-agency%E2%80%99s-estimates-erroneous-pell-grant
The U.S. Department of Education last fall switched
its approach to estimating how much it improperly paid out in Pell Grants
and student loans after officials learned their initial methodology would
have shown large jumps in erroneous payments, the department’s watchdog unit
said in a
report issued Tuesday.
The revised methodology, which the department
retroactively received permission from the White House’s Office of
Management and Budget to use, produced far lower estimates of improper
payments than the department’s original methodology, according to the Office
of Inspector General’s report.
The Education Department, like other federal
agencies, is required to estimate each year the rate at which some of its
programs improperly dole out federal dollars. Such erroneous payments
include, for example, a student receiving a Pell Grant that is above or
below the amount for which he qualifies. It would also include a college not
properly returning federal loan money after a student withdraws from
classes.
Continued in article
**How to Mislead With Statistics
Five of the Best Computer Science Classes in the U.S. ---
http://www.bloomberg.com/news/articles/2015-06-11/five-of-the-best-computer-science-classes-in-the-country?cmpid=BBD061115
Jensen Comment
These are not necessarily the "best computer science classes" per se.
Because the students are so outstanding the worst teachers in the university
could probably outcomes not statistically different from the best teachers of
computer science. The misleading part is that if one of these "best class"
teachers taught computer science in a Baltimore community college, his or her
courses may be close to the "worst classes" in that college.
For great students the teacher who knows the most is important even if the
teacher is lousy in the classroom. For weak students great teachers who inspire
are important even if they aren't high in technical knowledge.
My point is that "best" is a relative term for both courses and teachers. I
had some bad teachers at Stanford University, particularly one in psychology and
another one in political science.
It's also a myth that top researchers are top teachers. Some certainly are
great teachers. But I've had doctoral students from highly reputed researchers
that were awful courseso
**How to Mislead With Statistics
The County in Each State With the Least Expensive Housing
https://247wallst.com/special-report/2019/03/21/the-county-with-the-least-expensive-housing-market-in-every-state-2/
Jensen Comment
Firstly, this really should read the least expensive houses to buy since it
ignores the rental markets such as rental markets for apartments.
The study is based primarily on median home values and suffers from the
frustrating lack of information about variances and skewness.
There is some added useful information such as the percentage of houses in
each county that are vacant. But this is sometimes confusing. For example, in
Clark County, New Jersey there is only a 10.2% vacancy rate with the median
house value at $161,596. in Clark County, Idaho 43.4% of the houses are
vacant and yet the median value of a home is $108,629. And then there's De Baca
County, New Mexico the median value of a house is only $69,412 with a vacancy
rate of 41.7%. It makes a little more sense for home values to be lower when
vacancy rates are higher.
But there are many other variables to consider that are ignored in this
study. For instance in Hawaii County, Hawaii the median value of a home is
$375,676 with a vacancy rate of 22.3%. This is probably because Hawaii is such
an outlier in a study like this. Another outlier is the Yukon-Koyukuk Census
Area that has a median house value of $83,596 with a whopping 51.8% vacancy
rate.
**How Statistics Can Mislead
Nature: The Wisdom of Polarized
Crowds ---
https://www.nature.com/articles/s41562-019-0541-6.epdf?author_access_token=OBbRz4-TlWv-jI-C45Zh8NRgN0jAjWel9jnR3ZoTv0OiMcmZk1otetPVC1EgJIIYkf4BJ1F74E1duh93_syk-pw2d96grsA473E7fo_WRDbEdPtDBzzkn3Jyt7yGsNSpkklxqjkI1Fvvuw8MHqiyFw%3D%3D
Jensen Comment
This may be a bit misleading in that it depends upon the wisdom (level of
intellectualism) of the crowds and the subject matter and context.
**How Statistics Can Mislead
"MOOC Students Who Got Offline Help Scored Higher, Study Finds," by Steve
Kolowich, Chronicle of Higher Education, June 7, 2013 ---
http://chronicle.com/blogs/wiredcampus/mooc-students-who-got-offline-help-scored-higher-study-finds/44111
Jensen Comment
Although I like this article, it is yet another example of the many times
statistics are used to mislead readers. At the roots this is really a rehash of
the issue of causation versus correlation.
- Students who seek out offline help may simply be more intense about
learning than those who do not seek offline help. It may not be the help
itself that make them score higher. It may be their desire to learn apart
from help seeking. If we had a way to measure this desire it would possible
to get closer to the underlying causal factors for higher grades.
- Overweight people who buy a particular very expensive new diet book may
lose more than a random sample among overweight people who do not buy that
particular book. However, the cause of the weight loss may not be the
content of that particular diet book. It may just be that people who bought
this expensive book had more desire to lose weight.
- Students in a traditional intermediate accounting course who repeatedly
seek out extra help during office hours of the instructor may do better on
average than those who rarely if ever show up for office hour help. This is
not an indicator that the instructor is doing a fantastic job teaching
during office hours. It just may be that the students seeking more office
hour help also are driven to study harder in general.
This extrapolates to the granulation problem that I've previously mentioned
with respect to how often (most always) accountics science researchers really
cannot say anything about causality.
"How Non-Scientific Granulation Can Improve Scientific Accountics"
http://www.cs.trinity.edu/~rjensen/temp/AccounticsGranulationCurrentDraft.pdf
**How Statistics Can Mislead
"Young Households Falling Behind in Net Worth," by Barry Ritholtz, June
15, 2013 ---
http://www.ritholtz.com/blog/2013/06/young-households-falling-behind-in-net-worth/
Those averages are deceptive, in that they are
raised by the high wealth of a relatively small number of households. A very
different picture emerges from looking at the median — the level at which
half the households are richer and half poorer. That statistic can be
calculated from the Fed’s triennial survey of consumer finances. In the
studies conducted in the 1990s, the median net wealth was about one-quarter
of the average. In the 2000s, the median fell to about one-fifth of the
average, and in 2010, it was down to about one-sixth of the average.”
Floyd Norris at the NYT
**How to Mislead With Statistics
Question
Is this a really stupid declaration that "most people have no interest in
spreadsheet computing, photo editing, or software development" outside the
office?"
Hint
Most workers probably do more photo editing outside the office rather than
inside the office. Many people keep their personal finances on spreadsheets and
update those spreadsheets at home. And white collar workers take some of their
work home where they work on their own laptops. I would even argue that
professors tend to update their courses and write up research outcomes at home
rather than in the office.
I think Timothy Lee (below) is really being naive about the importance of
laptops both at home and in the office. Yeah I'm retired and have a Kindle Fire
for reading books and watching streaming video on a television set. But over 98%
of the time I'm on my laptops rather than any other electronic device.
When going to trade shows it's easy to be mislead by the promotions of newer
types of electronic devices relative to boring old laptops. But the market
for those new devices is from customers who still own and extensively use their
laptops. Microsoft is plugging hardware like Surface 3 at trade shows, but
the bread and butter sales are sales of Windows 7+ and Windows 8+ operating
systems for laptops and PCs. Buyers tend to pay for those operating systems when
they buy their new computers, and they are buying new computers even though
companies are trying to push other new devices toward computer users.
If you are looking for a new device to buy for your college-bound high school
graduate, the most important device is a laptop computer as the main dish.
Tablet computers are gravy items. Mobile phones, of course, are essential these
days but these are not laptop substitutes.
Laptop advantages include big RAM and the many kinds of ports on a laptop
that are not found on tablets. Laptops also have better keyboards and screens,
although users like me usually connect them to full-sized keyboards and
displays. That way there's not much difference at all between a desktop computer
and a laptop except for greater repair complexities of a laptop. But if the
computer must be shipped off to a repair technician, the laptops are cheaper to
ship.
"The PC is dead, and this year’s CES proves it," by Timothy B. Lee,
The Washington Post, January 8, 2014 ---
http://www.washingtonpost.com/blogs/the-switch/wp/2014/01/08/the-pc-is-dead-and-this-years-ces-proves-it/
. . .
Microsoft is right: if you want to do serious
spreadsheet wrangling, photo editing, or software development, a Chromebook
probably won't cut it. But most people have no interest in doing those
things outside the office. If, like millions of people, you mostly want to
check Facebook, read your email, and watch YouTube videos, then a ChromeBook
works just fine. And ChromeBooks aren't only cheaper, they also avoid many
of the hassles and pitfalls—software updates, malware, baffling error
messages—of Windows PCs. Most users
don't
actually need all the features of a standard PC,
and for them the extra complexity just means more headaches.
Continued in article
Jensen Comment
One frustration for laptop makers like Dell is that laptops last for such a
long time that the long-delayed replacement market can lead to cash flow
problems for laptop manufacturers. How old is the your main laptop computer?
One of my laptops still runs on Windows 7 and the other one runs on XP. I delay
buying a laptop for as long and possible because I don't look forward to the
agony of shifting to Windows 8.1.
Cash flow problems are an even bigger problem for some software companies.
It's not such a problem for companies like Turbo Tax where it's essential to
upgrade at least once per year. But for most other companies like Tech Smith
that sells Camtasia, most Camtasia users are fully satisfied with the versions
they bought five or more years ago. This forces Tech Smith to develop some
enormously significantly upgrades, but this is monumentally difficult to do each
and every year.
My main software program is MS FrontPage that Microsoft no longer sells. For
versions to put on new computers I have to buy legacy from Amazon. Yeah there
are lots of folks that buy and archive unused (virgin) versions of software and
hold it for the resale market years later much like they might store unopened
bottles of wine for resale years later. If you buy a FrontPage installation CD
the CD's case will still be sealed like the day it was boxed up in 1983 or
whatever year.
Buy the way I read where wines really don't improve with age when they are in
bottles. The aging improvements only come when the wine is stored in big casks
--- usually in huge wooden vats for good wine. Incidentally, big wooden wine
vats can be reused for wine aging. Oak scotch vats, on the other hand, cannot be
used for more than one batch of scotch. I don't know whether scotch whiskey
improves with age in a bottle, but I doubt it.
**How to Mislead With Statistics
"Here's The Hamilton Project's chart of median lifetime earnings by college
major, in millions of dollars," by Peter Jacobs, Business Insider,
September 29, 2014 ---
http://www.businessinsider.com/college-majors-biggest-lifetime-earnings-2014-9
Also at
http://www.businessinsider.com/college-majors-biggest-lifetime-earnings-2014-9#ixzz3EnxrY7jG
Full Report ---
http://www.hamiltonproject.org/papers/major_decisions_what_graduates_earn_over_their_lifetimes/
Jensen Comment
These purportedly are only undergraduates without graduate degrees such as
physicians, lawyers, MBAs, CPAs, etc.
It's not clear how the study dealt with five year programs in engineering,
accounting, etc. Most of the programs ranked in this article have popular
five-year programs.
The study also does not indicate how it deals with subsequent tracking into
higher management. For example, more CEOs and CFOs tend track more from
accounting, finance, marketing, management, and economics undergraduates and
graduates than from engineering. Were those people included in the study even
though they are no longer working in the discipline where they graduated?
The study does not deal with unemployment prospects for students who do not
get advanced degrees. For example chemistry, physics, and earth science majors
have relatively poor prospects unless they obtain doctorates. Does the study
exclude physics undergraduates who also obtained physics doctoral degree?
Presumably those science graduates who did move on to graduate school have more
of an unemployment problem than nurses and lower-paid majors like elementary
school teachers.
Also there's a limitation of using medians that ignore standard deviations
and kurtosis. For example, students might be attracted to professions having the
most fewer but much higher salary prospects like finance and information
technology with a lower-end skewness bulge and prospects of enormous salaries
**How to Mislead With Statistics
Obama Era Success
"Safety Net Cut Poverty Nearly in Half Last Year, New Census Data Show,"
by Danilo Trisi, Off the Charts Blog, October 16, 2014 ---
http://www.offthechartsblog.org/safety-net-cut-poverty-nearly-in-half-last-year-new-census-data-show/
Safety net programs cut the poverty rate nearly in
half in 2013, our analysis of
Census data released today finds, lifting 39
million people — including more than 8 million children — out of poverty.
The data highlight the effectiveness of cash assistance
such as Social Security, non-cash benefits such as
rent subsidies and SNAP (formerly food stamps), and tax credits for working
families like the Earned Income Tax Credit (EITC). They also rebut claims,
based on poverty statistics that omit non-cash and tax-based safety
net programs, that these programs do little to reduce poverty.
Accounting for government assistance programs and
taxes cuts the poverty rate for 2013 from 28.1 percent to 15.5 percent, we
found (see chart). These figures are based on Census’ Supplemental Poverty
Measure (SPM), which — unlike the official poverty measure — accounts for
taxes and non-cash benefits as well as cash income. (The SPM also makes
other adjustments, such as taking into account out-of-pocket medical and
work expenses and differences in living costs across the country.)
Safety net programs cut the poverty rate for
children from 27.5 percent to 16.4 percent, we found.
Because the SPM includes taxes and non-cash
benefits, it gives a more accurate picture of the impact of anti-poverty
programs than the official poverty measure, which counts only cash income.
Non-cash and tax-based benefits now constitute a much larger part of the
safety net than 50 years ago, so the official poverty measure’s exclusion of
them masks the nation’s progress in reducing poverty over the last five
decades.
Nevertheless, some policymakers and pundits have
used comparisons based on the official poverty measure to argue that federal
anti-poverty programs are ineffective. As Senator Orrin Hatch, the Finance
Committee’s ranking Republican,
put it last week, “For 50 years we’ve spent
trillions of dollars on massive federal welfare programs that have largely
failed. The poverty rate has remained essentially unchanged since 1967.”
House Budget Committee Chairman Paul Ryan has made
similar
statements.
Comparing poverty rates in the 1960s and today
using the official measure, which doesn’t count programs like SNAP, the EITC,
and rental vouchers, implies that those programs — all of which were small
or nonexistent in the 1960s — do nothing to reduce poverty, which clearly is
not the case. Columbia University researchers using an SPM-like measure
(and adjusting the poverty line for inflation) found that the poverty rate
fell from 26 percent in 1967 to 16 percent in 2012
if one includes this assistance. Today’s Census figures provide further
evidence of the safety net’s strong anti-poverty impact.
**How to Mislead With Statistics: Ignore the Variance and Ignore the Outliers
(in this case graduates without law jobs)
"Why Huge Salaries Don't Necessarily Make Law Grads Rich," bv Akane Otani,
Bloomberg Businessweek, October 22, 2014 ---
http://www.businessweek.com/articles/2014-10-22/law-school-grads-make-good-salaries-but-have-high-debt-and-few-jobs
Graduates of Harvard Law School, among all
the graduate schools in the U.S., make the most money, earning a median
salary of $201,000 once they are 10 years out of school, according to a new
report. Law schools rank higher than other graduate programs when it comes
to salaries, yet skyrocketing debt and
a
thinning job market for law graduates may dampen
the appeal of a J.D.
Harvard Law School, Emory University School of Law,
and Santa Clara University School of Law topped salary
rankings for graduate and professional programs in
a study released Wednesday by compensation-tracking company PayScale. Of the
top 20 schools, 12 were law schools. The rest were business schools.
Despite a few law schools dominating the rankings,
law school graduates did not hold claim to the most lucrative degree on the
market. The median midcareer salary for a law school graduate was $139,300—a
far smaller sum than the figures boasted by the schools that topped
PayScale’s rankings. Considering that the median debt load for law school
graduates
rose to $140,616 in
2012, even a six-figure salary doesn’t sound as glamorous.
What’s more, Payscale’s data didn’t factor in law
school grads who don’t have jobs—and jobs are scarcer for lawyers now than
they have been in years. The employment rate for law school graduates has
dropped six years in a row. “Since 1985, there
have only been two classes with an overall employment rate below [84.5
percent], and both of those occurred in the aftermath of the 1990-91
recession,” the National Association for Law Placement said in a
report this summer. Over the past decade, at least
12 firms, accounting for more than 1,000 lawyers, have shut their
doors. Others are eyeing cuts
among partners.
One reason why a J.D. isn’t a get-rich-quick
guarantee is the wide range of salaries within the field of law. A new
graduate working as a public interest lawyer or for local government will
make an average of $60,000 or less a year, according to the
NALP.
“If you want to be a public defender vs. a
corporate attorney, there is going to be a big difference in terms of
ability to pay off your loans,” says Lydia Frank, editorial and marketing
director for PayScale. “Because there’s such a wide variety in earnings
potential, you can’t assume that any job you’re going to pursue with a J.D.
is going to be equal.”
While the salary rankings may provide a good
benchmark for what’s possible with an elite law degree, great job
connections, and a lucrative specialty, the average would-be lawyer should
think carefully about the return on an investment in legal education.
“If you’re going to take out ‘X’ amount in student
loans, you really want to have a good understanding of the likelihood of
being able to repay that loan in a timely fashion,” Frank says. “I think it
still behooves everybody to really examine things other than salary
potential, such as employment potential for JDs.”
Jensen Comment
Traditionally, accounting graduates who go to work for large CPA firms get great
training and great client exposure. The bad news is that probabilities of
attaining partnerships after 6-10 years are very low. The good news is that
prospects of going to work for clients are high, and new graduates never wanted
the pressures, travel, and time commitments of partnerships in CPA firms in the
first place.
Among the least-wanted pressures are the pressures to obtain new clients via
lots of night and weekend community volunteer work, golf outings that aren't all
that much fun, and selling the firms' services over and over and over year after
year Some of the things that discourage faculty from striving to be college
presidents also discourage staff accountants and lawyers from seeking
partnerships.
My point is that winnings of the highest salaries as partners in both law
and accounting firms are not all they're cracked up to be in terms of job
stress, long hours, frequent travel, glad-handing, broken marriages, neglected
children, etc. Most of the very good lawyers and accountants want no part of
this partnership lifestyle even at much higher compensation. Men and women
partners who are also parents are advised to have spouses who will take on the
chores of child rearing and keeping the home fires burning.
A bummer for finance and marketing graduates is performance-based
compensation. For example, landing that job on Wall Street sounds great until
you realize that your pay is really based upon sales commissions. It's not a
great life unless you really like to spend your days wooing customers to buy
what you're selling (like bonds and derivatives) year after year after year.
**How to Mislead With Statistics (distortions, definitions)
"This graph shows how much money you can earn from each college major,"
by Abby Jackson, Business Insider, December 24, 2015 ---
http://www.businessinsider.com/earning-potential-by-college-major-2015-12
Jensen Comment
This graph is a great illustration of an interactive graphs, although you have
to play around with it some to get the hang of it. For example, if you want to
see the graphs for just "Accounting" click off the box for "All," click the box
for "Accounting," and then scroll down and click on "Apply."
By now many of you are weary of my warnings about such things as definitions,
averages without standard deviations, skewness (kurtosis), etc. For example,
means or medians for "accounting" can be misleading without knowing how
accounting is defined. For example, there's a big difference between what lowly
bookkeepers make versus CPA firm partners and executives in major corporations.
There's a huge difference between what accounting Ph.D. graduates make in
struggling small private colleges versus what they make at Ivy League
universities. Also there's a huge difference in fringe benefits such as housing
subsidies, research stipends, summer pay, and fringe benefits such as
contributions to TIAA/CREF. Also Ph.D. graduates tend to have opportunities for
outside income in book writing and consulting. At a prestigious university like
Harvard, a professor's Harvard salary is likely to be only a small part of total
income.
In general, the biggest problem is in career tracking combined with income
standard deviations. Comparing the lifetime earnings of a cost accountant in
General Electric cannot really be compared with the lifetime earnings of a
partner in a small local public accounting firm really cannot be compared
because some of these partners may top out at $50,000 or more per year whereas
others top out at $500,000 per year after their retirement buyouts are factored
into compensation.
A top accounting graduate typically goes to work for 5-10 years with a large
public accounting firm or the government. However, 80% or more of those
graduates leave (most never intended to stay in public accounting or government
employment) and go to work for in private industry such as when an IRS agent
goes to work at a high level in a corporate tax department. At such time they
often make much more than others who stay in public accounting or government.
The problem is that in studies like the one cited above these "former"
accountants are no longer classified as accountants
such as when a public accountant becomes the CFO or CEO of a large or small
corporation. Hence in studies like the one above a former accountant is excluded
from the 20-year survey of "accountants."
The same problem arises when examining accountants who only have "associates"
degrees. Typically these accounting graduates are no longer "accountants" ten or
20 years out. Some may be CEOs of their own companies and some might earn over
$200,000 per year in stores or plumbing companies that they own. Hence,
I'm extremely suspicious of graphs that compare the
benefits of getting a Ph.D. versus an associates degree in accounting.
The problem is that most associates or bachelors degree holders either dropped
out of the labor market (such as to have babies) or became entrepreneurs who are
no longer classified as "accountants."
Problems like those mentioned above become exacerbated when comparing types
of degrees such as accounting versus culinary arts versus creative writing.
Conclusion
The bottom line is that studies like this are so misleading and dangerous that I
wish they did not get published.
Bob Jensen's threads on careers are at
http://www.trinity.edu/rjensen/bookbob1.htm#careers
**How to Mislead With Charts
"How to Lie with Charts," Harvard Business Review, December 2014
---
https://hbr.org/2014/12/vision-statement-how-to-lie-with-charts
The above link is only a teaser. You have to pay to see the rest of the article.
"BP Misleads You With Charts," by Andrew Price, Good Blog, May
27, 2010 ---
Click Here
http://www.good.is/post/bp-misleads-you-with-charts/?utm_source=feedburner&utm_medium=feed&utm_campaign=Feed%3A+good%2Flbvp+%28GOOD+Main+RSS+Feed%29
"Correlation or Causation? Need to prove something you already believe?
Statistics are easy: All you need are two graphs and a leading question," by
Vali Chandrasekaran, Business Week, December 1, 2011 ---
http://www.businessweek.com/magazine/correlation-or-causation-12012011-gfx.html
How to Mislead With Statistics
"Reminder: The FBI’s ‘Police Homicide’ Count Is Wrong," by Reuben
Fischer-Baum, Nate Silver's 5:38 Blog, November 12, 2014 ---
http://fivethirtyeight.com/datalab/reminder-the-fbis-police-homicide-count-is-wrong/
How to Mislead With Statistics
"Some Stats Are Just Nonsense," by Cullen Roche, Pragmatic Capitalism
via Business Insider, November 15, 2014 ---
http://www.businessinsider.com/historical-statistical-and-nonsensical-2014-11
How to Mislead With Statistics
Common Accountics Science and Econometric Science Statistical Mistakes ---
http://www.cs.trinity.edu/~rjensen/temp/AccounticsScienceStatisticalMistakes.htm
**How to Mislead With Statistics
There's a
Lake Wobegon Effect Inside Every New York K-12 School
"Cuomo’s Grade Inflation," by Alysia Finley, The Wall Street Journal,
December 22, 2014 ---
http://www.wsj.com/articles/political-diary-cuomos-grade-inflation-1419279956?tesla=y&mod=djemMER_h&mg=reno64-wsj
Nothing quite motivates New York Gov. Andrew Cuomo
like bad publicity. Last Thursday—mere days after the state’s new and
putatively improved teacher-evaluation system was exposed as a sham—a top
aide to Mr. Cuomo revealed the Democratic governor’s heretofore undetected
interest in aggressive school reform.
Earlier in the week, the state Board of Regents had
reported that nearly 96% of teachers statewide were rated “effective”
(53.7%) or “highly effective” (41.9%) under New York’s new evaluation
system. Fewer than 1% of teachers were deemed “ineffective.” Grades for
principals were similarly inflated, with 93.5% receiving good marks.
New York’s teacher evaluations were widely panned:
How could so many teachers and principals be excelling when, according to
the state, only 34.8% of students are proficient in math and 31.4% in
English?
Mr. Cuomo’s director of state operations, Jim
Malatras, shot off a missive to state Education Commissioner John King and
Board of Regents Chancellor Merryl Tisch calling the failing status quo
“unacceptable. “How is the current teacher evaluation system credible when
only one percent of teachers are rated ineffective?” Mr. Malatras wrote.
Last year the governor hailed the new teacher
evaluations as “one of the strongest in the country.” Yet school districts
receive wide latitude on how to assess teachers. Only 20% of the evaluation
must be based on student learning.
But don’t blame Mr. Cuomo for the “unacceptable”
state of schools. “As you know, the Governor has little power over
education, which is governed by the Board of Regents,” wrote Mr. Malatras.
Ostensibly, that’s why Mr. Cuomo is soliciting the Board’s input before
pursuing “an aggressive legislative agenda” next year.
Mr. Malatras asked Mr. King and Ms. Tisch for their
thoughts about removing bad teachers; changing teacher training; providing
financial incentives for high-performing teachers; overhauling teacher
tenure; raising the charter school cap; and modifying mayoral control of New
York City schools.
Asking for feedback is all very well, but Mr. Cuomo
here is merely looking for cover. The governor would win more credit as a
leader if he weren’t always punting decisions (tax reform, fracking) to
state bureaucrats to avoid leaving political fingerprints. One might
describe his governing style as an invisible hand.
Continued in article
Bob Jensen's threads on grade inflation ---
http://faculty.trinity.edu/rjensen/assess.htm#RateMyProfessor
**How to Mislead With Science Reports
From the Scout Report on December 12, 2014
Level Money ---
https://levelmoney.com
Designed for millennials who need a little help with budgeting, the Money
Level app is good looking and easy to use. The goal is to "create a secure
future for the next generation" by promoting smart, everyday financial
decisions. An accompanying Blog is also accessible from this site and offers
great posts, such as "7 Things You Need to Know about Student Loan
Refinancing" and "Mobile Banking in Public: Staying Safe and Secure." Level
Money is available for Android 4.0+ and iOS 7.0+.
Bob Jensen's personal finance helpers ---
http://www.trinity.edu/rjensen/Bookbob1.htm#InvestmentHelpers
Nearpod ---
http://www.nearpod.com
If you're a teacher who uses technology as a way to present information
in a creative and engaging way, then Nearpod might be a welcome addition to
your interactive curriculum. It combines presentation, collaboration, and
real-time assessment tools into a single, integrated program. Users can
create their own presentations or select from a number of Ready-to-Use
Nearpods. Note, there are four pricing options for education users- the
Silver Edition is free. Nearpod is multiplatform, allowing teachers and
students to interact through iOS devices, Android devices, Windows 8.1
devices, tablets, and any PC or MAC
Exaggeration of Scientific Claims Is Already Present in Academic Press
Releases, New Study Finds
The Point When Science Becomes Publicity
http://www.theatlantic.com/health/archive/2014/12/as-academia-melts/383570/2/
Science and health news hype: where does it come from?
http://www.theguardian.com/science/blog/2014/dec/10/science-health-news-hype-press-releases-universities
Most Exaggeration in Health News is Already Present in Academic Press
Releases
http://medicalxpress.com/news/2014-12-exaggeration-health-news-academic.html
The association between exaggeration in health related science news and
academic press releases: retrospective observational study
http://www.bmj.com/content/349/bmj.g7015
Preventing Bad Reporting on Health Research
http://www.bmj.com/content/349/bmj.g7465
Are Scientists Themselves to Blame for Exaggerated Claims in Science
Journalism?
http://scholarlykitchen.sspnet.org/2012/09/17/are-scientists-themselves-to-blame-for-exaggerated-claims-in-science-journalism/
*
*How to Mislead With Statistics
(Definitions, Distortions)
How Much Accountants And Tax Preparers Earn In Every State --
https://taxprof.typepad.com/taxprof_blog/2019/02/how-much-accountants-and-tax-preparers-earn-in-every-state.html
Jensen Comment
I could make my usual criticisms such as cost of living differences and state
taxation differences that overwhelm the supposed earning differences by state.
I could also criticize the BLS mean statistics as not being accompanied with
data on variances and skewness.
Averages get distorted by wages of newly-hired college graduates mixed in with
employees having years of experience.
In tax season a whole lot of overtime gets paid to accountants who are tax
preparers where not so much overtime gets paid to accountants who don't work in
tax.
But mostly I will focus on the vagueness of what is a "an accountant and tax
preparer." Some are entrepreneurs and partnerships (including LLC corporations),
those equity owners of accounting firms. And accounting firms vary in size
from no employees to thousands of employees. And those firms most likely mix
revenues from tax preparation to systems consulting to auditing to whatever. It
would be misleading merge what partners make with the salaries they pay their
employee "accountants and tax preparers." And those salaries paid to employees
probably have a lot of benefits not picked up in the BLS data such as profit
sharing and bonuses and fringe benefits such as expensive training and day care
subsidies.
My basic point is
that "owners" of accounting firms are still doing a lot of the accounting,
auditing, consulting, and tax work alongside their employees. Public accounting
(and law) firms are not like NFL teams where owners are in the luxury
boxes and not getting knocked around on the playing fields. What is paid to an
employee in "salary" is typically only paid for the first 5-10 years until
employees either become part owners of the firm or are moved out of public
accounting into business firms or government (think FBI).
You just cannot compare what public accountants make in "salaries" with what
accountants make in business firms and government where accountants spend their
entire careers living on "salaries."
Most
public accountants are only on "salaries" for the first 5-10 years of their
careers.
After that they're working
owners
and no longer "public accountants working for owners."
And now we get to the most important reason the salaries
in the above article are so low. The problem is definitional. CPAs having
masters degrees are mixed in with "accountants and tax preparers" who might've
never graduated from high school. The non-CPAs' low
salaries drag down the BLS mean averages. Most candidates for the CPA
exam have masters degrees since they have to have 150 or more college credits to
even sit for the CPA exam.
**How to Mislead With Statistics: The crime wave is a myth (incomplete
analysis)---
http://www.businessinsider.com/crime-wave-myth-2016-10
Jensen Comment
I agree with most of the opinions voiced in the above article. However, on the
other side fo the coin police enforcement of some types of crime is down. If
police continued or increased enforcement of those crimes the total crime would
be up in the USA. I'm talking first about drug crimes where police are often no
longer arresting people for drug possession, especially marijuana and heroin.
One reason is that arrests for such crimes are futile since punishment for such
crimes is nearly zero.
Also in our larger cities I think all the bad publicity of blacks being
persecuted by police is leading to weaker enforcement of crimes where blacks are
the victims. This is a an unfortunate negative effect of "Black Lives Matter"
movement. Black lives are no longer being protected as well as they used to be
by police, especially in our larger cities. That, however, is my opinion that
will be hard to back up with facts since so many black-victim crimes such as
rapes, prostitution, and extortion are not even reported to get into the crime
databases.
Charter Schools in the USA
---
https://en.wikipedia.org/wiki/Charter_schools_in_the_United_States
Like most other types of schools there are great examples and lousy examples of
charter schools ---
https://en.wikipedia.org/wiki/Charter_schools_in_the_United_States#National_evaluations
**How to Mislead With Statistics (Incomplete Analysis)
Compare Public Schools With Charter Schools With Home Schools
Comparisons of student performance in different types of schools can be highly
misleading. The biggest reason is that
students are not randomly assigned to these three types of schools.
All have superior learning students. But charter schools and home schools tend
to
have a greater proportion of students who have higher-end learning abilities.
Home schools obviously have small classes, usually one-on-one learning combined
with a lot of self-learning from materials (such as CD files) specially prepared
home school students.
Public schools, especially in urban areas, tend to have larger classes than
charter schools.
Public schools, however, may have the best teachers
because salaries and benefits are often better in public schools. One drawback
of public schools, however, is that unions made it virtually impossible to fire
bad teachers and teachers who habitually don't show up or are late for work.
Inability to fire or sanction inattentive teachers is the leading complaint
about public school unions relative to charter schools who have non-union
teachers.
**How to mislead with scientific claims (incomplete
analysis)
101 things you thought were true, but have actually been debunked by science ---
http://www.businessinsider.com/worst-science-health-myths-2016-1
Jensen Comment
Some claims in this article nobody thinks are literally true. It would be dumb
to literally think that an apple a day keeps the doctor away.
Some answers given as being "debunked in science" are not totally debunked. For
example, scientists do not really claim that milk is not good for most people.
Some claims about milk are controversial and questionable, but milk is a food
item that can be good for you in moderation.
In fact my gut feeling is that many of the "debunking
claims" in this article are overstated.
H*ow to Mislead With Statistics
Unemployment by Occupation 2014 ---
http://247wallst.com/investing/2015/01/16/unemployment-by-occupation-2014/
Jensen Comment
Here are a few reasons why unemployment statistics can be misleading:
- Workers often leave jobs voluntarily who virtually cannot be fired. For
example federal and state civil service employees often leave to enter
higher paying jobs in the private sector or to become full-time parents, but
try firing a civil service employee who is performing terrible on the job or
is a chronic absentee at work
- Workers who are vulnerable at early stages of employment often become
locked into job security with seniority or tenure. Examples include K-12
teachers and college professors.
- Unemployment rates can be misleading indicators of job availability. For
example, physical scientists may have low unemployment rates but a Ph.D.
degree in a physical science discipline does not open many doors to a job as
a full-time professor or scientist in general. There's an old joke about how
many geologists can fit into a pickup truck. The answer is only two with
their lawnmowers.
- Unemployment rates vary greatly with location. For example, employment
as a welder is almost guaranteed for welders seeking work in oil fields and
along pipeline construction, but try finding job as a welder in tens of
thousands small rural towns in the USA.
- Employment varies with willingness to take on risks. For example, it's
very common for some jobs to compensate on a sales commission basis with
very little pay guarantees. This often leads to high unemployment rates in
some jobs that are relatively easy to find because of compensation risks.
The bottom line is that unemployment rates can be very misleading when
choosing an intended career. There are many, many more important criteria.
Bob Jensen's threads on careers ---
http://www.trinity.edu/rjensen/Bookbob1.htm#careers
**How to Mislead With Statistics (uncomplete analysis, definitions_
"Is Law School a Better Investment Than Med School?" by Casey Sullivan,
FindLaw, December 4, 2015 ---
http://blogs.findlaw.com/greedy_associates/2015/12/is-law-school-a-better-investment-than-med-school.html
. . .
Lawyers have a median student debt of $89,926, 90
percent of their median salary ($100K), whereas doctors have a median debt
of $130,641, 98 percent of their median salary ($133K). Furthermore, the
average starting salary of lawyers in the private sector is $84K, compared
to the $55K doctors make in residency.
Continued in article
Reply from Paul Caron on December 10, 2015---
http://taxprof.typepad.com/taxprof_blog/2015/12/is-law-school-a-better-investment-than-medical-school.html#more
. . .
The news
comes from Credible, an online student loan
refinancing company. Credible looked at its data
for lawyers, doctors, teachers, and other
professions, to find out which degrees had the
highest return on investment. That data suggests
that a J.D. has a better ROI than an M.D.
According to Credible:
Lawyers have a median student
debt of $89,926, 90 percent of their median
salary ($100K), whereas doctors have a median
debt of $130,641, 98 percent of their median
salary ($133K). Furthermore, the average
starting salary of lawyers in the private sector
is $84K, compared to the $55K doctors make in
residency.
So, congrats, lawyers. We're
financial geniuses!
There are, of course, a few
caveats. ... According to the Bureau of Labor
Statistics, doctors might make a bit more than
Credible reports. The annual mean wage for
doctors generally is
about $195,000 a year. For pediatricians,
the median annual wage is $163,000. For
surgeons, the
mean is $240,440. (We know,
mean isn't the same as median, but many
doctor salaries are so high that the BLS doesn't
bother reporting median wages.) That would make
doctor debt a much smaller percentage of income
than lawyers'.
Here's
one of the problems when comparing incomes of lawyers versus doctors
https://www.businessinsider.com/highest-paying-job-in-every-us-state-2019-2
Note that there are much higher proportions of low income lawyers than doctors
such that medians and means are pulled down for lawyers --- thereby make those
statistics distorted.
Jensen Comment
The article is far more misleading than just for things mentioned by Paul Caron.
Firstly, the analysis is based upon mean averages without an analysis of
distributions. Means are especially misleading because they are impacted by
outliers. Secondly, the analysis fails to compare differences in how lawyers and
doctors are compensated. Lawyers tend to receive relatively low maintenance
salaries with much greater contingency awards depending upon lawsuit successes
and rewards for drawing in clients. Physicians tend to have less trouble
attracting patients and are paid on the basis of procedures and volume of
patients. General practitioners get compensated better for high patient volume.
Surgeon rewards come for the procedures where brain surgeons and organ
transplant surgeons are paid much more for procedures than general surgeons.
There's also great variation in compensation based upon opportunity for
overtime and utilization of that opportunity. I recall a Stanford University
study that concluded male physicians tended to make more due to the lower
propensity of many females to take on overtime. For example, female physicians
often prefer to be emergency room specialists where there are fixed hours per
week with little or no obligation for patient follow up in hospitals. Of course
there are wide variations in such conclusions as evidenced by the many female
pediatricians who have considerable opportunities for and obligations for
overtime.
In truth the averaging analysis combines too many unlike things such as
averaging compensation for general practitioners and the many, many specialty
physicians having great variations in compensation and costs of becoming
specialists. The same can be said of lawyers who have greatly varying
compensation depending upon specializations.
Averages across specialties are more misleading than helpful.
**How to Mislead With Statistics (definitions, incomplete analysis)
Bacon report serves up baloney
by Tom Shattuck, The Boston Harold, October 27, 2015 ---
http://www.bostonherald.com/news/columnists/tom_shattuck/2015/10/shattuck_bacon_report_serves_up_baloney
**How to Mislead With Statistics: FactChecking
the Democratic Debate
http://www.msn.com/en-us/news/politics/factchecking-the-democratic-debate/ar-AAfqLFX?ocid=spartandhp
Myers-Briggs Personality Test ---
https://en.wikipedia.org/wiki/Myers%E2%80%93Briggs_Type_Indicator
**How to Mislead With Statistics
"Why the Myers-Briggs test is totally meaningless," by Joseph Stromberg
and Estelle Caswell, Vox, October 8, 2015 ---
http://www.vox.com/2014/7/15/5881947/myers-briggs-personality-test-meaningless
The Myers-Briggs Type Indicator is probably the
most widely used personality test in the world.
About 2 million people take it annually, at the
behest of corporate HR departments, colleges, and even government agencies.
The company that produces and markets the test makes around $20 million off
it each year.
The only problem? The test is completely
meaningless.
"There's just no evidence behind it," says Adam
Grant, an organizational psychologist at the University of Pennsylvania
who's written about the shortcomings of the Myers-Briggs previously. "The
characteristics measured by the test have almost no predictive power on how
happy you'll be in a situation, how you'll perform at your job, or how happy
you'll be in your marriage."
The test claims that, based on 93 questions, it can
group all the people of the world into 16 different discrete "types" — and
in doing so, serve as "a powerful framework for building better
relationships, driving positive change, harnessing innovation, and achieving
excellence." Most of the faithful think of it primarily as a tool for
telling you your proper career choice.
But the test was developed in the 1940s based off
the totally untested theories of Carl Jung and is now thoroughly disregarded
by the psychology community. Even Jung warned that his personality "types"
were just rough tendencies he'd observed, rather than strict
classifications. Several analyses have shown the test is totally ineffective
at predicting people's success in various jobs, and that about half of the
people who take it twice get different results each time.
Yet you've probably heard people telling you that
they're an ENFJ (extraverted intuitive feeling judging), an INTP
(introverted intuitive thinking perceiving), or another one of the 16 types
drawn from his work, and you may have even been given this test in a
professional setting. Here's an explanation of why these labels are so
meaningless — and why no organization in the 21st century should rely on the
test for anything.
Continued in article
Robustness Statistics ---
https://en.wikipedia.org/wiki/Robust_statistics
**How to Mislead With Statistics
State gun laws, gun ownership, and mass shootings in the US: cross
sectional time series ---
https://www.bmj.com/content/364/bmj.l542
Outcome variables
We used the Supplementary Homicide Reports from the Federal Bureau of
Investigation’s Uniform Crime Reporting System (1998-2015) to obtain counts
of mass shootings by state. We compiled these data in line with the most
commonly used definition of a mass shooting: one event in which
four or more individuals were killed by a perpetrator using a firearm and
the perpetrator themselves did not count toward the total number of victims.
These mass shooting events were analyzed in total and stratified as to
whether the mass shooting was domestic or non-domestic in nature. Domestic
mass shootings included instances where the perpetrator committed the act
against an immediate family member or partner. Non-domestic mass shootings
included all other types of relationships, such as acquaintances, employees,
employers, friends, neighbors, strangers, extended family members, and
others. Florida was excluded due to non-participation in the Uniform Crime
Reporting System program.
Jensen Comment
The above article is badly misleading in that its conclusions are based largely
on rounding error in computing averages and denominator effects that destroy
robustness. The study focuses on rare events, it's conclusions and displays are
unstable to slight sensitivity analysis.
I will focus my criticisms on Figure 2 where Rhode Island, Delaware, New
Hampshire, North Dakota, and Arkansas each have rounded averages of zero mass
shootings across 17 years. There were mass shootings in those five states, but
their averages round to zero. The worst state in Figure 2 is Vermont that
has the highest average of three mass shootings across those same 17 years. Thus
the lowest five states have zero mass shooting averages and the highest state
has an average of three mass shootings. The difference from lowest to highest
(in Figure 2) I suspect is heavily to heavily be rounding error and is not as
significant as it appears in Figure 2.
There also is what is known as a denominator effect that destroys robustness
in Figure 2 due to the low population of 600,000 people in Vermont. Such a low
population destroys much of the robustness in comparing the highest mass killing
state (Vermont) with more populated states like California, New York, Arkansas
and Delaware. The same applies to low population states of Wyoming, Montana,
North Dakota, New Hampshire, and Alaska.
The study concludes as follows:
Discussion
Our analyses show that US state gun laws have become more permissive in
recent decades, and that a growing divide in
rates of mass shootings appears to be emerging between restrictive and
permissive states. A 10 unit increase in the
permissiveness of state gun laws was associated with an approximately 9%
higher rate of mass shootings after adjusting for key factors. A 10%
increase in gun ownership was associated with an approximately 35% higher
rate of mass shootings after adjusting for key factors. On the absolute
scale, this means that a state like California, which has approximately two
mass shootings per year, will have an extra mass shooting for every 10 unit
increase in permissiveness over five years. It will also have three to five
more mass shootings per five years for every 10 unit increase in gun
ownership. These results were also consistent across multiple analyses and
when stratified as to whether or not mass shootings were committed by
someone in a close relationship with the victims.
I contend that the above conclusion is unstable (not robust) such as the
conclusion that a restrictive state like Rhode Island has a hugely greater
divide (an average of zero mass shootings per year) with a permissive state
Vermont (with an average of three average mass shootings) --- a conclusion
that does not, based upon this study, justify legislation for more restrictive
gun laws to reduce mass shootings. The authors of the above study are not
responsible in pointing out the lack of robustness in their displays and
discussion. For example the five states shown in Figure 2 to have zero average
mass shootings all had mass shootings that were so rare they rounded to zero.
The worst state (Vermont) had an average rounded up to three in Figure 2. But in
reality the difference between the worst state (Vermont) and the five best
states is not really 3-0 = 3. This difference is
somewhat due to rounding differences combined with denominator effects rather
than robust statistical outcomes.
The first rule of statistical analysis is discuss the robustness of the
outcomes. The above study lacks a robustness analysis.
**How to Mislead With Statistics
For years, the estimates of nonfatal gunshot injuries published by the
Centers for Disease Control and Prevention have grown increasingly unreliable
---
https://fivethirtyeight.com/features/how-one-hospital-skewed-the-cdcs-gun-injury-estimate/
**How to Mislead
With Statistics
The state of the world's seas is often painted as verging on catastrophe. But
although some challenges are very real, others have been vastly overstated,
researchers claim in a review paper. The team writes that scientists, journals
and the media have fallen into a mode of groupthink that can damage the
credibility of the ocean sciences. The controversial study exposes fault lines
in the marine-science community.
Daniel Cressey, Nature, January 18, 2015 ---
http://www.nature.com/news/ocean-calamities-oversold-say-researchers-1.16714
**How to Mislead
With Statistics: 2014 Was Not the Hottest Year on Record
"2014 Hottest Year on Record, Says NOAA: Climate Models Still Wrong on Trend,"
by Ronald Bailey, Reason Magazine, January 16, 2015 ---
http://reason.com/blog/2015/01/16/2014-hottest-year-on-record-says-noaa-cl
. . .
So global average temperature is not increasing at
the rate of about 0.3 degree Celsius (0.54 degree Fahrenheit) per decade
that is the average of the climate models relied upon by the
Intergovernmental Panel on Climate Change (IPCC). Regarding the 17 year
slow-down in global temperature increases, the IPCC's
Synthesis Report just released in November
notes:
The observed reduction in surface warming trend
over the period 1998 to 2012 as compared to the period 1951 to 2012, is
due in roughly equal measure to a reduced trend in radiative forcing and
a cooling contribution from natural internal variability, which includes
a possible redistribution of heat within the ocean (medium confidence).
The rate of warming of the observed global mean surface temperature over
the period from 1998 to 2012 is estimated to be around one-third to
one-half of the trend over the period from 1951 to 2012. …
For the period from 1998 to 2012, 111 of the
114 available climate-model simulations show a surface warming trend
larger than the observations…. The difference between models and
observations may also contain contributions from inadequacies in the
solar, volcanic, and aerosol forcings used by the models and, in some
models, from an overestimate of the response to increasing greenhouse
gas and other anthropogenic forcing (the latter dominated by the effects
of aerosols).
Shorter: The climate models could be wrong for all
sorts of reasons.
Last week, I reported that the satellite data shows
that
2014 was the third warmest year in that record.
University of Alabama in Huntsville climatologist John Christy noted:
2014 was the third warmest year in the 36-year
global satellite temperature record, but by such a small margin (0.01 C)
as to be statistically similar to other recent years, according to Dr.
John Christy, a professor of atmospheric science and director of the
Earth System Science Center at The University of Alabama in Huntsville.
“2014 was warm, but not special. The 0.01 C difference between 2014 and
2005, or the 0.02 difference with 2013 are not statistically different
from zero. That might not be a very satisfying conclusion, but it is at
least accurate.”
The 2014 average temperature anomaly also is in
keeping with temperatures since late 2001, when the global average
temperature rose to a level that is generally warmer than the 30-year
baseline average. The most recent 13 complete calendar years, from 2002
through 2014, have averaged 0.18 C (about 0.33 degrees Fahrenheit)
warmer than the 30-year baseline average, while the global temperature
trend during that span was a warming trend at the rate of +0.05 C per
decade — which is also statistically insignificant.
In other words, as hot as 2014 is, there is still
no sign of a speed up in the rate of global average temperature increase.
**How to Mislead With Statistics
"Women with MBAs face a gender-based pay divide that starts as soon as they
graduate, and plagues them throughout their careers," by Natalie Kitroeff
and Jonathan Rodkin, Bloomberg, October 20, 2015 ---
http://www.bloomberg.com/news/articles/2015-10-20/the-real-cost-of-an-mba-is-different-for-men-and-women?cmpid=BBWGP102115_BIZ
As far as investments go, business school is an
unimpeachable bet for young professionals who can muster $100,000. MBAs, who
are typically in their early 30s and have already spent a few years in the
workforce, saw their salaries triple within eight years of graduation. They
also report consistently high levels of job satisfaction and career growth,
according to a survey of thousands of alumni conducted by Bloomberg
Businessweek as part of the magazine’s annual ranking of business schools.
But that general contentment hides a troubling divide: Within a few years of
graduation, women with MBAs earn lower salaries, manage fewer people, and
are less pleased with their progress than men with the same degree.
Each year, we rank business schools by polling
students on topics such as academics, career services, and campus climate.
We also ask employers about skills they seek in MBA hires and which schools
best prepare their graduates. This year, for the first time, we surveyed
alumni who graduated six to eight years ago, asking them how well their
degrees had delivered on the promise of a fulfilling, well-paid job. The
12,773 responses we collected offer a wealth of salary information and other
data on MBAs working in a variety of industries.
The inclusion of the alumni responses helped propel
Harvard Business School to the top of the 2015 rankings. HBS alums reported
the largest gains in compensation and many attributed their success to their
alma mater. Last year’s No. 1, Duke Fuqua School of Business, slipped to
eighth overall, partly because of a comparatively lackluster job placement
rate of 86.1 percent, which is below the 87.9 percent rate overall.
Women and men start their post-MBA careers earning
almost the same money—$98,000 for women and $105,000 for men—according to
our survey of those who graduated from 2007 through 2009. But the gap then
widens sharply. By 2014 men hauled in a median of $175,000 and women,
$140,000. That means employers pay women 80 percent of what men with the
same degree take home.
Continued in article
Jensen Comment
I want to start out by saying that I believe there are differences in
compensation levels by gender. However, the article above, and virtually every
other related article I've ever encountered, does not probe very deep to uncover
possible reasons for the so-called gender salary gap. First I want to compliment
the authors for using medians rather than mean averages. This is the first thing
I look for because means can be skewed by outliers more easily than medians.
Let me begin by noting that what are outliers in smaller populations can also
be outliers in large populations but there are randomly more such outliers in
large populations. It was always surprising in the NBA when the Houston Rockets
imported
Yao Ming, a 7-foot 6 inch Chinese center. In both the USA and China Yao Ming
is an outlier in terms of height ---
https://en.wikipedia.org/wiki/Yao_Ming
In terms of population the USA has an estimated population of slightly
over 320 million people. China has an estimated 1,376 million people. People
over seven feet tall are outliers in both the USA and China. However, the odds
of having many more people over seven feet tall are much greater in China than
the USA due to the sheer difference in the populations of these two nations.
In a random sample of 320 female MBA graduates and a random sample of 1,376
male graduates one would expect that the mean and median salaries of the men
would be higher than the women due to random chance because there are many more
high-salaried outliers in the larger sample of males. Since the lower salaried
men and women are bounded by zero the means
and medians of the random samples are driven upward by the higher salaried men
and women. Suppose we designated a high salary as anything over $200,000. One
would expect more high salaried men than women in these two samples due to the
difference in the sample sizes.
It's the bottom part of the salary distribution where gender analysis becomes
more complicated. In a random world one would expect to find more zero-salaried
men than women in the above samples due to the sample size differences. However,
here is where the real world is not random because statistically female MBA
graduates in reality have a higher probability of not entering or soon dropping
out of the work force to devote full time or nearly full time to mothering their
new babies.
As a result statistical analysis showing higher mean or median salaries among
the 1,376 males is not probably as much due to hiring and promotion bias due to
gender as it is to such complications as having more male MBA graduates than
female graduates and the higher probability that a female will leave the
full-time work force at least during the early years of raising children.
Of course all of this becomes more complicated when the number of female
graduates becomes larger relative to male graduates. I think there are still
more male MBA graduates, but in terms of accounting graduates the number of
females now exceeds the number of male graduates. Also the large public
accounting firms are hiring more female than male graduates. Carried to extremes
suppose that we randomly sample 1,376 female accounting graduates and 321 male
accounting graduates. My hypothesis is that the mean and median salaries of the
females will exceed those of the males after five years of employment. Of course
these averages may differ for the entire populations of accounting graduates
because the gender differences among all accounting graduates is closer to 50/50
than 1,376/321.
There are other complications in this analysis. My opinion is that
newly-hired male and female graduates joining a given local office of a Big Four
firm will earn the same starting compensation. However, the new hires in the San
Francisco local office will have higher salaries than the San Antonio office of
a given firm based upon huge differences in costs of living in these two cities.
To do a complete gender analysis we would have to factor in whether there are
gender differences based upon cost of living in local offices. Do mothers tend
to prefer or avoid San Francisco vis-a-vis San Antonio? It's certainly more
complicated to both work full time and raise young children in San Francisco
where rents are now higher than anywhere in the USA. Hence one would expect
mothers to prefer San Antonio relative to San Francisco. One would expect more
females moving away from the San Francisco office once they became mothers.
My point is that one has to be very careful when it comes to inferring gender
bias causality in most any type of statistical analysis beyond the usual problem
of spurious correlation. I think most studies of gender differences in salaries
do not delve deeply enough into the really complicated factors affecting
statistical analysis outcomes.
But I do still believe there is gender bias against mothers of young children
in terms of employment and compensation. I'm not convinced there's such a degree
of bias against those women who are not mothers of young children.
"The 100 Best Companies For Working Moms," by Jacquelyn Smith,
Working Mothers Magazine via Business Insider, September 16, 2014 ---
http://www.businessinsider.com/best-companies-for-working-moms-2014-9
The largest CPA firms are among the best places for moms to be employed.
Bob Jensen's threads on careers ---
http://www.trinity.edu/rjensen/Bookbob1.htm#careers
Bob Jensen's threads on the histories of women in the professions ---
http://www.trinity.edu/rjensen/Bookbob2.htm#Women
**How to Mislead With Statistics (incomplete
analysis)
Here's how much surgeons, lawyers, and 18
other top-earning professionals make per hour ---
http://www.businessinsider.com/hourly-salaries-surgeons-lawyers-doctors-2016-11/#-1
Jensen Comment
This articles is one of the best/worst articles I've seen lately on how to lie
with statistics.
Here are a few things to point out to your students if you want to highlight
how not to report survey results.
First and foremost when you define the total populations (apart from sample
sizes) and don't mislead about the sizes of the populations.
For example, the above article says there 15,650 physicists. Aren't professors
and other teachers in physics "employed?" There are more physicists employed
only in academia than 15,650..
Most likely the average hourly wage would be greatly pulled down if academics
were included in the population and the sample.
Secondly the article ignores standard deviations and kurtosis of the
distributions from which averages are reported. For example, outliers in
millions of dollars of compensation to attorneys and other professionals tend to
skew averages upward. Even medians can be misleading for highly skewed
distributions with outliers on both sides of the medians.
Think of all those lawyers who
will work for food.
How random are the samples from the populations identified in the study. My
guess is not very random.
Watch definitions.
What is a "chief executive?" The manager-owner of our local hardware store is a
"chief executive" as is the CEO of a Fortune 500 Corporation.
What's the definition of a "financial manager versus a "sales manager?" Why are
there twice as many financial managers as sales managers?
What's the definition of "public relations and fundraising managers" and why are
there only 60,380 of them when there are 531,161 financial managers? Many
financial managers and chief executive officers and are also the public
relations and fund raising managers. My guess is that the sampling population
totally ignored public relations and fund raising managers for colleges,
universities, churches, and charities where compensation is often quite low or
contingent upon funds raised.
What's the difference between a pharmacist and the chief executive? Many
pharmacists also own and manage the entire drug store?
What's "compensation?" Most CEO's of Fortune 500 companies get paid on
performance-based contracts depending upon such things as corporate earnings
reports. In other words what a CEO makes one year may be doubled or tripled the
next year and then taken way down the following year.
What's "compensation?" Most CEOs are paid in many ways including stock
options, stock awards programs, living benefits (use of the corporate jets and
ski chalets, wine, women, and song).
There's an enormous difference
between what a physician makes before or after malpractice insurance and other
expense expenses. Those that work for much lower annual salaries often do not
have to pay their own malpractice insurance, nurse expenses, receptionist
expenses, accounting expenses, office rental expenses, etc.
I could go on and on, but I think students will catch my drift.
This article is so misleading it's worse than
garbage.
**How to Mislead With Statistics (incomplete analysis)
"This graph shows how much money you can earn
from each college major," by Abby Jackson,
Business Insider, December 24, 2015 ---
http://www.businessinsider.com/earning-potential-by-college-major-2015-12
Jensen Comment
This graph is a great illustration of an interactive graphs, although you have
to play around with it some to get the hang of it. For example, if you want to
see the graphs for just "Accounting" click off the box for "All," click the box
for "Accounting," and then scroll down and click on "Apply."
By now many of you are weary of my warnings about such things as definitions,
averages without standard deviations, skewness (kurtosis), etc. For example,
means or medians for "accounting" can be misleading without knowing how
accounting is defined. For example, there's a big difference between what lowly
bookkeepers make versus CPA firm partners and executives in major corporations.
There's a huge difference between what accounting Ph.D. graduates make in
struggling small private colleges versus what they make at Ivy League
universities. Also there's a huge difference in fringe benefits such as housing
subsidies, research stipends, summer pay, and fringe benefits such as
contributions to TIAA/CREF. Also Ph.D. graduates tend to have opportunities for
outside income in book writing and consulting. At a prestigious university like
Harvard, a professor's Harvard salary is likely to be only a small part of total
income.
In general, the biggest problem is in career tracking combined with income
standard deviations. Comparing the lifetime earnings of a cost accountant in
General Electric cannot really be compared with the lifetime earnings of a
partner in a small local public accounting firm really cannot be compared
because some of these partners may top out at $50,000 or more per year whereas
others top out at $500,000 per year after their retirement buyouts are factored
into compensation.
A top accounting graduate typically goes to work for 5-10 years with a large
public accounting firm or the government. However, 80% or more of those
graduates leave (most never intended to stay in public accounting or government
employment) and go to work for in private industry such as when an IRS agent
goes to work at a high level in a corporate tax department. At such time they
often make much more than others who stay in public accounting or government.
The problem is that in studies like the one cited above these "former"
accountants are no longer
classified as accountants such as when a public accountant becomes the
CFO or CEO of a large or small corporation. Hence in studies like the one above
a former accountant is excluded from the 20-year survey of "accountants."
The same problem arises when examining accountants who only have "associates"
degrees. Typically these accounting graduates are no longer "accountants" ten or
20 years out. Some may be CEOs of their own companies and some might earn over
$200,000 per year in stores or plumbing companies that they own. Hence,
I'm extremely suspicious of
graphs that compare the benefits of getting a Ph.D. versus an associates degree
in accounting. The problem is that most associates or bachelors degree
holders either dropped out of the labor market (such as to have babies) or
became entrepreneurs who are no longer classified as "accountants."
Problems like those mentioned above become exacerbated when comparing types
of degrees such as accounting versus culinary arts versus creative writing.
Conclusion
The bottom line is that studies like this are so misleading and dangerous that I
wish they did not get published.
Bob Jensen's threads on careers are at
http://www.trinity.edu/rjensen/bookbob1.htm#careers
**How to mislead with statistics (incomplete analysis)
Accounting Again Leads as Most Profitable
Industry ---
http://www.accountingweb.com/practice/growth/accounting-tops-list-of-most-profitable-industries
Jensen Comment
This may be one of those ways to mislead with statistics.
For example, I think an orthopedics surgeon corporation down the road in our
Alpine Clinic has a much higher percentage of return to owners than any
accounting firm in the State of New Hampshire. This is probably true for most
every MD specialty corporation in the State.
Much depends upon what you call an "industry."
One thing that helps accounting firms have high returns is relatively cheap
labor. For example, we have a granddaughter who graduated in pharmacy and then
interned with the Veterans Administration in Boston. She's now returning to
Maine (Portland) for her first real job at a starting salary of $125,000 plus
fringe benefits. Are there any accounting firms in New England with starting
salaries of entry level graduates of $125,000? There might be some who
specialize in computer and IT services, but I doubt that this salary is offered
to accounting graduates.
Having said this, I still recommend in many instances going to work for an
accounting firm at less than half this starting pharmacist salary. The reason is
that accountancy offers so many alternative tracks for advancement into much
higher paying careers. And believe it or not I think an auditor traveling from
client to client has more interesting and varied work. I watch those high paid
pharmacists in our Wal-Mart pharmacy working intently day-to-day and
year-to-year and thank my lucky stars that I never became a Wal-Mart pharma
**How to Mislead With Statistics (incomplete
analysis)
2016: Explore What Private-College Presidents
Make ---
https://mail.google.com/mail/u/0/#inbox/158ce8c1dc528171
Information about
presidents' tenures and prior employment was obtained from college websites,
newspaper archives, or university offices. Photographs were obtained from
university websites.
Jensen Comment
The above quotation raises a red flag about the data. The data were not
collected in a statistical survey with consistent definitions and findings. For
example, is it possible that the definition of "compensation" varies with the
highly varied sources of the data? In some cases "compensation" may have
included the value of a free house, a free car, and even a free airplane or use
of an airplane (such as when a Trustee's private jet is used to ferry the
president's family on vacations). In other cases "compensation" may exclude some
of those fringe benefits.
**How to Mislead With Statistics (Definitions, Incomplete Analysis)
The following two articles show how economists can put two different spins
on the same data (something that seems to be taught in social sciences in
general whenever politics gets involved).
The City of Seattle hired a group of economists to study the transitory
impact of minimum wage hikes on labor and business firms in Seattle. I say
"transitory" because the wage hikes are being phased in and won't reach the $15
level until
The Study
REPORT ON THE IMPACT OF SEATTLE’S MINIMUM WAGE ORDINANCE ON WAGES, WORKERS,
JOBS, AND ESTABLISHMENTS THROUGH 2015 The Seattle Minimum Wage Study Team1
University of Washington
July 2016
http://evans.uw.edu/sites/default/files/MinWageReport-July2016_Final.pdf
This report presents the short-run effects of the
Seattle Minimum Wage Ordinance on the Seattle labor market. The Seattle
Minimum Wage study team at the University of Washington analyzed
administrative records on employment, hours, and earnings from the
Washington Employment Security Department to address two fundamental
questions: 1) How has Seattle’s labor market performed since the City passed
the Minimum Wage Ordinance, and particularly since the first wage increase
phased in on April 1, 2015? 2) What are the short-run effects of the Minimum
Wage Ordinance on Seattle’s labor market? While quite similar at first
glance, these two questions address very different issues and require very
different methods to answer. The first question can be studied with a simple
before/after comparison. Although the comparison is simple, it risks
conflating the impact of the minimum wage with other local trends. Many
things have happened in Seattle’s labor market since June 2014, most of them
having little or nothing to do with the minimum wage itself. The City has
enjoyed steady expansion in tech sector employment, and a construction boom
fueled by rising residential and commercial property prices. Even the
weather – a key determinant of economic activity in the Puget Sound region –
was favorable in 2015, with record-low precipitation in the early months of
the $11 minimum wage. The before-after comparison can tell us the net impact
of all these simultaneous trends, but this comparison cannot distinguish
among them. Our second question – the more important one for purposes of
evaluating the policy – aims to isolate the impact of the minimum wage from
all the other regional trends seen over the same time period. Whereas the
first question asks “are we better off than we were when Seattle raised the
minimum wage” and requires only a simple comparison of yesterday to today,
the second asks “are we better off than we would have been if Seattle had
not adopted a higher minimum wage?” To answer it requires imagining how the
local economy would look in absence of a Minimum Wage Ordinance. While it is
impossible to directly observe what would have happened if no wage ordinance
had been implemented, this report uses widely accepted statistical
techniques to compare Seattle in its current state—with the presence of the
Minimum Wage Ordinance—to an image of what Seattle might have looked like
today if not for the Minimum Wage Ordinance. We take advantage of data going
back to 2005 to build a model of the way Seattle’s labor market typically
works. We also take advantage of data on nearby regions that did not
increase the minimum wage to better understand how other factors might have
influenced what we observe in the City itself.
3 In this report, we present findings on wages,
workers, jobs, and establishments. Our findings can be summarized as
follows: Wages: The distribution of wages shifted as expected. The share
of workers earning less than $11 per hour declined sharply. This decline
began shortly after the ordinance was passed. However, similar declines
were seen outside of Seattle, suggesting an improving economy may be the
cause of the change in the distribution of wages. Low-Wage Workers: In the
18 months after the Seattle Minimum Wage Ordinance passed, the City of
Seattle’s lowest-paid workers experienced a significant increase in wages.
The typical worker earning under $11/hour in Seattle when the City Council
voted to raise the minimum wage in June 2014 (“low-wage workers”) earned
$11.14 per hour by the end of 2015, an increase from $9.96/hour at the time
of passage. The minimum wage contributed to this effect, but the strong
economy did as well. We estimate that the minimum wage itself is responsible
for a $0.73/hour average increase for low-wage workers. In a region where
all low-wage workers, including those in Seattle, have enjoyed access to
more jobs and more hours, Seattle’s low-wage workers show some preliminary
signs of lagging behind similar workers in comparison regions. The minimum
wage appears to have slightly reduced the employment rate of low-wage
workers by about one percentage point. It appears that the Minimum Wage
Ordinance modestly held back Seattle’s employment of low-wage workers
relative to the level we could have expected. Hours worked among low-wage
Seattle workers have lagged behind regional trends, by roughly four hours
per quarter (nineteen minutes per week), on average. Low-wage individuals
working in Seattle when the ordinance passed transitioned to jobs outside
Seattle at an elevated rate compared to historical patterns. Seattle’s
low-wage workers did see larger-than-usual paychecks (i.e., quarterly
earnings) in late 2015, but most— if not all—of that increase was due to a
strong local economy. Increased wages were offset by modest reductions in
employment and hours, thereby limiting the extent to which higher wages
directly translated into higher average earnings. At most, 25% of the
observed earnings gains—around a few dollars a week, on average—can be
attributed to the minimum wage. Seattle’s low-wage workers who kept
working were modestly better off as a result of the Minimum Wage Ordinance,
having $13 more per week in earnings and working 15 minutes less per week.
4 Jobs: Overall, the Seattle labor market was
exceptionally strong over the 18 months from mid2014 to the end of 2015.
Seattle’s job growth rate tripled the national average between mid-2014 and
late 2015. This job growth rate outpaced Seattle’s own robust performance
in recent years. Surrounding portions of King County also had a very good
year; the boom appears to fade with geographic distance. Job growth is
clearly driven by increased opportunities for higher-wage workers, but
businesses relying on low-wage labor showed better-than-average growth as
well. For businesses that rely heavily on low-wage labor, our estimates of
the impact of the Ordinance on the number of persistent jobs are small and
sensitive to modeling choices. Our estimates of the impact of the Ordinance
on hours per employee more consistently indicate a reduction of roughly one
hour per week. Fewer hours per employee could reflect higher turnover
rather than cutbacks in staffing. Reductions in hours are consistent with
the experiences of low-wage workers. Establishments: We do not find
compelling evidence that the minimum wage has caused significant increases
in business failure rates. Moreover, if there has been any increase in
business closings caused by the Minimum Wage Ordinance, it has been more
than offset by an increase in business openings. In sum, Seattle’s
experience shows that the City’s low-wage workers did relatively well after
the minimum wage increased, but largely because of the strong regional
economy. Seattle’s low wage workers would have experienced almost equally
positive trends if the minimum wage had not increased. Although the minimum
wage clearly increased wages for this group, offsetting effects on low-wage
worker hours and employment muted the impact on labor earnings. We strongly
caution that these results show only the short-run impact of Seattle’s
increase to a wage of $11/hour, and that they do not reflect the full range
of experiences for tens of thousands of individual workers in the City
economy. These are “average” effects which could mask critical distinctions
between workers in different categories. Our future work will extend
analysis to 2016, when Seattle’s minimum wage increased a second time and
began to distinguish between businesses of different sizes and industries.
It will also incorporate more detailed information about workers by linking
employment records to other state databases. This will give us a greater
capacity to answer key questions, such as whether the workers benefiting
most from higher minimum wages are more likely to be living in poverty. We
are also in the process of collecting additional survey information from
Seattle businesses and conducting interviews with a worker sample tracked
since early 2015. The next report, expected in September, will focus
specifically on how the minimum wage has affected nonprofit organizations.
Continued in article
Spin From Investors Business Daily
The Bitter Lesson From Seattle's Minimum Wage Hike
August 10, 2016
http://www.investors.com/politics/commentary/the-bitter-lesson-from-seattles-minimum-wage-hike/
Spin From a Respected, Albeit Very Liberal Economist --- Jared Bernsten
So far, the Seattle minimum-wage increase is doing what it’s supposed to
do
August 10, 2016
https://www.washingtonpost.com/posteverything/wp/2016/08/10/so-far-the-seattle-minimum-wage-increase-is-doing-what-its-supposed-to-do/?utm_term=.d5bf0bcad438
Jensen Comment
The issue of minimum wage became an enormous political issue when the workers
receiving the wage changed. When I grew up in the 1950s and 1960s and those
McJobs having low pay were primarily intended to be temporary jobs where
students could earn a little outside the classroom and where younger people in
general could get a start in the work place. Nobody with normal capabilities
intended to make careers out of those very low paying McJobs. Somewhere along
the way things changed to where now those McJobs became careers for many folks
who are not destined for bigger and better careers in the economy. With that
change came increasing demands to increase the minimum wage to a more suitable
wage for longer-term careers.
The real question that the Seattle study is trying to answer is whether
raising the minimum wage in Seattle had a positive or negative impact on
employers, employees, and low-skilled unemployed. The answer seems to be varied
(depending upon what economist and what workers you consult.) Impact on is hard
to isolate statistically because Seattle is a relative boom town due to the high
tech economic sector. Thus just because a lot of McJob employers are still
thriving is confounded by the boom times apart from the minimum wage increase.
McJob employers are likely to be hit harder in communities having less boom
success in general. Also the wage increases are being phased in over time (until
2021)such that there is not one big boom to study.
It's hard judge impact on some McJob employers in very large or otherwise
isolated communities relative to those surrounded by competition not required to
raise minimum wage. For example, restaurant customers in in Seattle are not
likely to go elsewhere because their favorite restaurant had to raise prices
slightly. Restaurant customers on the very edge of Seattle might drive a bit
further for better prices.
Thus the impact of the Seattle's minimum wage hike focuses more on
labor/employment impact than on employer impact. And herein commences the lying
or possible lying with statistics. I would dwell on all the issues since you can
read them for your self in the above links.
Personally, I think the $15 minimum wage eventually is a good idea in a high
cost city like Seattle.
But I would like to conclude with what I think is trickery in Jared
Bernstein's rejoinder. He skirts important issues like how entry level employees
without skills (like students in need of part-time jobs and employees who messed
up their early years (e.g., with drugs and crime) get a start without higher
turnover in the minimum wage jobs that open up entry-level jobs.
At times he totally ignores the study's findings such as:
Wages:
The distribution of wages shifted as expected.
The share of workers earning less than $11 per hour declined sharply.
This decline began shortly after the ordinance was passed.
However, similar declines were seen outside of Seattle, suggesting an
improving economy may be the cause of the change in the distribution of
wages.
Second he seems to imply without more data or foresight that in larger firms
the minimum wage is an even better idea than it is at fast-food restaurants.
What he fails to note that it is in the larger firms where robotics alternatives
to low-paying jobs are exploding. :
Wal-Mart Has An Army Of Robots That Pick, Pack, and Send in Their 130
Distribution Centers ---
http://www.businessinsider.com/wal-mart-warehouse-robots-2013-12
McJobs in those Wal-Mart distribution centers have already disappeared with
advances in robotics. Perhaps this was inevitable but eliminating McJobs with
higher minimum wages will speed up job sacrices to robots and drive more and
more low skilled workers to welfare rolls and crime.
Also see
The Automated Wal-Mart: A Thought Experiment
http://faculty.washington.edu/sandeep/automated/walmart.pdf
The Seattle experiment is hard to extrapolate to every town and city in the
USA. I think higher minimum wages where the cost of living is very high is
probably a good idea. For example, the cost of living is even high in the
suburbs of Seattle and San Francisco. But the same minimum wage successes for
those metropolitan areas can be a disaster in rural America where the job losses
are likely to be enormous, For example, down the road from our mountain cottage
is an old fashioned hardware store that is already struggling to compete with
stores 10 miles away (in Littleton, NH), stores like Wal-Mart, Home Depot, and
Lowes. A $15 minimum wage might close the doors on my favorite and struggling
little hardware store that now makes almost zero profit. The workers in this
store are typically part-time spouses who supplement the family income with a
bit of added wage within walking distance of the store.
The main conclusion from this illustration is that professional economists
cannot agree on much of anything!
PS
Cleveland just rejected a $15 miniumum wage ---
http://townhall.com/tipsheet/mattvespa/2016/08/12/good-call-cleveland-rejects-15-minimum-wage-proposal-n2204064?utm_source=thdailypm&utm_medium=email&utm_campaign=nl_pm&newsletterad=
Academe by the Numbers: Data From the 2016
Almanac ---
http://chronicle.com/interactives/almanac-2016?cid=cp51#id=2_101
Explore
120 tables on faculty and presidential salaries, fastest-growing colleges,
major gifts to higher education, cumulative student-loan debt, starting
salaries for recent graduates, college enrollment by state, and more. Choose
your state and compare its data on higher education with national figures.
For a deeper analysis, read articles on the impact African-American
presidents have had on diversity at primarily white institutions, efforts to
increase enrollment at Roman Catholic colleges, generous donations to
colleges by presidents and professors, and the effect of required
college-entrance exams on the pursuit of higher education in several states.
Read More
http://chronicle.com/specialreport/The-Almanac-of-Higher/51?cid=at&utm_source=at&utm_medium=en&elqTrackId=4e9ae8418a8847638211c87fc2100314&elq=42075c87864a455b82ddcc4338a15d7f&elqaid=10236&elqat=1&elqCampaignId=3824
**How to Mislead With Statistics (Incomplete
Analysis)
Explore, Compare, and Share Higher-Ed Salaries (4,700 AAUP Colleges and
Universities)
http://data.chronicle.com/?cid=at&utm_source=at&utm_medium=en&elqTrackId=21d214392851464f80e2885ae43946d6&elq=5f2c8b7dabd944e687de3efcd4cdad01&elqaid=8582&elqat=1&elqCampaignId=2862
After choosing "College" in the middle box enter the name of a college or
university in the third box. Be patient. It takes quite a while for this page to
load.
The data will probably have a lot of comparison limitations, especially
regarding summer salary opportunities for teaching and research, housing
subsidies (if any), expense funding (including travel. research, and teaching
assistance), computers and tech services, paid leave opportunities, and medical
coverage. For example, I think Michigan State University still provides one term
of paid leave every other year like it did decades ago when I joined the faculty
of MSU. That's a huge fringe benefit.
The biggest limitation in this database is variation between departments. For
example, in the universities that I sampled the average for the university is
less than the starting salaries for tenure-track accounting professors being
hired this year. Of course accounting departments in those universities probably
have salary compression with means or medians that are still higher than most
other departments within the universities. Variations between departments are
primarily due to new Ph.D. supply and demand. I understand that shortage of
Ph.D. supply in criminology is among biggest hiring problems of some
universities.
Departmental variation accounts for much of the lower salaries of women
versus men (that can be found for combined departments by clicking on women
versus men in the graphs of this study). Even when there is no gender bias in
compensation within any given department there probably are higher proportions
of women in the lower-paying departments across the entire university.
Anecdotally, I am aware of some accounting departments where the women have
higher salaries than the men largely because they are more recent hires. But in
the university averages for their universities the women are paid less than the
men when averaged over all departments.
Medical schools generally cannot be compared in terms of compensation because
there are such widespread differences in how medical professors are compensated.
For example, some but not all medical schools provide huge bonuses from profits
of the medical schools' medical services that are billed to patients and third
parties like Medicare and Medicaid.
One of the most informative boxes to check on the top of each graph in this
database is the box that reads "Adjust for Inflation." In nearly all
universities inflation adjustment takes out the slope of the compensation over
time indicating that faculty have not really done much better than keep up with
inflation if indeed they were even able to keep up with inflation.
Higher Education Controversies ---
http://faculty.trinity.edu/rjensen/HigherEdControversies.htm
**How to Mislead With Popular Vote Statistics (incomplete analysis, bias) ---
http://townhall.com/columnists/derekhunter/2016/12/04/the-unpopular-truth-about-the-popular-vote-n2254534?utm_source=thdaily&utm_medium=email&utm_campaign=nl&newsletterad=
. . .
The Nation magazine
put it this way, “The
preliminary count had Democratic Senate candidates gathering 46.2 million
votes to 39.3 million for Republican candidates.” That and $2.50 will get
you a cup of coffee from the aforementioned unshowered, probably with
earlobes stretched to the size of Frisbees and an impromptu lecture on the
“justice” of fair trade coffee beans.
But it’s a fraud.
Those numbers aren’t a
lie, per se, but how the left is using them is, just like how it is using
the presidential popular vote.
In California now, all
candidates run in the same primary, and the top two vote-getters advance to
the runoff unless one receives more than 50 percent of the vote. Thanks to
total Democratic Party control, both candidates for the open Senate seat
were Democrats. So Democrats got all the votes in California’s Senate race.
In fact, several
solidly Republican states or states Republicans stand a good chance of
winning didn’t have Senate elections in 2016.
When you choose the
unit of measure by which you determine success you will always come out
ahead. That’s what Democrats are doing here.
In this year’s World
Series, the Chicago Cubs won the title 4 games to 3. But both the Cubs and
Cleveland Indians scored 27 runs in the seven games. Applying the argument
liberals are using, there needs to be an eighth game, or at least more
innings added to game 7 with the winner being whichever team scores the next
run.
*Why
Making Accurate World Maps Is Mathematically Impossible ---
http://www.openculture.com/2016/12/why-making-accurate-world-maps-is-mathematically-impossible.html?utm_source=feedburner&utm_medium=email&utm_campaign=Feed%3A+OpenCulture+%28Open+Culture%29
**How to Mislead With Statistics
(incomplete analysis, rankings)
Here's how wealthy the average family is in 35 countries around the world ---
http://www.businessinsider.com/net-worth-average-family-around-the-world-oecd-countries-2018-7
Jensen Comment
I'll leave it up to you to count the ways this ranking can be misleading. For
openers think of living costs such as how much does it cost to hire a house
cleaner, and yard service for 40 hours to 24/7 hours per week in each of these
countries, e.g., Switzerland versus Mexico. Then there are the many taxation
differences such as property taxes, income taxes, VAT taxes, etc. Then there are
enormous differences in real estate prices. world class health care, etc.
Then there's kurtosis affected by outliers in
mean calculations (think of poverty in Mexico versus Switzerland and the USA).
**How to Mislead With Statistics: (incomplete
analysis)
Here's how wealthy the average family is in 35 countries around the world ---
http://www.businessinsider.com/net-worth-average-family-around-the-world-oecd-countries-2018-7
Jensen Comment
I'll leave it up to you to count the ways this ranking can be misleading. For
openers think of living costs such as how much does it cost to hire a house
cleaner, and yard service for 40 hours to 24/7 hours per week in each of these
countries, e.g., Switzerland versus Mexico. Then there are the many taxation
differences such as property taxes, income taxes, VAT taxes, etc. Then there are
enormous differences in real estate prices. world class health care, etc.
Then there's kurtosis affected by outliers in
mean calculations (think of poverty in Mexico versus Switzerland and the USA).
**How to Mislead With Statistics (definitions, misleading analysis)
How median household income has changed (allegedly very little)
https://apnews.com/bfac20c7cdf14719ac03d750d8fdffbc/US-household-incomes-grew-in-2017,-yet-inequality-worsens
But Much depends on how "household income" is defined
Vox: Trump’s White House says wages are rising more than liberals think:
The White House is probably right ---
https://www.vox.com/2018/9/6/17823072/trump-cea-wages
**How to mislead with statistics
Forget braces and babysitters: American parents say their children are most
expensive when they're all grown up ---
https://www.businessinsider.com/adulthood-most-expensive-for-parents-merrill-lynch-report-2018-10
The average cost of
raising a child until age 18 today
is more than $230,000—
but that number only gets higher when children leave the nest. In fact, many
parents consider it to be the most expensive stage of parenting, according
to Merrill Lynch's new
"The Financial Journey
of Modern Parenting: Joy, Complexity, and Sacrifice"
report.
The bank
surveyed more than 2,500 American parents and found that 79% of parents
continue to provide financial support to their adult children — contributing
to an estimated $500 billion annually. That's twice the amount they save for
retirement — $250 billion annually — according to the report. There are 173
million parents in the US, according to Merrill Lynch.
"When
emotions and money become intertwined, parents risk making financial
decisions that can compromise their financial futures," states the report.
Seventy-two
percent of parents revealed they put their children's interests ahead of
their own need to save for retirement. On top of that, 63% of parents
reported sacrificing their own financial security for their children's sake.
Specifically, Asian, Latino, and African American parents are more likely to
give up financial security for their children, the report found.
Continued in article
Jensen Comment
It's misleading to say that 79% of parents provide financial support without
going into more detail about the sampling outcome distribution for things like
variance and kurtosis. I would doubt that this distribution of support is as
that say Gaussian. ---
https://en.wikipedia.org/wiki/List_of_things_named_after_Carl_Friedrich_Gauss
My guess is that the level of financial support is bimodal in that there are a
lot of parents providing their own basements versus smaller number of parents
who paying off their children's car loans and mortgages.
Things that can cause skewness include disabilities of the children (think
autism, obesity, drug addiction, and disease) and a non-normal distribution of
parental ability to provide financial support. Remember, the majority of the
households have only one parent. Such households are less likely to provide much
support unless the "outside" parent is financially responsible in a way that's
not usually the case. We sometimes think that the "kid" living in the basement
just chose the wrong major in college, but that's neither accurate nor
politically correct. It may also be politically incorrect to blame adult child
financial dependence on the high divorce rate in the USA but many "kids"
returning home with your grandkids recently got a divorce.
There's an old saying that happiness begins when the dog
dies and your kid is pulling a U-Haul out of the driveway instead of into the
driveway.
**How to Mislead With Statistics (definitions, missing variables)
Harvard Study Concludes People Who Graduate During Recessions Earn Less Money —
but They’re Happier ---
https://hbr.org/2018/09/people-who-graduate-during-recessions-earn-less-money-but-theyre-happier?utm_medium=email&utm_source=newsletter_daily&utm_campaign=dailyalert_not_activesubs&referral=00563&deliveryName=DM14780
Jensen Comment
I think this study is limited to those that have jobs for which they aspired to
rather than those that are unemployed or have jobs beneath their aspirations
such as when an Ph.D. can only get a fast-food job or an adjunct teaching job
rather than a tenure-track position.
Secondly, recessions and booms are not binary events. No two recessions are
exactly alike in degree or in terms of impact degrees on labor sector varying
impacts in the economy. A study of workers in the 2008 recession may not apply
to workers in future recessions. Happiness varies over time such as when
increased numbers of student loan borrowers are increasingly stressed over loan
repayments. Its always tough to do statistical analysis on non-stationary
systems.
Also, I'm dubious of measures of "happiness." There are many unknown
variables when studying "happiness." Also people sometimes forget things when
asked about their "happiness." For example, some respondents may ignore that
they have to still live with parents when asked about their happiness in a
particular job.
**How to Mislead With Statistics (bias)
International Student Numbers Decline ---
http://www.insidehighered.com/news/2018/01/22/nsf-report-documents-declines-international-enrollments-after-years-growth?mc_cid=3623f31501&mc_eid=1e78f7c952
In November,
Open Doors reported a 3.3 percent decline in new (as opposed to total)
international students
in the 2016-17 academic year and an overall
flattening of growth.
A companion "snapshot"
survey IIE conducted in association with other academic groups asked about
500 institutions about their international enrollments for the current
academic year. Over all, the universities in the survey reported an average
decline in new international enrollments of 7 percent. But the declines
weren't being felt across the board: while 45 percent of institutions
responding to the snapshot survey reported declines in new international
students, 31 percent reported increases and 24 percent reported no change.
Among the reasons
university officials have given for the declines in international student
enrollments are the political and social environment in the U.S.,
the high cost of U.S. higher education, visa denial and delays, increasing
competition from other countries, and changes to other governments'
scholarship programs, such as Saudi Arabia's.
Here are a few of the
international enrollment-related highlights of the NSF report:
§
At the
undergraduate level, the number of international students increased in
computer sciences (11 percent) and mathematics (5 percent) and declined
in engineering (-5 percent), social sciences (-3 percent) and nonscience
and engineering fields (-4 percent), from 2016 to 2017.
§
The top five
countries sending international science and engineering undergraduates
to the U.S. in fall 2017 were China, Saudi Arabia, India, South Korea
and Kuwait. From fall 2016 to 2017, the number of undergraduates
studying science and engineering increased from China (3 percent), India
(11 percent) and Kuwait (4 percent), while the number decreased from
Saudi Arabia (-18 percent) and South Korea (-7 percent).
§
At the graduate
level, the number of international students decreased in the computer
sciences (-12.9 percent) and engineering (-7.6 percent) between fall
2016 and fall 2017. The number of international students increased in
mathematics (by 14.6 percent),and remained fairly stable in other
science and engineering fields.
The top
countries sending international science and engineering graduate students to
the U.S. were China and India -- which together account for 69 percent of
all international graduate students in science and engineering fields --
followed by Iran, South Korea, Saudi Arabia and Taiwan. From 2016 to 2017
the number of graduate science and engineering students increased from China
(4 percent) and Taiwan (5 percent), and decreased from India (-19 percent),
Saudi Arabia (-11 percent), Iran (-1 percent) and South Korea (-1 percent).
Jensen Comment
What is misleading is that students seeking to come to the USA because of the
election of Donald Trump would've had to make a decision to avoid the USA before
Donald Trump became President of the USA. In other words they would've had to
make their Visa applications out at a time when virtually all election polls
predicted a landslide win by Hillary Clinton.
This is pointed out in comments to following the above article where one
commenter writes:
Are these declining international students
clairvoyant?
In addition, fears that the current trend "could have negative implications
for U.S. competitiveness and the health of American graduate science and
engineering programs" seems exceptionally out of place when overall,
enrollments are declining so international enrollments should, too. Taxpayer
subsidized education at state flagships and NSF funded research
opportunities should go to our U.S. students/graduates first. Maybe, this
can be described better. Due to our reliance on cheap OPT labor, we are
worried that the massive number of STEM OPT F-1's will become more
statistically obvious during massive declines in other international student
enrollments and funders at the NSF are attempting to ensure cheap labor in
labs and research facilities, while not driving up indirect costs, by
conducting a study that creates fear when there is none-STEM OPT F-1s are
cheap and here to stay. We will still get F-1s from India and China to our
better state flagship universities and U.S. gradutes will be left with
student loans and angst over their choices. Thank goodness for this pipeline
of life-saving STEM international students, now how much are we saving on
FICA and health insurance? My Baby Boomer pension doesn't jive with working
in my own lab, I need some OPTs and I don't expect them to pay into my
Social Security, that is for American students/graduates!
But the media pounces on the decline as mostly the
fault of having Donald Trump become President of the USA in 2017.
Having said this, our current USA President ant the current turmoil in
citizenship prospects for students coming to the USA at the moment does not bode
well for reversing the declining trend in international student applications
that commenced before Trump was elected.
An interesting statistic
to follow in the future will be how many new foreign students in Canadian
universities eventually seek to come to the USA for employment (and
citizenship).
**How
to Mislead With Statistics (emotions rule)
Three reasons why people fall for politicians’ lies about statistics ---
https://theconversation.com/3-reasons-why-people-fall-for-politicians-lies-about-statistics-110014
Jensen Comment
A reason for being misled (related to letting emotions rule) is hoping that the
politician will become powerful enough to make the lie come true. For example,
many people are falling for statistics cited and the promises made by promises
of guaranteed income for everybody in the USA (think AOC and Kamela Harris).
Nancy Pelosi warns of the hazards of believing those lies.
“You have to make decisions that you’re going
to reach certain goals, and some of our goals
we think are achievable”
Nancy Pelosi (when criticizing Alexandria's Green New Deal and
Basic (Guaranteed) Income
Click Here
**How to Mislead With Statistics (distortions, definitions)
San Francisco paid $400,000 for questionable research that says its filthy
streets are clean ---
https://www.businessinsider.com/san-francisco-paid-400000-for-claims-that-its-streets-are-clean-2018-9
Jensen Comment
San Francisco is paying a heck of a lot to clean its streets including paying
the poop patrols $180,000+ per worker per year (including benefits). But it's a
little like street safety in New Orleans. The police heavily patrol New Orleans
tourist centers (think the French Quarter) but freedom from muggers and
panhandlers is not so great outside the tourist districts in New Orleans and
other big cities.
In San Francisco I suspect the same can be said for the Poop Patrol.
Cities dependent upon conventions and tourist dollars will use stratified
spending like auditors use stratified sampling. The problem with freedom to roam
in the USA is that the homeless will do just that such as moving into the
tourist areas by day and then sleeping in the residential areas, maybe near the
Pelosi mansion.
For San Francisco there's a Catch 22. The better you treat the homeless the
more of them you're going to get . When I was a little kid it was a time when
hobos still rode the rails. When they hit Swea City they knew which homes were
most likely to give out free dinners. My Grandmother Dourte's house was probably
the favorite to hit. Every day around noon time we had several hobos sitting on
the back porch eating dinner off her china ---
http://faculty.trinity.edu/rjensen/max01.htm
You can guess why they always headed for the Dourte house when they hit town on
the rails. God bless her soul!
Associating Cause With Correlation
Skepticism 101 ---
http://www.skeptic.com/skepticism-101
**How to Mislead With Statistics (spurious correlations) ---
https://reason.com/archives/2015/12/04/did-california-prop-47-cause-state-crime
"Correlation or Causation? Need to prove something you already believe?
Statistics are easy: All you need are two graphs and a leading question," by
Vali Chandrasekaran, Business Week, December 1, 2011 ---
http://www.businessweek.com/magazine/correlation-or-causation-12012011-gfx.html
**How to Mislead With
Statistics
Causal Inference: The
Mixtape ---
https://www.amazon.com/Causal-Inference-Mixtape-Scott-Cunningham/dp/0300251688/ref=sr_1_1?tag=marginalrevol-20
I cannot comment on this particular new book that I've not yet read. But I do no
that causal inference is easier said than done in statistical analysis because
so many correlated variables have unknown or non-measurable underlying causes.
One of the more famous findings of John Donohue and Steven Levitt was that
legalized abortion played a major role in the dramatic decline in crime during
the 1990s. The following paper raised doubts about the finding ---
https://www.nber.org/system/files/working_papers/w15098/w15098.pdf
One problem is that there are so many factors that affect both abortion and
crime in selected age groups. One is the impact of the pill that affects both
birth rates and poverty (freeing up young women and men to pursue more
successful careers with less fear of pregnancy). Another underlying factor could
be economic opportunity variations over time having an impact on crime rates.
Another factor impacting crime rates and education is the rise in addiction to
narcotics and other substances. Increased addiction leads to school drop outs,
gang membership, prison, poverty, and murder rates. Murder and drug offense
imprisonment may act like abortion in criminals from the streets.
**How to Mislead With Statistics
The Economic Journal of The Royal
Economic Society
Evidence of relationship strains in families with teenage daughters:
Including Higher Family Divorce Rates When Daughters are Aged 13-18 ---
https://academic.oup.com/ej/advance-article-abstract/doi/10.1093/ej/ueaa140/6055681
Are couples with daughters more likely to divorce
than couples with sons? Using Dutch registry and U.S. survey data, we show
that couples with daughters face higher risks of divorce, but only when
daughters are 13 to 18 years old. These age-specific results run counter to
explanations involving overarching, time-invariant preferences for sons and
sex-selection into live birth. We propose another explanation that involves
relationship strains in families with teenage daughters. In subsample
analyses, we find larger child-gender differences in divorce risks for
parents whose attitudes towards gender-roles are likely to differ from those
of their daughters and partners. We also find survey evidence of
relationship strains in families with teenage daughters.
Jensen Comment
This might be a useful study when teaching
cause versus correlation to students. It is relatively easy to find spurious
correlations that are unlikely causal models, the classic of which is the
discovery of correlation between changes in the number of stork nests in Denmark
with changes in Danish birth rates ---
http://www.jstor.org/pss/2983064
Studies like the one above in The Economic Journal are trickier to
conclude that the correlations are not
reflective of underlying causes.
You can read comments about this study by economists at
https://marginalrevolution.com/marginalrevolution/2021/01/daughter-driven-divorce.html
My threads on cause vs. correlation art at
Bob Jensen's Illustrations of Critical Thinking (trinity.edu)
A problem sometimes arises when an unknown factor that affects both correlated
variables. For example, is it possible that climate changes affect both the
number of the number of Danish stork nests and Danish human birthrates? I'm not
saying that this is true, but it is an example of a possibility in the famous
Yates' illustration of spurious correlation. It is less likely that storks are
delivering new babies.
Also see
Statistical Significance Testing: A Historical Overview of Misuse and
Misinterpretation with Implications for the Editorial Policies of Educational
Journals ---
Click Here
I'm not trying to suggest that there is not a causal relationship in the above
study in The Economic Journal.
**How to Mislead With Rankings (definitions, Cause
versus Correlation)
**How to Mislead With Statistics
(Cause versus Correlation)
Call it the “green rush:” Legalizing weed in Colorado caused a 6% surge in house
prices in 2015 ---
https://onlinelibrary.wiley.com/doi/pdf/10.1111/ecin.12556
Jensen Comment
I'll leave it to you to count the ways this type of "causal" conclusion is
misleading. Have students identify how this study makes an effort to infer
causality and how those efforts can go wrong. This is similar to what accounting
researchers call "events studies." Firstly, accountants identify an important
event that took place that might impact share prices on one or more companies.
For example, an event might be the announcement of Company X net income/loss for
2017 on April 23, 2018. The impact of that "event" might then be studied in
terms of share price movement. Error arises when there are other events
affecting share prices on or around April 23 such as political or economic
events. Error arises when there are "leakages" about the anticipated net
income/loss to be announced. For example, at any time after January 1, 2018
financial analysts from around the world might announce their estimates of
Company X net earnings/loss. Rarely has the awaited announced loss of Tesla come
as a complete surprise to the investing world. My point here is announcement of
municipality weed laws also did not usually come as a complete surprise on the
date of the announcement. Real estate transactions in those municipalities
probably anticipated weed law events well in advance. Have students identify
other sources of error in events studies of causality.
Does legalizing retail
marijuana generate more benefits than costs? This paper provides a first
step toward addressing that question by measuring the benefits and costs
that are capitalized into housing values. We exploit the time‐series and
cross‐sectional variations in the adoption of Colorado's municipality retail
marijuana laws (RMLs) and examine the effect on housing values with a
difference‐in‐differences strategy. Our estimates show that the legalization
leads to an average 6% increase in housing values, indicating that the
capitalized benefits outweigh the costs. In addition, we find suggestive
evidence that this relatively large housing value appreciation is likely due
to RMLs inducing strong housing demand while having no discernible effect on
housing supply. Finally, we show that the effect of RMLs is heterogeneous
across locations and property types. (JEL K20, R28)
Causal Inference ---
https://en.wikipedia.org/wiki/Causal_inference
Causal Inference With Observational Data:
Econometrics Blog Post by David Giles ---
http://davegiles.blogspot.com/2018/06/shout-out-for-marc-bellemare.html
If you don't follow Marc Bellemare's
blog
(shame on you - you should!), then you may not have
caught up with his recent posts relating to his series of lectures on
"Advanced Econometrics - Causal Inference With
Observational Data" at the University of
Copenhagen in May of this year.
Marc
is keeping us all on tenterhooks by "releasing" the slides for these
lectures progressively - smart move!
So far, the
first four of the eight lectures in the series are available for
downloading:
·
Lecture 1:
Introduction
·
Lecture 2:
Causality
·
Lecture 3:
Instrumental Variables
·
Lecture 4:
Panel Data & Differences-in-Differences
I'm
looking forward to seeing the rest of these terrific lectures.
**How to Mislead With Statistics
The Melting of Antarctic Glaciers is Correlated With the What Many Scientists
are Telling the Media is Climate Change Caused by Carbon Emissions
What most of those scientists and the media fail to mention is that
Antarctic glaciers is caused in large part by hidden volcanoes ---
http://news.yahoo.com/hidden-volcanoes-melt-antarctic-glaciers-below-190506544.html
It would not be politically correct to report this possibility of the rise in
sea levels around the world.
**How to Mislead With Statistics
"The Myth of the Climate Change '97%' : What is the origin of the false
belief—constantly repeated—that almost all scientists agree about global
warming?" by Joesph Bast and Roy Spencer, The Wall Street Journal,
May 26, 2014 ---
http://online.wsj.com/news/articles/SB10001424052702303480304579578462813553136?mod=djemMER_h&mg=reno64-wsj
Last week Secretary of State
John Kerry warned graduating students at Boston
College of the "crippling consequences" of climate change. "Ninety-seven
percent of the world's scientists," he added, "tell us this is urgent."
Where did Mr. Kerry get the 97% figure? Perhaps
from his boss, President Obama, who tweeted on May 16 that "Ninety-seven
percent of scientists agree: #climate change is real, man-made and
dangerous." Or maybe from NASA, which posted (in more measured language) on
its
website, "Ninety-seven percent of climate
scientists agree that climate-warming trends over the past century are very
likely due to human activities."
Yet the assertion that 97% of scientists believe
that climate change is a man-made, urgent problem is a fiction. The
so-called consensus comes from a handful of surveys and abstract-counting
exercises that have been contradicted by more reliable research.
One frequently cited source for the consensus is a
2004 opinion
essay published in Science magazine by Naomi
Oreskes, a science historian now at Harvard. She claimed to have examined
abstracts of 928 articles published in scientific journals between 1993 and
2003, and found that 75% supported the view that human activities are
responsible for most of the observed warming over the previous 50 years
while none directly dissented.
Ms. Oreskes's definition of consensus covered
"man-made" but left out "dangerous"—and scores of articles by prominent
scientists such as Richard Lindzen, John Christy, Sherwood Idso and Patrick
Michaels, who question the consensus, were excluded. The methodology is also
flawed. A study published earlier this year in
Nature noted that abstracts of academic papers
often contain claims that aren't substantiated in the papers.
Another widely cited source for the consensus view
is a
2009 article in "Eos, Transactions American
Geophysical Union" by Maggie Kendall Zimmerman, a student at the University
of Illinois, and her master's thesis adviser Peter Doran. It reported the
results of a two-question online survey of selected scientists. Mr. Doran
and Ms. Zimmerman claimed "97 percent of climate scientists agree" that
global temperatures have risen and that humans are a significant
contributing factor.
The survey's questions don't reveal much of
interest. Most scientists who are skeptical of catastrophic global warming
nevertheless would answer "yes" to both questions. The survey was silent on
whether the human impact is large enough to constitute a problem. Nor did it
include solar scientists, space scientists, cosmologists, physicists,
meteorologists or astronomers, who are the scientists most likely to be
aware of natural causes of climate change.
The "97 percent" figure in the Zimmerman/Doran
survey represents the views of only 79 respondents who listed climate
science as an area of expertise and said they published more than half of
their recent peer-reviewed papers on climate change. Seventy-nine
scientists—of the 3,146 who responded to the survey—does not a consensus
make.
In 2010, William R. Love Anderegg, then a student
at Stanford University, used Google Scholar to identify the views of the
most prolific writers on climate change. His
findings were published in Proceedings of the
National Academies of Sciences. Mr. Love Anderegg found that 97% to 98% of
the 200 most prolific writers on climate change believe "anthropogenic
greenhouse gases have been responsible for 'most' of the 'unequivocal'
warming." There was no mention of how dangerous this climate change might
be; and, of course, 200 researchers out of the thousands who have
contributed to the climate science debate is not evidence of consensus.
In 2013, John Cook, an Australia-based blogger, and
some of his friends reviewed abstracts of peer-reviewed papers published
from 1991 to 2011. Mr. Cook
reported that 97% of those who stated a
position explicitly or implicitly suggest that human activity is responsible
for some warming. His findings were published in Environmental Research
Letters.
Mr. Cook's work was quickly debunked. In
Science and Education in August 2013, for example,
David R. Legates (a professor of geography at the University of Delaware and
former director of its Center for Climatic Research) and three coauthors
reviewed the same papers as did Mr. Cook and found "only 41 papers—0.3
percent of all 11,944 abstracts or 1.0 percent of the 4,014 expressing an
opinion, and not 97.1 percent—had been found to endorse" the claim that
human activity is causing most of the current warming. Elsewhere, climate
scientists including Craig Idso, Nicola Scafetta, Nir J. Shaviv and Nils-
Axel Morner, whose research questions the alleged consensus, protested that
Mr. Cook ignored or misrepresented their work.
Rigorous international surveys conducted by German
scientists Dennis Bray and Hans von Storch —most recently published in
Environmental Science & Policy in 2010—have found
that most climate scientists disagree with the consensus on key issues such
as the reliability of climate data and computer models. They do not believe
that climate processes such as cloud formation and precipitation are
sufficiently understood to predict future climate change.
Surveys of meteorologists repeatedly find a
majority oppose the alleged consensus. Only 39.5% of 1,854 American
Meteorological Society members who responded to a
survey in 2012 said man-made global warming is
dangerous.
Finally, the U.N.'s Intergovernmental Panel on
Climate Change—which claims to speak for more than 2,500 scientists—is
probably the most frequently cited source for the consensus. Its
latest report claims that "human
interference with the climate system is occurring, and climate change poses
risks for human and natural systems." Yet relatively few have either written
on or reviewed research having to do with the key question: How much of the
temperature increase and other climate changes observed in the 20th century
was caused by man-made greenhouse-gas emissions? The IPCC lists only 41
authors and editors of the relevant chapter of the Fifth Assessment Report
addressing "anthropogenic and natural radiative forcing."
Of the various petitions on global warming
circulated for signatures by scientists, the one by the
Petition Project, a group of physicists and
physical chemists based in La Jolla, Calif., has by far the most
signatures—more than 31,000 (more than 9,000 with a Ph.D.). It was most
recently published in 2009, and most signers were added or reaffirmed since
2007. The petition states that "there is no convincing scientific evidence
that human release of . . . carbon dioxide, methane, or other greenhouse
gases is causing or will, in the foreseeable future, cause catastrophic
heating of the Earth's atmosphere and disruption of the Earth's climate."
Continued in article
Mr. Bast is president of the Heartland Institute. Dr. Spencer is a
principal research scientist for the University of Alabama in Huntsville and
the U.S. Science Team Leader for the Advanced Microwave Scanning Radiometer
on NASA's Aqua satellite
State and Local Tax (SALT)
Deduction ---
https://smartasset.com/taxes/trumps-plan-to-eliminate-the-state-and-local-tax-deduction-explained
**How Not to Mislead With
Statistics
We Don’t Know If The SALT
Cap Is Driving Away Residents Of High-Tax States ---
https://www.taxpolicycenter.org/taxvox/we-dont-know-if-salt-cap-driving-away-residents-high-tax-states
Jensen Comment
This is a classic problem of correlation versus causation and the article avoids
some of the pitfalls of misleading statistics.
It's also a problem with anecdotal evidence in surveys. People who move to
another state and are also angry with the SALT cap may report that SALT is the
reason for moving when in fact it is only one of many reasons for moving. The
decision to move out of state is usually a complicated multivariate decision.
The title of the above article
is honest about being unable to report that the SALT Cap is the leading reason
that a majority of people are leaving the high tax (blue) states. There are
instances where it is a leading reason, but most likely there are also many more
reasons that are more important to the final decision to move. It's long been
known, before the SALT Cap that retirees who move out of state choose lower tax
states like Florida, Texas, Washington, and New Hampshire. But there's
also a weather factor and a living cost factor. Erika and I chose to retire in
Hampshire rather than Maine because of both lower NH taxes and lower real estate
prices when comparing NH mountains with Maine shoreline. But other factors made
us want move from Texas, especially the heat and humidity and nearness to some
of our widely-dispersed children in California, Wisconsin, and Maine.
The Governor of New York is
placing a lot of blame on the SALT Cap as a reason so many people are leaving
New York. However, he probably wants to draw attention away to the chronic New
York problem of high state income taxes, inheritance taxes, increasing crime,
weather, and cost of living. Deep down he probably hates that the SALT cap
increased taxpayer resistance to increasing taxes in New York --- ---
https://www.investors.com/politics/editorials/cuomos-budget-rich-high-taxes/
Of course a lot of people are also moving into New York because its a popular
sanctuary state for illegal immigrants.
**How to Mislead With
Statistics
Americans without college
degree dying 3 years earlier — even before COVID-19 ---
https://www.studyfinds.org/americans-without-college-education-die-earlier/
Jensen Comment
Would
Labron James have had a longer life expectancy if he'd earned a college
degree before becoming an NBA superstar?
The misleading part of this
study is that if a high school graduate who wants a longer life may be led to
believe a good thing to do is extend
life with a college diploma.
Firstly, this is misleading
because there are many underlying causal factors of shorter longevity (think
Down Syndrome or autism). It may well be that a larger portion of persons
without college degrees are likely to have these life shortening factors. But
not all people without college degrees have these factors such that a particular
person without a college degree
chosen at random has as much or more life expectancy than a Ph.D. or a medical
doctor chosen at random.
Secondly, there are vast
differences in college degrees that can affect careers that, in turn, affect
life expectancy. Some college graduates have very stressful careers that can
shorten life expectancy. Others have secure and relatively routine careers with
low stress.
Thirdly, is a there a whole lot
of difference in life expectancy between stay-at-home parents who have degrees
versus those who have no degrees? Many college graduates who spend full
time raising their children at home get jobs afterwards that do not require
college degrees.
**How
to mislead with statistics
Harvard Research: When Airbnb Listings in a City Increase, So Do Rent Prices ---
https://hbr.org/2019/04/research-when-airbnb-listings-in-a-city-increase-so-do-rent-prices?utm_medium=email&utm_source=newsletter_daily&utm_campaign=dailyalert_not_activesubs&referral=00563&deliveryName=DM34433
Jensen
Comment
The article itself pretty well points out how this correlation can be misleading
due to missing variables.
**How to Mislead With Statistics
"How to Explore Cause and Effect Like a Data Scientist," by Thomas C.
Redman, Harvard Business Review Blog, February 19, 2014 ---
Click Here
http://blogs.hbr.org/2014/02/how-to-explore-cause-and-effect-like-a-data-scientist/?utm_source=feedburner&utm_medium=feed&utm_campaign=Feed%3A+harvardbusiness+%28HBR.org%29&cm_ite=DailyAlert-022014+%281%29&cm_lm=sp%3Arjensen%40trinity.edu&cm_ven=Spop-Email
Jensen Comment
This is the way analysts mislead readers about studies that imply if you get a
college degree your chances (as one person) are increased for substantially
higher income. That is true if you become licensed in one of the professions
that require college degrees such as law, medicine, and the CPA profession that
now requires 150 credits of college.
But it is not necessarily true in general. How the analysts mislead is that
they imply college is the cause of higher lifetime earnings. Actually the
college degrees are correlated with income generating attributes such a work
ethic, motivation, intelligence, family financial support (say to start a
business). and lots of serendipity and luck. Those are the underlying causal
factors of success that are correlated with college performance. In research, to
find causal factors we have to drill down deeper that what big data can provide
in the way of underlying causes.
**How to Mislead With Statistics
Children Who Attended Preschool Stay in Education Longer and Earn Higher
Incomes ---
https://informationisbeautiful.net/beautifulnews/1345-head-start-works/
Jensen Comment
I suspect this is an illustration of spurious correlation suggesting causality.
Children who attend preschool are more likely to have higher income working
parents. Parental income and a myriad of other factors affect number of years a
child stays in formal education. I suspect preschool is one of the least
important causal factors in this regard except as it correlates with more
important interacting causal factors, especially if we're referring to preschool
for children who are not disabled by learning disabilities.
Preschool may make children better adapted for kindergarten, but even the
disadvantages of never having attended kindergarten usually wash out by the time
the child reaches third or fourth grade in an elementary schooling system.
Much more depends on the impact of the
home environment of children over all elementary school years.
And then there are the rankings of the Finland education system as the very best
in the world. However, much of the credit goes to a factor outside the education
system --- interaction of fathers with children
Finland is purportedly the only nation of the world where fathers spend more
time with school-aged children than mothers ---
https://www.theguardian.com/lifeandstyle/2017/dec/04/finland-only-country-world-dad-more-time-kids-moms
Also see ---
https://www.grin.com/document/322993
**How to Mislead With Statistics
The Left Is Lying About Why Life Expectancy Is Declining ---
https://therevolutionaryact.com/left-lying-life-expectancy/
. . .
There isn’t a single piece of information produced by the CDC yesterday that
would point to a deteriorating health care system or a poorly functioning
one as the cause of the decrease in life expectancy.
In fact, the opposite may be true. For example, although the overall life
expectancy dropped, the death rate amongst members of every age group except
25-44 year-olds and those over 84 years of age actually improved. Indeed, in
those groups engaged in greater health care consumption and therefore more
impacted by its quality (the 45-74 year olds) the mortality actually
dropped.
And although one could correctly argue that 85 year-olds and older are also
consumers of healthcare, the issues at play in this group are much more
complicated and no conclusion could be gleamed from the data available. It
was in those age groups that are not large consumers of health care where
the mortality rate rose.
So, if it isn’t healthcare, what could be causing the death rates of 25-44
year-olds to rise so precipitously? The CDC, Dr. Raj, and even the Wall
Street Journal
answered
this question: accidents and suicides made for a rising incidence of deaths,
with smaller increases from pneumonia and influenza.
Indeed, for the two biggest killers and the two most directly affected by
the quality of healthcare delivered — heart disease and cancer — the death
rates diminished markedly. (See Tables below.)
Continued in article
**How to Mislead With Statistics (distortions, correlation)
American Life Expectancy vs. Europe: It's Not About "Socialized Medicine" ----
https://mises.org/wire/american-life-expectancy-vs-europe-its-not-about-socialized-medicine?utm_source=Mises+Institute+Subscriptions&utm_campaign=ecd0810c45-EMAIL_CAMPAIGN_9_21_2018_9_59_COPY_01&utm_medium=email&utm_term=0_8b52b2e1c0-ecd0810c45-228708937
Everything You Know About Obesity Is Wrong ---
https://highline.huffingtonpost.com/articles/en/everything-you-know-about-obesity-is-wrong/
**How to Mislead With Statistics
(Cause versus Correlation)
Call it the “green rush:” Legalizing weed in Colorado caused a 6% surge in house
prices in 2015 ---
https://onlinelibrary.wiley.com/doi/pdf/10.1111/ecin.12556
Jensen Comment
I'll leave it to you to count the ways this type of "causal" conclusion is
misleading. Have students identify how this study makes an effort to infer
causality and how those efforts can go wrong. This is similar to what accounting
researchers call "events studies." Firstly, accountants identify an important
event that took place that might impact share prices on one or more companies.
For example, an event might be the announcement of Company X net income/loss for
2017 on April 23, 2018. The impact of that "event" might then be studied in
terms of share price movement. Error arises when there are other events
affecting share prices on or around April 23 such as political or economic
events. Error arises when there are "leakages" about the anticipated net
income/loss to be announced. For example, at any time after January 1, 2018
financial analysts from around the world might announce their estimates of
Company X net earnings/loss. Rarely has the awaited announced loss of Tesla come
as a complete surprise to the investing world. My point here is announcement of
municipality weed laws also did not usually come as a complete surprise on the
date of the announcement. Real estate transactions in those municipalities
probably anticipated weed law events well in advance. Have students identify
other sources of error in events studies of causality.
Does legalizing retail
marijuana generate more benefits than costs? This paper provides a first
step toward addressing that question by measuring the benefits and costs
that are capitalized into housing values. We exploit the time‐series and
cross‐sectional variations in the adoption of Colorado's municipality retail
marijuana laws (RMLs) and examine the effect on housing values with a
difference‐in‐differences strategy. Our estimates show that the legalization
leads to an average 6% increase in housing values, indicating that the
capitalized benefits outweigh the costs. In addition, we find suggestive
evidence that this relatively large housing value appreciation is likely due
to RMLs inducing strong housing demand while having no discernible effect on
housing supply. Finally, we show that the effect of RMLs is heterogeneous
across locations and property types. (JEL K20, R28)
Causal Inference ---
https://en.wikipedia.org/wiki/Causal_inference
Causal Inference With Observational Data:
Econometrics Blog Post by David Giles ---
http://davegiles.blogspot.com/2018/06/shout-out-for-marc-bellemare.html
If you don't follow Marc Bellemare's
blog
(shame on you - you should!), then you may not have
caught up with his recent posts relating to his series of lectures on
"Advanced Econometrics - Causal Inference With
Observational Data" at the University of
Copenhagen in May of this year.
Marc
is keeping us all on tenterhooks by "releasing" the slides for these
lectures progressively - smart move!
So far, the
first four of the eight lectures in the series are available for
downloading:
·
Lecture 1:
Introduction
·
Lecture 2:
Causality
·
Lecture 3:
Instrumental Variables
·
Lecture 4:
Panel Data & Differences-in-Differences
I'm
looking forward to seeing the rest of these terrific lectures.
**How to Mislead With Statistics (bias)
In countries with high migrant acceptance indexes — that is, countries where
the populace is generally receptive to newcomers — immigrants “are happier than
their other circumstances would indicate ---
https://www.nytimes.com/2018/03/14/world/europe/worlds-happiest-countries.html?em_pos=medium&emc=edit_el_20180316&nl=at-times&nl_art=1&nlid=10527319&ref=headline&te=1
Jensen Comment
What the author (Maggie Astor) implies is that countries with high migrant
acceptance indexes are also the happiest countries. That is just not the case.
The countries that are ranked as happiest (think Finland, Norway, and Denmark)
are not leaders in migrant acceptance indexes. In fact, Finland is noted for
rerouting migrants into Sweden. Sweden is fed up with the lawless gangs of
migrants in the no-go zones where the police are afraid to enter. Now all the
Nordick countries are refusing citizenship to ever more migrants and paying them
to return to their home countries.
Least- and Most-Accepting Countries for Migrants
http://news.gallup.com/poll/216377/new-index-shows-least-accepting-countries-migrants.aspx
| |
Least accepting of migrants |
Most accepting of migrants |
| |
|
|
|
|
| |
Macedonia |
1.47 |
Iceland |
8.26 |
| |
Montenegro |
1.63 |
New Zealand |
8.25 |
| |
Hungary |
1.69 |
Rwanda |
8.16 |
| |
Serbia |
1.80 |
Sierra Leone |
8.05 |
| |
Slovakia |
1.83 |
Mali |
8.03 |
| |
Israel |
1.87 |
Australia |
7.98 |
| |
Latvia |
2.04 |
Sweden |
7.92 |
| |
Czech Republic |
2.26 |
Nigeria |
7.76 |
| |
Estonia |
2.37 |
Burkina Faso |
7.74 |
| |
Croatia |
2.39 |
Ireland |
7.74 |
Note that the happiest nations of Finland, Norway, and Denmark are not on the
list, and Sweden is now regretting accepting so many migrants. Iceland is quite
"accepting" of the very few migrants it accepts and does not offer much in the
way of economic opportunity to migrants. Iceland historically has a high rate of
emigration (citizens leaving) especially into Canada ---
https://en.wikipedia.org/wiki/Demographics_of_Iceland
It would seem that Iceland is not fond of inviting migrants from Africa, Latin
America, South America, India, and the Middle East.
**How to Mislead With Statistics (definitions, correlation)
Harvard Study Concludes People Who Graduate During Recessions Earn Less Money —
but They’re Happier ---
https://hbr.org/2018/09/people-who-graduate-during-recessions-earn-less-money-but-theyre-happier?utm_medium=email&utm_source=newsletter_daily&utm_campaign=dailyalert_not_activesubs&referral=00563&deliveryName=DM14780
Jensen Comment
I think this study is limited to those that have jobs for which they aspired to
rather than those that are unemployed or have jobs beneath their aspirations
such as when an Ph.D. can only get a fast-food job or an adjunct teaching job
rather than a tenure-track position.
Secondly, recessions and booms are not binary events. No two recessions are
exactly alike in degree or in terms of impact degrees on labor sector varying
impacts in the economy. A study of workers in the 2008 recession may not apply
to workers in future recessions. Happiness varies over time such as when
increased numbers of student loan borrowers are increasingly stressed over loan
repayments. Its always tough to do statistical analysis on non-stationary
systems.
Also, I'm dubious of measures of "happiness." There are many unknown
variables when studying "happiness." Also people sometimes forget things when
asked about their "happiness." For example, some respondents may ignore that
they have to still live with parents when asked about their happiness in a
particular job.
**How to Mislead With Statistics
Here are the top 3 colleges in America for a return on your investment —
and not one is in the Ivy League ---
https://www.marketwatch.com/story/the-top-3-colleges-in-america-with-returns-on-investment-of-over-2-million-and-none-are-ivy-league-institutions-2019-11-14
See
the full table at
ttps://cew.georgetown.edu/cew-reports/CollegeROI/
The survey names these colleges as
giving the biggest return on investment after four decades: Albany College
of Pharmacy and Health Sciences, St. Louis College of Pharmacy,
Massachusetts College of Pharmacy and Health Sciences, Massachusetts
Institute of Technology, Stanford University, Maine Maritime Academy,
Harvard University, United States Merchant Marine Academy, Babson College
and Georgetown University.
Of the
10 colleges with the best long-term net economic gain after 40 years, all
are four-year institutions, and eight are private nonprofit institutions,
the report said. The colleges that predominantly offer certificates or
associate’s degrees have the highest return on investment 10 years after
enrollment.
Two public four-year institutions, Maine Maritime Academy and the U.S.
Merchant Marine Academy, rank in the top 10 colleges with the best long-term
returns, while two four-year private colleges, St. Louis College of Pharmacy
and Albany College of Pharmacy and Health Sciences, made the top 10 for
short-term and long-term returns.
The report ranks 4,526 colleges and universities by return on investment.
Institutions with the highest returns after 10 years yield $1 million, and
sometimes $2 million, after 40 years, exceeding the median 40-year returns
of private institutions.
The survey names these colleges as giving the biggest return on investment
after four decades: Albany College of Pharmacy and Health Sciences, St.
Louis College of Pharmacy, Massachusetts College of Pharmacy and Health
Sciences, Massachusetts Institute of Technology, Stanford University, Maine
Maritime Academy, Harvard University, United States Merchant Marine Academy,
Babson College and Georgetown University.
Overall, returns on investment from bachelor’s degrees eventually overtake
returns from most two-year credentials, it added. Case in point: Babson
College, a private institution in Wellesley, Mass., ranks 304th in net
present value at the 10-year mark, but it rises to seventh after 40 years.
“Everyone is asking, ‘Is college worth it?,’” said Anthony Carnevale, the
lead author and director of Georgetown’s Center on Education and the
Workforce. “This kind of information on the costs and benefits of higher
education holds institutions more accountable.”
Return on Students' Investments (in college degrees) Varies Over Time
(think 10 versus 40 years out) ---
https://www.insidehighered.com/news/2019/11/14/differences-college-roi-vary-institution-type-and-time-frame-measured-report-says?utm_source=Inside+Higher+Ed&utm_campaign=e500c9d4ce-DNU_2019_COPY_02&utm_medium=email&utm_term=0_1fcbc04421-e500c9d4ce-197565045&mc_cid=e500c9d4ce&mc_eid=1e78f7c952
Jensen Comment
One of the most misleading types of conclusions in statistical analysis is
treating samples from non-homogenous populations as if they are homogeneous. You
cannot in most ways compare specialized pharmacy colleges or maritime academies
with general universities like Harvard University and Dartmouth College. You
cannot compare Ivy League graduates from high income families with graduates
from a state university who could not afford college without the GI bill or
other forms of financial aid. Ted Kennedy had a tough time an college and
cheated at Harvard, but with his trust fund he was always going to be wealthy
even when on a relatively low-paying government payroll ---
http://content.time.com/time/politics/article/0,8599,1919041,00.html
Actually ROI in a college education varies over a mind=boggling number of
things. In fairness Inside Higher Education article points out some of the limitations of its ROI calculations
in this article.
Let's consider some other ways to be mislead.
Firstly, there's a problem regarding which degree? A student who majors in
history as an undergraduate is likely to have a different ROI if an investment
is also made in a law degree or a MBA. Majoring in biology alone is not the same
as also becoming a MD later on.
Secondly, when dealing with means there's a huge problem with impact of
distribution skewness and outliers. Also I think that For example, college
graduates are more likely to have outliers on the high end of salary than
workers who did not go to college. These outliers pull up the mean beyond what
can be expected for the truly "average" college graduates. The distributions are
also impacted by parents who drop out of the job market to raise children.
Thirdly, and most importantly, perhaps college graduates "on average" are
more likely to make higher incomes in life. First their parents who helped fund
their college might have been otherwise able to fund them in businesses. Second
if they're motivated to succeed in college and have the mental skills to do so
they're more apt to make more money than students who did not go to college.
My point is that it's misleading to read the conclusions of this study and
conclude that college graduation causes higher higher incomes in life. Although
in some cases that's obvious for some types of graduates such as doctors and
lawyers that must graduate from college to become licensed professionals, it's
also not obvious in most instances when there are so many other interactive
factors affecting lifetime incomes.
**How to Mislead With Statistics (distortions, correlations)
Zero Correlation Between Evaluations and Learning ---
https://www.insidehighered.com/news/2016/09/21/new-study-could-be-another-nail-coffin-validity-student-evaluations-teaching?utm_source=Inside+Higher+Ed&utm_campaign=ddd03ccf45-DNU20160921&utm_medium=email&utm_term=0_1fcbc04421-ddd03ccf45-197565045&mc_cid=ddd03ccf45&mc_eid=1e78f7c952
Jensen Comment
In fairness the article does caution against statistical quirks and misleading
conclusions.
The criticism that I would place on this is that there is no homogeneity
among sample items and an enormous problem of non-stationary states where
regression and correlation analyses fall apart.
Teachers get high student evaluations for many of the right reasons (personal
and individual time and attention) and the wrong reasons (fluff assignments and
easy course grading). The "zero correlations" have almost no meaning unless the
sampling populations are partitioned into reasons why teachers get high or low
evaluations that can sometimes be garnered from subjective comments such as the
comments in RateMyProfessor.com (where sample sizes are too small and self
selective for statistical analysis on numerical ratings). The best teacher that
I encountered in my 40 years in academe was a lousy classroom teacher. But she
spent and added 40+ hours one-on-one or two-on-one time in her office patiently
going over and over technical accounting rules until her students had a tough
accounting course etched in their brains. Her virtues were caring and patience
and rigor.
There's an enormous problem in defining "learning." In theory it should be
defined in terms of some performance measure that can be tested before a course
begins versus when a course ends. But even here there are all sorts of issues.
For example, my son had a third grade teacher in Tallahassee who could not
herself functionally read. She could hardly be evaluated for teaching of
reading. Yet she was a great inspiration to him in terms of wanting to learn in
general and received praises from him even though another teacher had to be
brought in to teach reading. Hence the variable "learning" is confounded with
the variable "inspiration."
Some universities have a course called "CPA Review" that's usually very
popular with masters of accounting students who are facing the tough nation-wide
CPA examination (with a 15% to 25% first-time pass rate) after graduation.
Teachers might be evaluated on "learning" according to their students' ultimate
pass rates the first time they take the CPA examination. But there are all sorts
of complications with that since teachers cannot control the amount of
self-study between when the course ends and when the student ultimately
graduates and sits the first time for the CPA examination. There are many other
confounding variables that make CPA exam pass rates poor measures of learning in
a CPA Review course.
At a minimum learning should be validated independently of the teachers as
often is the case in competency-based testing ---
http://faculty.trinity.edu/rjensen/assess.htm#ConceptKnowledge
But there are issues with this since it encourages teaching to the tests rather
than teaching to the students.
I think the numerical parts of teaching evaluations are more
misleading than helpful in most (not all) courses. The subjective evaluations
are sometimes much more helpful, but here again there are cautions. Repeated
complaints like "everything I learned in this course I
had to learn by myself" was a common complaint among students of
three top teachers who team-taught Intermediate 1 and 2 courses at the
University of Virginia. Getting such evaluations became the goals of these
three professors using a BAM pedagogy (students called it DAMN pedagogy) ---
http://faculty.trinity.edu/rjensen/265wp.htm
Misleading Definitions and Assumptions
**How to Mislead With Statistics
Statistical Fallacies ---
https://www.geckoboard.com/best-practice/statistical-fallacies/
**How to Mislead With Statistics
We think linearly, in terms of cause and effect, but the fact is that we live
in a complex system – a system with many interacting agents, whose collective
behaviour is usually hard to predict ---
https://aeon.co/essays/complex-systems-science-allows-us-to-see-new-paths-forward
**How to Mislead With
Statistics
The Consumer Price Index Is Not Economic Reality ---
https://www.bloomberg.com/opinion/articles/2021-04-13/consumer-price-index-cpi-history-is-surprisingly-political
**How to Mislead With
Statistics
Robust Statistics ---
https://en.wikipedia.org/wiki/Robust_statistics
Slate: The Sturgis
Biker Rally Did Not Cause 266,796 Cases of COVID-19 ---
https://slate.com/technology/2020/09/sturgis-rally-covid19-explosion-paper.html
Jensen Comment
One of the common mistakes in statistical and analytical analysis is to draw
conclusions that are not suitably stable under slight variations of underlying
assumptions. These mistakes are aggravated by making assumptions that are
themselves highly questionable. Such mistakes are especially common in hostile
political settings. I might note that the Slate magazine is highly left leaning.
This article supports its claims of credibility ---
https://en.wikipedia.org/wiki/Slate_(magazine)
**How to Mislead With Statistics (Definitions)
How median household income has changed (allegedly very little)
https://apnews.com/bfac20c7cdf14719ac03d750d8fdffbc/US-household-incomes-grew-in-2017,-yet-inequality-worsens
But Much depends on how "household income" is defined
Vox: Trump’s White House says wages are rising more than liberals think:
The White House is probably right ---
https://www.vox.com/2018/9/6/17823072/trump-cea-wages
Hi Jagdish,
**How to Mislead With Statistics
Part of the problem in analyzing poverty in the USA arises from how we
measure it.
According to The
Heritage Foundation, the federal poverty line also
excludes income other than cash income, especially welfare benefits. Thus,
if food
stamps and public
housing were successfully raising
the standard of living for poverty stricken individuals, then the poverty
line figures would not shift, since
they do not consider the income equivalents of such entitlements.[57]\\
Steven Pinker,
writing in an op-ed for The
Wall Street Journal, claims
that the poverty rate, as measured by consumption, has fallen from 11% in
1988 to 3% in 2018.[58] Burkhauser
et al. find that accounting for cash income, taxes, and major in-kind
transfers and updating poverty thresholds for inflation show that a
Full-income Poverty Rate based on President Johnson's standards fell from
19.5 percent to 2.3 percent over the 1963–2017 period.[59]
Think for example of what Medicaid has done for health care and long-term
nursing services that is excluded from the poverty statistics. Millions of
middle class Americans are trying to make their parents poor enough to qualify
for free Medicaid long term Care.
One of the huge exclusions is income in the underground economy that is never
reported and analyzed in poverty statistics. A USA article once estimated this
unreported and untaxed income to be over $2 trillion. In San Antonio we saw a
lot of this where house cleaners often earned over $30 per hour in the
underground economy while collecting aid to dependent children and Medicaid
benefits while bringing home $30 per hour in unreported income.
Why do housecleaners earn over $30 per hour? Partly its quality of service,
but the major share of that high wage is an established reputation for
reliability and honesty. Word spreads very quickly when a reliable and honest
maid is discovered.
Bob
**How to Mislead With
Statistics
The Gender Gap in Pandemic
Job Losses Has Been Wildly Exaggerated ---
https://reason.com/2021/05/11/the-gender-gap-in-pandemic-job-losses-has-been-wildly-exaggerated/
Jobs data casts doubt on the idea that
the COVID-19 pandemic is uniquely setting women back.
For more than a year, the U.S. has been flooded with
gloomy headlines and dire predictions about
women and work. "The pandemic is
devastating a generation of working women," opined one Washington
Post writer in February. Citing data showing that 2.5 million women
dropped out of the workforce since the COVID-19 pandemic began, Vice
President Kamala Harris said "the
pandemic has put decades of the progress we have collectively made for women
workers at risk."
Harris called it a "national
emergency"—albeit one that could be fixed by greenlighting the Biden
administration's coronavirus spending plan.
And so the narrative typically
goes: women's employment prospects are in
crisis; the way out is passing the Democrats' preferred economic policies. (See
Matt Welch
in Reason's
June print issue for more on this
rhetoric.)
But the magnitude of this gender
gap has never been as great as many
have made it out to be. And recent data cast further doubt on the "she-cession"
narrative. At the end of April 2021, the unemployment rate for women was
slightly lower than the unemployment
rate for men. And the women's labor force participation rate had recovered
more than the men's rate had.
Just How Big Are These Gender Gaps Now?
To read headlines about
gender and job losses, one might get the impression that U.S. women are
faring drastically worse on the
coronavirus-era employment front than men are. Yet such losses have never
been as drastically gendered as many doomsayers let on.
"Labor force participation—defined
as all civilians working full or part time, as well as those who are
unemployed but looking for work—fell dramatically for both genders between
March and April 2020," noted
Gallup. In April 2020, men's labor
force participation was at 97.8 percent of its February 2020 level and
women's labor force participation was 96.9 percent of its February 2020
level—a gender gap of just 0.9* percentage
points.
he labor force
participation rate is a separate measure than the unemployment rate, which
is concerned with how many people are out of work and actively seeking a
job. On unemployment, U.S. women are also faring better than their
male counterparts (though "better" here does come with some caveats, since
unemployment numbers don't include people out of a job and not seeking a new
one).
In April
2021,
the unemployment rate for U.S. men ages 20 and older was at 6.1 percent, down
7 percentage points from its April 2020 peak.
For women ages 20 and older, it was at 5.6 percent—down 9.9 percentage
points since the previous April.
Put another way, women's
unemployment rate is now just 2.5 percentage points higher than it was in
pre-pandemic times, while men's unemployment rate is 2.9 percentage points
higher.
The Truth Behind the Panic
It is true that American
women initially lost more jobs to COVID-19 than their male counterparts did
(in contrast to the typical recession pattern).
In February 2020, the
civilian unemployment rate for women age 20 and up was
3.1 percent,
according to BLS data. For men, it was 3.2 percent. But by the end of April
2020, the unemployment rate for women had jumped to 15.5 percent, while for
men it only jumped to 13.1 percent.
Two explanations for
this discrepancy have emerged. First, women tend to outnumber men as the
primary caregivers for children and elderly or ailing family members,
leaving them more
vulnerable to work disruptions when
schools and child care centers shut down, when kids need homeschooling, or
when relatives need care. Second, women are more highly concentrated in
retail, leisure, and hospitality jobs, which were more heavily affected by
pandemic-related closures, restrictions, and mandates.
While the first factor has
gained the most attention, the second one may be the bigger culprit.
Labor force
participation for women with children did indeed drop more than it did for
men with children, "consistent with the theory that working mothers
disproportionately took themselves out of the labor force to care for
children who were no longer able to attend day care or school," noted Gallup.
Yet "the drops among women without children and men without children are
also sizable," which "suggests that factors other than child care have
significantly influenced decisions to leave the workforce."
"Overall, these labor force
patterns seem largely tied to occupational differences between women and
men," according to Gallup's analysis of BLS data. "Occupations with a higher
share of women have exhibited lower labor force participation rates and
higher unemployment rates throughout the pandemic."
Either explanation suggests
that—for both women and men—the drop is more likely short-term than
long-term.
A Call to Arms?
Given the current
state of recovery, "it does not make sense to enact permanent programs, such
as government-run paid family and medical leave, subsidized childcare, and
universal pre-K with the justification of fixing a COVID -19 disparity that
no longer exists," argues Heritage
Foundation research fellow Rachel Greszler in a new report.
"Policymakers can do far
more to help women and families by removing government-imposed barriers to
flexible work, to employer-provided paid family and medical leave, and to
accessible and affordable childcare than by adding costly and bureaucratic
new programs and upending the labor market in ways that would limit
families' incomes and choices," she posits.
By February 2021, labor
force participation for both sexes had ticked back up somewhat. And while
women were still seeing a less full recovery, the gap was again less than
one percentage point. Compared to February 2020, men's February 2021 labor
force participation was 2.2 percent smaller and women's was 3.1 percent
smaller.
That's not nothing—"the
gap in labor force changes amounts to roughly 493,000 more women than men
being absent from the labor force since the pandemic began," Gallup pointed
out in early March. But it's also not evidence that women have been
uniquely devastated by
pandemic-related job losses, especially when—contra previous economic
downturns—many of the circumstances that initially created the job losses
will remedy quickly as life returns to a more normal pace.
Indeed, that already seems to be
happening, according
to data from the Bureau of Labor Statistics (BLS).
In April 2021, the labor
force participation rate for U.S. men 20 and older was 69.8 percent, down
from 71.6 percent in February 2020. For women, it was 61.7 percent in April,
down from the 63.3 percent in February 2020. So, while women's labor force
participation was lower than men's at the start of the pandemic and still
is, women are now slightly closer than men are to their pre-pandemic
participation level, with the April 2021 labor force participation rate for
men 1.8 percentage points lower and the rate for women down 1.6 percentage
points.
Continued in article
**How to MIslead With
Statistics
NBER: Misdemeanor
Prosecution ---
https://www.nber.org/papers/w28600
Communities
across the United States are reconsidering the public safety benefits of
prosecuting nonviolent misdemeanor offenses. So far there has been little
empirical evidence to inform policy in this area. In this paper we report
the first estimates of the causal effects of misdemeanor prosecution on
defendants' subsequent criminal justice involvement. We leverage the as-if
random assignment of nonviolent misdemeanor cases to Assistant District
Attorneys (ADAs) who decide whether a case should move forward with
prosecution in the Suffolk County District Attorney's Office in
Massachusetts. These ADAs vary in the average leniency of their prosecution
decisions. We find that, for the marginal defendant,
nonprosecution of a nonviolent misdemeanor offense leads to large reductions
in the likelihood of a new criminal complaint over the next two years.
These local average treatment effects are largest for first-time defendants,
suggesting that averting initial entry into the criminal justice system has
the greatest benefits. We also present evidence that a recent policy change
in Suffolk County imposing a presumption of nonprosecution for a set of
nonviolent misdemeanor offenses had similar beneficial effects: the
likelihood of future criminal justice involvement fell, with no apparent
increase in local crime rates.
...
We
find that the marginal nonprosecuted misdemeanor defendant is 33 percentage
points less likely to be issued a new criminal complaint within two years
post-arraignment (58% less than the mean for complier" defendants who are
prosecuted; p < 0.01). We find that nonprosecution reduces the likelihood of
a new misdemeanor complaint by 24 percentage points (60%; p < 0.01), and
reduces the likelihood of a new felony complaint by 8 percentage points
(47%; not significant). Nonprosecution reduces the number of subsequent
criminal complaints by 2.1 complaints (69%; p < .01); the number of
subsequent misdemeanor complaints by 1.2 complaints (67%; p < .01), and the
number of subsequent felony complaints by 0.7 complaints (75%; p < .05). We
see significant reductions in subsequent criminal complaints for violent,
disorderly conduct/theft, and motor vehicle offenses.
Jensen Comment
Firstly, if less than half are "less likely" to repeat the offenses what happens
to those that are "more likely" to repeat offenses?
Secondly, there is such a wide
variety of misdemeanor crimes that lumping them together and looking at averages
can be misleading. Examples of misdemeanors include prostitution, drug
possession, non-violent mugging, vandalism, trespassing, public intoxication,
public defecation, reckless driving, indecent exposure, peeking tommery, and
shoplifting. Indeed not prosecuting some of these crimes might lower the odds of
repeating the offense, but I find it hard to believe that not prosecuting for
prostitution and shoplifting is going to lead to a lower likelihood of
prostitution and shoplifting.
Thirdly, not prosecuting some
crimes leads to lowering the possibility of such crimes. For example, if
shoplifting becomes too rampant big box stores (think Walmart and Target) may
either close down or certainly not build new stores in the parts of a community
where shoplifting is more likely. One time I shopped in a convenience
store in downtown Baltimore where customers were not allowed to touch the
merchandise until is was paid for. Clerks behind bulletproof glass retrieved the
merchandise and collected the money before the merchandise was passed in drawers
to customers. The effect of not prosecuting crimes thereby leads to higher
prices of merchandise and/or increased costs of having to travel much further to
shop in stores. More dramatically if
non-violent mugging and panhandling becomes more likely due to non-prosecution
tourists will avoid the high risk areas such that crime statistics go down for
the wrong reasons. Wiill tourists flock to Los Angeles and Portland,
Oregon since these cities no longer prosecute misdemeanors? The only people
flocking to such places may be drug addicts (which is what happened in San
Francisco).
Fourthly, and most importantly,
there may be huge changes in the data being collected. For example, if
misdemeanors are no longer prosecuted after January 1, 2022 it may well be that
victims may no longer report crimes and/or police arrest far fewer criminals
after January 1, 2022 because their arrests will not be prosecuted.
Hence, there may be increases in these
misdemeanors that are no longer getting into the crime database.
Lastly, the use of p-values in
statistical inference has fallen out of favor with the American Statistical
Association because they are too unreliable ---
Time to say goodbye to “statistically significant” and embrace uncertainty,
say statisticians ---
https://retractionwatch.com/2019/03/21/time-to-say-goodbye-to-statistically-significant-and-embrace-uncertainty-say-statisticians/
Three years ago, the American Statistical Association (ASA) expressed hope
that the world would move to a “post-p-value
era.”
The statement in which they made that recommendation has been cited more
than 1,700 times, and apparently, the organization has decided that era’s
time has come. (At least one journal had already banned
p values by 2016.)
In an editorial in
a special
issue of
The American Statistician out today, “Statistical Inference in the 21st
Century: A World Beyond P<0.05,” the executive director of the ASA, Ron
Wasserstein, along with two co-authors, recommends that when it comes to the
term “statistically significant,” “don’t say it and don’t use it.” (More
than 800 researchers signed onto a piece
published in Nature yesterday calling
for the same thing.) We asked Wasserstein’s co-author, Nicole
Lazar of the University of Georgia,
to answer a few questions about the move.
So the ASA wants to
say goodbye to “statistically significant.” Why, and why now?
In the past few years
there has been a growing recognition in the scientific and statistical
communities that the standard ways of performing inference are not serving
us well. This manifests itself in, for instance, the perceived crisis in
science (of reproducibility, of credibility); increased
publicity surrounding bad practices such as p-hacking (manipulating the data
until statistical significance can be achieved); and perverse incentives
especially in the academy that encourage “sexy” headline-grabbing results
that may not have much substance in the long run. None of this is
necessarily new, and indeed there are conversations in the statistics (and
other) literature going back decades calling to abandon the language of
statistical significance. The tone now is different, perhaps because of the
more pervasive sense that what we’ve always done isn’t working, and so the
time seemed opportune to renew the call.
Much of the
editorial is an impassioned plea to embrace uncertainty. Can you explain?
The world is
inherently an uncertain place. Our models of how it works — whether formal
or informal, explicit or implicit — are often only crude approximations of
reality. Likewise, our data about the world are subject to both random and
systematic errors, even when collected with great care. So, our
estimates are often highly uncertain; indeed, the p-value itself is
uncertain. The bright-line thinking that is emblematic of declaring some
results “statistically significant” (p<0.05) and others “not statistically
significant” (p>0.05) obscures that uncertainty, and leads us to believe
that our findings are on more solid ground than they actually are. We think
that the time has come to fully acknowledge these facts and to adjust our
statistical thinking accordingly.
Continued in article
**How to Mislead With Statistics
Here's how much every US
state (and Washington DC) pays its teachers and how much they spend on each
student ---
Click Here
Rank (Teacher
Salary Average. Spending Per Student)
01 New York ($87,543,
$24,040)
02 California ($84,649,
$12,498)
03 Massachusetts ($83,622 ,$17,058)
04 Washington, DC ($79,350,
$22,759)
05 Connecticut ($78,247,
$20,635)
06 New Jersey ($76,376,
$20,021)
07 Maryland ($73,444,
$14,762)
08 Washington ($72,965,
$12,995)
09 Alaska ($70,877,
$17,726)
10 Pennsylvania ($70,258,
$16,395)
...
42 Indiana ($51,508,
$10,262)
43 South Carolina ($51,485,
$10.856)
44 Missouri ($50,817,
$10,810)
45 Arizona ($50,381,
$8,329)
46 West Virginia ($50,238,
$11,334)
47 Louisiana ($50,217,
$11,452)
48 Arkansas ($49,822,
$10,139)
49 South Dakota ($49,220,
$10,073)
50 Florida ($48,800,
$9,346)
51 Mississippi ($45,192,
$8,935)
Jensen Comment
Broad generalizations are misleading. We might say that it costs about half as
much to live in Mississippi as in New York, but this is not entirely true
because it costs much more than double to live in New York City and much less
than double to live in Poughkeepsie, New York.
One might conclude that
southern states pay teachers a lot less, but why do South Dakota, Indiana, and
Arizona rank down among the low paying southern states? Some southern states
(think Georgia) are not in the bottom 10 in terms of average teacher salaries.
There are all sorts of statistical problems when dealing with average salaries
without considering dispersions around the mean. In New York for example the
salaries highly skewed upward by the immense number New York City high salaries,
These very high average salaries skew the state's mean upwards relative to what
it would be if New York City was taken out of the mean calculation.
There are also statistical
concerns about the spending per student numbers shown above.
There are many factors affecting spending per student. Vermont and Georgia at
ranks 17 and 18 have nearly identical average teacher salaries (about $61,000)
And yet Vermont's spending per student is a whopping $19,340 compared to
Georgia's spending per student at $10,810. This is due mostly to a policy of
allowing miniscule rural towns in Vermont to have their own unconsolidated
school districts. The Vermont joke is that some school districts have more
supervisory board members than the numbers of students in their very rural
schools. The good news is that the student/teacher ratio is very, very low in
Vermont while administrator/student ratios are also very high. This is probably
a very good thing from a pedagogical standpoint but a bad thing from an
accounting standpoint. It cost a lot extra to heat and maintain school buildings
for only a few students.
In Georgia school districts
tend to be more consolidated giving rise to a lower average spending per
student. Vermont could greatly lower its spending per student by consolidating
more districts, but this would also increase the student/teacher ratios and make
students be bussed relatively long distances across mountain passes in the
winter. New Hampshire at rank 19 spends less per student ($16,893) than Vermont
($19,340), but this is due in part to having a population of 1,400,000 compared
to Vermont's sparse 644,000 population over roughly the same land mass and
terrain. New Hampshire has more populated school districts due heavily to having
over twice as many residents in the state. This in turn is due to New
Hampshire's attraction of having no income tax and no sales tax, whereas Vermont
taxes everything it can think of to tax. One thing very high taxes do is keep
the population low.
The above type of reasoning
does not apply to all states. What Mississippi and Florida spend per student is
just plain miserable no matter how you look at it. But look at how much more New
York state spends per student relative to California. Go figure why New York
spends nearly twice as much per student!
My main point is that spending
per student is a very misleading number because there are so many heterogeneous
efficiencies and inefficiencies blended into that one number. In Vermont high
spending per student leads to very small numbers of students per teacher. But in
New York high spending per student is not generally such a good thing for
student/teacher ratios like high spending is in Vermont. Spending per student is
highly skewed by the cost of everything in New York City.
**How to Mislead Without Statistics
With Centuries-Old Techniques, This Farm Is Preparing for the Future No
modern methods or machinery required — just crops cultivated by hand in
incredible, climate-proof quantities ---
https://reasonstobecheerful.world/permaculture-bec-hellouin-farm-france/
. . .
There is no tractor or plow in this place of constant
growth. The farmers do not use fossil fuels, nor artificial fertilizers and
pesticides. The manual work saves costs and reduces their carbon footprint.
But there is also another reason. A tractor designed for modern farming
could not plant more than three rows of carrots on the barely one-meter-wide
strips utilized by this farm. At Bec Hellouin, four times that density of
crops is grown in that amount of soil. “We cultivate radishes, carrots,
lettuce and cabbage in 12 rows on this space,” says Charles.
Continued in article
Jensen Comment
Much can be said for the above ventures into farming on land not amenable to
mechanized large-scale food production. But we should not extrapolate this
article to world production of grains (corn, soybean, and wheat)
production from giant farms in the USA's Midwest or the mechanized vegetable
production in California where my son is connected by marriage to a 5,000 acres
of rice and tomato farm using enormous Caterpillar tractors, giant combines,
etc. Yes you can now plant and harvest rice and tomatoes with robotic tractors,
combines, and trucks. The produce is untouched by human hands. The trucks taking
harvests to processing mills could even be driverless if the laws permitted such
deliveries without drivers.
The modern world with over seven billion hungry people cannot and will not
return to farming without machines --- big and better machines. What the above
article fails to compare is the productivity of our present mechanized farms
with productivity of what they would become today if we banned the machinery and
chemicals of farming. We can now longer
feed the world with hunting, gathering, and non-mechanized organic farms and
food factories.
I'm reminded of the following remarks of Milton Friedman about the lesson of
spoons.
Milton Friedman: The Lesson of the
Spoons ---
https://marginalrevolution.com/marginalrevolution/2019/08/spoons-are-in-aisle-9.html
Chopsticks would be even better than spoons in providing more and more workers
with tools to move the earth.
**How to Mislead With
Statistics
Research: Women Are Better
Leaders During a Crisis ---
https://hbr.org/2020/12/research-women-are-better-leaders-during-a-crisis?utm_medium=email&utm_source=newsletter_weekly&utm_campaign=weeklyhotlist_not_activesubs&deliveryName=DM113092
Jensen Comment
Firstly, I wonder if this study would have been published by Harvard if the data
revealed men are better leaders in a crisis. In this era I doubt it.
Irrespective of how the survey
data turned out, I don't like comparing opinion poll averages of gender
differences in leadership "during a crisis." Crises are highly specific events
in specific circumstances. They vary from such extremes as a local crisis (think
of someone passing out in a presidential cabinet meeting) to very global crisis
(think of missiles sinking of a USA aircraft carrier in the China Sea or Persian
Gulf). I think gender differences are negligible compared with a person's unique
history, training, experience, personality, data understanding, etc. in a
particular crisis at a particular time.
We're not dealing with fungible items in stationary processes with most types of
"crises."
The study is not restricted to
a particular types of crises such as when pilots experience engine failures in
fighter aircraft. The study refers to any type of crisis, and I think the survey
outcomes are garbage with respect to leadership in every type of crisis in every
type of circumstance. There are instances where a particular leader, man or
woman, can step up to the plate like a rather lousy leader in many respects
named Winston Churchill stepped forward marvelously when Hitler was on the verge
of taking over all of Europe.
Of course there are types of
crises were gender might be an important element of leadership, but there are
certainly many other types of crises where gender is probably irrelevant among
all the most important factors affecting great leadership at the moment.
**How to Mislead With Statistics
Evanston bookstore owner
suing Amazon over alleged price-fixing scheme that makes it impossible for other
retailers to compete ---
https://chicago.suntimes.com/business/2021/3/29/22357482/evanston-bookstore-owner-suing-amazon-price-fixing-scheme-compete
An Evanston bookstore owner wants to take on Amazon.
Nina Barrett, owner of Bookends and Beginnings, signed on as the named
plaintiff in a class-action lawsuit filed last week that accuses Amazon of
orchestrating a price-fixing scheme with the nation’s leading book
publishers that makes it impossible for other retailers to beat their
prices.
According to the suit, contracts that Amazon has with the nation’s “Big
Five” publishers — Penguin Random House, HarperCollins, Hachette, Macmillan
and Simon & Schuster — block the
publishers from giving other retailers better prices.
“I, along with most independent bookstore owners in America, feel incredibly
frustrated because we’ve seen that the playing field is not level,” Barrett
told the Sun-Times. “We have to talk to our customers all the time about why
we can’t match Amazon’s pricing.”
Continued in article
Jensen Comment
Giving bookstores lower purchase prices than online vendors (think Amazon)
forces publishers to share in the cost of bookstore services that most book
buyers don't want to pay for in higher prices for books in local bookstores.
These include the typical "middle man" services of wholesalers that many product
lines have been eliminating in this era of technology.
My neighbor in San Antonio
for years had a wholesaling company that had exclusive rights for distributing
some name brands (think Heinz) to all San Antonio area retailers. This gave him
and his family a very comfortable living for many years, but one has to think
that in modern times Heinz could probably sell their brands directly to San
Antonio retailers at lower prices. My point is that this is somewhat analogous
to how Amazon can sell books worldwide online with lower profit margins per book
in what accountants call cost-profit-volume (CPV) analysis.
There's no doubt that local
bookstores provide services that Amazon online cannot provide. For one thing,
there's entertainment and serendipity advantages of customer browsing in
bookstores. I love physical, especially in my favorite multi-story bookstore in
Denver that has comfortable chairs among their book shelves. The problem is that
these days not enough customers are willing to pay extra for the browsing
services. The typical customer might browse in a bookstore, find books to
purchase, and then go home and place an order with Amazon at lower prices.
There's also value when
bookstore vendors have wide knowledge of related books. A customer might rave
over a recent book she or he read and then ask a bookstore vendor: "Are their
similar books to this marvelous book?"
Some bookstores may provide
tea, wine, and treats to browsers.
It's a little like the
transition from full service (check the tire pressure, check the oil, and wash
the windshield) gasoline stations of my youth to no service (my current local
self service station having zero attendants) gasoline station in Franconia, NH
in my retirement. If given a choice, most drivers prefer not to pay extra for
fuel accompanied by full services.
If publishers sold books to
Amazon for higher prices than to bookstores it would be a little like refiners
selling fuel for less to full service filling stations. Customers would end up
paying higher prices for fuel whether they buy from full service or self-service
filling stations. The bottom line
is that retail customers would be paying for services that most (not all) do not
want to pay for when having no choice but to pay the higher prices.
In other words, Amazon would have to charge more to recover the higher price
Amazon pays for books. Bookstores would not charge less than Amazon, because of
higher overhead and lower volume. Both Amazon and a bookstore might charge about
the same price, a price that's higher than Amazon currently charges for books
because of lower overhead.
**How to Mislead With Statistics
Americans without college
degree dying 3 years earlier — even before COVID-19 ---
https://www.studyfinds.org/americans-without-college-education-die-earlier/
Jensen Comment
Would
Labron James have had a longer life expectancy if he'd earned a college
degree before becoming an NBA superstar?
The misleading part of this
study is that if a high school graduate who wants a longer life may be led to
believe a good thing to do is extend
life with a college diploma.
Firstly, this is misleading
because there are many underlying causal factors of shorter longevity (think
Down Syndrome or autism). It may well be that a larger portion of persons
without college degrees are likely to have these life shortening factors. But
not all people without college degrees have these factors such that a particular
person without a college degree
chosen at random has as much or more life expectancy than a Ph.D. or a medical
doctor chosen at random.
Secondly, there are vast
differences in college degrees that can affect careers that, in turn, affect
life expectancy. Some college graduates have very stressful careers that can
shorten life expectancy. Others have secure and relatively routine careers with
low stress.
Thirdly, is a there a whole lot
of difference in life expectancy between stay-at-home parents who have degrees
versus those who have no degrees? Many college graduates who spend full
time raising their children at home get jobs afterwards that do not require
college degrees.
**How to Mislead With Statistics
Canadian researchers gave $7,500 to people without a home — and the results show
the power of universal basic income ---
https://www.businessinsider.com/canadian-basic-income-experiment-gives-homeless-people-cash-2020-10
. . .
The Foundation for Social Change, a Vancouver-based charity, partnered with
the University of British Columbia to identify 50 people between 19 and 64
years old who had recently become
homeless. The recipients were identified as not having significant
substance abuse or mental health issues.
Researchers studied
their spending habits over
12 months and compared their outcomes to a control group who did not receive
the cash payment.
Those who were
given the cash largely spent the money on food, rent, and transportation and
moved into stable housing faster over the course of the year, according to
the findings.
Spending on
"temptation goods," such as drugs, cigarettes, and alcohol declined by 39%,
on average. And recipients were able to keep an average of $1,000 in
savings, according to Canadian news outlet CBC.
The cash payment saved the shelter system $8,100 per person over the course
of the year, a total savings of $405,000.
Continued in article
Jensen Comment
In fairness the findings report of this study emphasizes that the stipends were
given to only people who recently became homeless (during the Covid-19
pandemic). Without saying so, I think that it's
implied that the findings do not extrapolate well the people who are chronically
homeless due to addictions, mental illness, depression, or lack of motivation to
better themselves.
A recent homeless person could be a hard worker (think a waiter or waitress)
unable to pay rent because of restaurant closures during the pandemic. People
motivated to work are more apt to use the money to find work compared to
hard-core alcoholics unable to think beyond where to get the next bottle of
booze.
The main point is that statistical findings are often difficult to extrapolate
to different people and different circumstance
How to Mislead With Statistics: Failure to Recognize Externalities
Externality ---
https://en.wikipedia.org/wiki/Externality
Boston schools wanted to stagger start times to save on transportation
costs and improve student health. Here's why parents were against it — and what
it can teach us about pandemic planning ---
https://www.businessinsider.com/why-some-boston-parents-were-against-staggered-school-start-times-2020-10
Jensen Comment
The school districts primarily considered parties most directly involved in
start-time decisions --- students, teachers, and taxpayers who pay the
transportation costs. Parents are more indirectly and variably involved. For
example, stay-at-home parents and parents now working remotely in a majority of
homes may be less concerned than working parentshaving to physically commute to
work on tight schedules. Those parents with less scheduling flexibility
became powerful voices in this illustration.
**How to Mislead With
Statistics
To combat the COVID-19
economic downturn, New Jersey Governor Phil Murphy passed a millionaire's tax.
Here's why he says that's good for everyone ---
https://www.businessinsider.com/nj-gov-phil-murphy-millionaires-tax-will-help-middle-class-2020-11
This year, New Jersey Governor Phil Murphy and the state legislature agreed
on a deal to raise the income tax by 2% on incomes over $1 million per year
to address the budget crisis brought on by the pandemic. Not only will this
tax help administer coronavirus relief to the communities and small
businesses that need it most, but it will also help rebalance a regressive
state tax code which puts a bigger tax burden on poorer households.
In this week's episode of Pitchfork
Economics,
David Goldstein and Nick Hanauer interview Governor Murphy about his
decision to tax the rich.
Murphy, a
millionaire former Goldman Sachs executive, wants to be very clear that he's
not fomenting class warfare.
"We don't begrudge people's
success," Murphy began. "Whether you're a wealthy individual or a large
corporation — we want more of each in New Jersey."
But Murphy says he raised
the tax because "I got elected to stand for a stronger, fairer New Jersey
that works for not just some, but for everybody." That meant asking the
wealthiest New Jerseyans to "help us rebuild our middle class."
From the beginning, Murphy
laid out the conditions for the tax very clearly: "Anyone earning a million
dollars and up, we're asking you to pay a few pennies more, and we'll put
every dime of that into the middle class."
Continued in article
Taxes are about to rise for
New Jersey millionaires. There aren’t many ways to duck the levies ---
https://www.cnbc.com/2020/09/24/taxes-are-about-to-rise-for-new-jersey-millionaires.html
. . .
“New Jersey is one of the more painful
states to really tax plan for,” said Albert J. Campo, CPA and managing
partner at AJC Accounting Services in Manalapan, New Jersey.
“Anyone who’s $1 million and up is
getting substantial benefits (tax breaks) at the federal level, but they’re
somewhat limited at the state level.”
The Garden State is known as a “gross
income” state, and that means certain exclusions and deductions are off the
table on state tax returns.
For instance, contributions you make
to a workplace retirement plan reduce your taxable income on your federal
return.
In New Jersey, only contributions to
401(k) plans are excludible from wages. Amounts you divert to a deferred
compensation plan or any other retirement plan – including 403(b) or 457
plans -- are not excludible from your pay.
Another quirk: People who itemize on
their federal income tax return can claim a write-off for charitable giving.
New Jerseyans, however, can’t do this on their state return.
Earlier this year, Garden State legislators
put forth a proposal to allow a gross
income tax deduction for
contributions made to certain New Jersey-based charitable organizations
during the pandemic. That measure is pending.
See here for
a list of items that can’t be excluded from wages in New Jersey.
There are a few moves
high-income households can take to lower their income if they’re close to
the margins and a couple of thousand dollars away from the steeper tax rate,
according to Alan Sobel, CPA at Sobel & Co. in Livingston, New Jersey, and
president of the New Jersey Society of CPAs:
-
Increase your 401(k) plan contributions: It’s
the one retirement plan contribution that can let you lower wages on
your New Jersey tax return.
-
Drawing down portfolio income? Consider tax-exempt
bonds: Garden
State municipal bonds can create income that’s free from federal and
state income tax.
-
Gift assets to family members in lower tax brackets: “This
way, the income is going to them and not you,” said Sobel. Be aware this
is a long-term play. You should coordinate with your accountant, estate
attorney and family members before making these gifts.
Continued in article
Jensen Comment
But in both the federal and state jurisdictions, millionaires often defer more
income tax than they report due to capital gains and losses, often value changes
that are highly volatile and highly subjective in measurement. For example,
owners of Tesla shares can see the values of their unsold shares bounce up and
down like a basketball.
Ten different real estate
appraisers may give you ten highly different value estimates of a 100 acre
parcel of land on the outskirts of Newark, the value of which may be highly
dependent upon where locations of future roads, road exits, train tracks, and
bridges are built. Ups and downs in values of such investments are unknown in
amount until sales transactions actually take place.
For the same reason, it's
virtually impossible to compare total wealth of most millionaires and
billionaires. The estimated wealth of such persons vary widely in the eyes of
different appraisers. In estate value disputes it's often the courts that have
to set values, and the courts do not have magical measurement wands any better
than the wands all disputing appraisers. The courts merely have the power to set values
when disputing value appraisers cannot agree.
My best example of
where the court resolved highly varying value estimates of finance
models is:
Questrom vs. Federated Department Stores, Inc.: A Question of Equity
Value," by University of Alabama faculty members by Gary
Taylor, William Sampson, and Benton Gup, May 2001 edition of Issues
in Accounting Education
---
http://faculty.trinity.edu/rjensen/roi.htm
One thing is certain is that
the federal government under Biden and Harris will soon impose heavy new taxes
on the same "millionaires" in New
Jersey and millionaires in all the other 49 states. This will soon become a taxing
time for high earners and wealthy people in the USA.
I think the Governor of New
Jersey overstates the case that his proposed "millionaires" tax will not lead to exodus of a significant
number of high earning citizens to move elsewhere or be a barrier to such
citizens that might move into New Jersey. New Jersey already has nearly the
highest state taxes for citizens at all levels of income. The problem with the causal
factors that inspire movements of households is that there are many such factors
that are highly interactive.
Consider me as an example,
although my income is way too low to qualify for the new millionaire tax in New
Jersey. When I retired in San Antonio, Texas my wife and I wanted to move out of
the heat, humidity, and congestion of a big city. We also wanted to be closer to
family. We have two children living in northern California, one living in
Wisconsin, and two in northern Maine. Almost like New Jersey, those three states
are among the highest taxing states in the USA. Having family within driving
distance was the primary consideration for where to move, but environmental
beauty and state taxation were interactive causal factors in choosing where to
retire. We thus narrowed our search down to northern Nevada next to California
or northern New Hampshire next to Maine. We found a mountain cottage in northern
New Hampshire that is within five hours of driving to where two of our children
live in Maine ---
http://faculty.trinity.edu/rjensen/Pictures.htm
State taxation was not the
primary causal factor for choosing to retire in New Hampshire, but the fact that
New Hampshire has no income tax and no sales tax was an interactive causal
factor that led us to choose New Hampshire over California, Wisconsin, and
Maine. If we had children in New Jersey we probably would've retired in a nearby
state with lower taxes. Never New Jersey!
My point here is some people
will avoid living in a state with very high taxes being the main reason. Others,
like my wife and I, left Texas primarily for reasons not affected by taxation.
But when choosing where to retire taxation became an interactive causal factor
--- along with other factors like not wanting to live in a city, having nice
surroundings like mountains, and having nearby family in an adjoining state.
New Jersey's
enormous state taxes have primarily or interactively been a factor in
keeping many people from wanting to live there. Adding more taxes to already
high taxes may be hurting more than helping revenue taxes in New Jersey,
the second highest taxing state in the USA.
People who can now work remotely are
leaving New York, New Jersey, and Silicon Valley in droves.
NYSE and Nasdaq threaten to
leave New Jersey if transaction tax goes ahead ---
https://www.datacenterdynamics.com/en/news/nyse-and-nasdaq-threaten-leave-new-jersey-if-transaction-tax-goes-ahead/
The New York Stock Exchange (NYSE) has threatened
New Jersey lawmakers it will move its data operations out of state if taxes
are imposed on electronic trades.
Nasdaq has also come out against the tax, saying it
is in talks with Texas as a future home.
New
Jersey is proposing a hundredth-a-cent tax on every financial transaction
processed in the state. The transaction tax won favor amongst politicians
and also of Governor Phil Murphy and Senate President Steve Sweeney back
when it was introduced
in July.
At the time it was set to charge a quarter-of-a-cent ($0.0025), but has been
scaled back due to the stock markets' resistance.
If implemented, New Jersey’s financial transaction tax would be a flat-rate
levy imposed per instrument, not per trade. Lawmakers believe it could
harvest about $500m each year or $1bn over the tax’s two year lifetime.
The securities industry in New Jersey employs about 38,000 people and pays
nearly $1.4bn in state and local taxes.
The
Assembly of Financial Institutions and Insurance Committee held a virtual
public hearing on Monday, as reported by NJ.com.
The tax would be paid by companies operating data centers specializing in
financial trades. Many such facilities are based out of New Jersey's
suburban districts like Mahwah, Secaucus, and Carteret.
In the past, proximity to Wall Street made it sensible for data centers to
be nearby for low latency trading, however, the market has now been testing
whether it can operate out-of-state.
Back in September and earlier this month, the NYSE simulated a trading day
using its backup data center in Chicago. This was a practice for any
possible relocation of the market to data centers out of New Jersey. The
co-head of government affairs for the NYSE, Hope Jarkowski, said: “From Sept
28 to Oct 2, we moved our production servers for our NYSE Chicago exchange
out of New Jersey to our secondary data center… Proximity to New York City
is no longer relevant in today’s trading environment."
She added: “We understand why a financial transaction tax, or FTT as it’s
commonly known, may be perceived as a silver bullet that can remedy or
offset financial hardship with little effect on the financial markets
themselves, impacting perhaps only big corporations or wealthy individuals.
In reality, this tax would be imposed on a processor of transactions but
would be passed along to a purchaser or seller.
"That said, these harms will never come to pass," she added, "because those
with obligations to their investor clients will simply move their business
out of New Jersey to avoid harm, leaving no transactions in New Jersey to
tax and undermining the revenue-generating aim of an FTT.”
Nasdaq also threatened to leave if any transaction tax was put in place and
said it is currently in talks with Texas Governor Greg Abbott about
relocating trading systems to the Dallas-Fort Worth area. Several other
unnamed states are also said to be talking to Nasdaq.
New Jersey Governor Phil Murphy revealed he has been in talks with market
representatives to get them on side. At a Covid-19 briefing on
Monday,
he said: “We’ve had - I thought - constructive discussions with Nasdaq and
the New York Stock Exchange. They’ve expressed their concerns. I can’t read
their minds. But the fact that we are in an hour of need, this is not a
'forever and always' consideration. I think our side of the argument is also
reasonable... we shall see. This is something we still are studying and we
still like what we see, but it’s complicated, there’s no question about it.”
Continued in article
Chronicle of Higher Education: What College Activists Want?
https://www.chronicle.com/article/What-College-Activists-Want/249184?utm_source=at&utm_medium=en&utm_source=Iterable&utm_medium=email&utm_campaign=campaign_1363707&cid=at&source=ams&sourceId=296279
Defunded police.
Inclusive coursework.
Faculty members who look like them. (including
administrators and coaches.
Students are demanding radical change for racial justice,
and they’re not backing down.
The demand: Sever ties with the police
(except armed Antifa patrols)
The demand: Remove symbols of oppression (including the library's
politically incorrect materials)
The demand: Hire people of color (even if they are less qualified
than others)
The demand: Diversify the curriculum (No
Shakespeare/math/business and more Che Guevara)
Some of the unmentioned demands in the above article
Free tuition, room and board, pot, and booze
Free medical and dental care (including free abortions)
Open admission for for people of color
Only A grades (stop giving mostly A- and B grades)
No examinations, quizzes or grading of term papers
Excuse from class attendance in favor of protesting
Screening of all campus speakers for political correctness (pretty much like
it is now)
No suspensions or dismissals (except in the case of the first signs of
conservatism disease)
Reparations plus guaranteed annual income during and after graduation
Reply from Bob Jensen later in the day
I perhaps exaggerated too much on student demands and tried unsuccessfully
to be somewhat funny. However, I think if I dug deeper I would find where
student groups have made demands of all the the things I mentioned.
I note that the Daily Beast articles almost always promoted a leftist
agenda.
Here are some of the documented demands of students listed by the Daily
Beast (note the ones to get rid of grades, tests, and teachings of all
male poets (including Shakespeare). I also note that some colleges (think
Michigan State) removed mathematics from the core course and skills
requirements:
https://www.thedailybeast.com/the-craziest-demands-of-college-kids-in-2016
**How to mislead with statistics
This is the best versus worst states to retire: An illustration of the
most absurd rankings yet -
https://www.blacktowerus.com/the-best-us-states-for-retirees/#section02
What's misleading about this ranking?
First let's consider a few clues.
The popular retirement state of Florida is a Rank 1 while another popular
retirement state Arizona is at Rank at Rank 27 and popular Nevada is at Rank 47?
High tax state Illinois is at Rank 9 while equally high tax state California is
at Rank 19 and New York is at Rank 17?
What makes Illinois so great relative to Arizona and Nevada? Or is Illinois even
a popular retirement state for persons not having lived in Illinois for most of
their lives?
We know for certain that Arizona and
Nevada are popular retirement states for people who have not lived in those
states for most of their lives.
Freezing Minnesota with its high taxes comes in comes in at Rank 2 as a
better retirement state than 48 other states.
Is Minnesota really a popular retirement state for people who did not live in
Minnesota most of their lives?
What's going on here?
The first thing that's wrong is that within most any state outliers distort
the numeric criteria used in the above rankings. For example, in New York State
the high real estate average price is distorted greatly by the millions homes in
the largest cities of New York and its closest suburbs. But persons seeking
retirement in up state New York can make much better deals by distancing
themselves from NYC.
Secondly, real estate price averages are distorted by prices of large family
homes with four bedrooms or more. Millions of people retiring however are
scaling down into smaller retirement town houses. condos, mobile homes, or
apartments that provide much cheaper alternatives such as those found in popular
retirement communities. My point is that real estate average prices for an
entire state like Arizona or Nevada are not relevant to average prices for
smaller alternatives being sought out by the majority of retirees.
Thirdly, the main drivers of housing costs in most parts of any state are
quality of public schools and commuting times to jobs. It's most likely that
retirees are seeking to escape from high property taxes that accompany public
school quality since retirees are no longer concerned with schools for their
children. And retirees no longer concern themselves with commuting times for
work.
The above ranking also relies upon a state's average life expectancy. This is
an absurd criterion for retirees seeking to move out of state for retirement.
Life expectancy is more apt to be influenced by where people grew up and spent
90% of their younger years rather than the influence of the last 10% of their
lives. By the time they retire their
doctors have already taken away booze, fatty foods, sugar, and high caloric
goodies. And retirees still suffer from the former stresses of their work and
commuting hours.
Now let's consider the crime variable used in this study. There can be a huge
denominator impact here where state population impacts crime risk
unrealistically. Alaska's crime average is relatively high because the state's
population denominator is so small. The same is true for Nevada, New Mexico,
etc. Crime variables can also be badly distorted by outliers like high
population NYC, Los Angeles, Dallas, Houston, New Orleans, Atlanta, Chicago,
etc. And high crime cities are not usually where out-of-state retirees are
headed within a state. What person from Iowa wants to retire in Chicago or
Detroit? Give Iowa retirees Iowa, Arizona, Arkansas, or Texas.
The same problem exists with using percent of older people within a state.
The first thing to note is that there is not a whole lot of variation in this
variable. Yeah, Alaska has a lower senior citizen rate, but the neighborhood
variable is not relevant to most older Alaskans. Most retirees are not leaving
Alaska because there are not enough older people in the neighborhood. Most
retirees are leaving Alaska because there are so few daylight hours much of the
year, it's cold most of the year, and the children no longer live in Alaska
because there were no job opportunities. Many retirees leave Alaska to be closer
to their children rather than live closer to old farts like themselves.
The bottom line is that this is a quant study that did not include the main
variable --- where people really are retiring. It looked that five variables
that badly generated misleading conclusions.
Minnesota is not the Number 2 sought after retirement location in the USA
even if the fishing is pretty good.
Illinois is not the Number 9 sought after retirement location in the USA even
if ????? (I can't think of a retirement attraction for Illinois).
Texas is a relatively popular retirement state because it's quite likely one
or more of the children found work in Texas --- a factor not taken into
consideration in this ranking of states. Retirees often like to be closer to
their children and grandchildren.
**How to Mislead With
Statistics
Wharton: How
Fixed-income Portfolios Match or Beat Stocks in the Long Run ---
https://knowledge.wharton.upenn.edu/article/fixed-income-portfolios-match-beat-stocks-long-run/
Jensen Comment
My main objection to this study is the time span of the study across five
decades. Fixed income portfolios did well when interest rates were relatively
high over four decades. Then came the crash in interest rates over over the most
recent decade. Investment decisions based upon a study across five years may be
misled by non-stationarity arising in the most recent decade.
A second objection is that
fixed-income portfolios are not what they used to be. In recent years hybrid
securities are comprising a larger proportion of fixed income securities. By
this I mean there are built-in conversion options and other features that make
some fixed-income securities not purely fixed-income alternatives.
A third objection is that
fixed-income securities come in two basic types --- taxable income versus
tax-free income. Many (most) fixed-income portfolios are comprised of both types
of fixed-income securities such that investment performance confounds major tax
rulings into portfolio performance, particularly tax changes on the taxable
securities.
A third objection is that
fixed-income securities such as a municipal bond mutual fund really has variable
annual returns even when the fund is comprised of only fixed-income securities.
The variability arises mainly from when some bonds mature and are replaced by
newer bonds having different fixed return rates. When an investor has such a
mutual fund investment is this a fixed-income or variable-income component of
the portfolio? If variable, the variability is fundamentally different than with
a common stock portfolio where the income variability is caused by operating
performance variability of each company in the stock fund.
A fourth objection is that real
estate components of a portfolio differ fundamentally from stock and bond
components. Firstly, an owner of real estate is taxed at least twice ---
property taxes plus income taxes. Secondly, real estate investment performance
is highly variable in terms of location (think of the 2020 crash in real estate
value in Manhattan), type (think shopping centers), and political events such as
how the current Corona-19 pandemic is currently crippling landlords. It's very
difficult to diversify some real estate investment risks relative to other
portfolio investment alternatives.
**How to Mislead With Statistics
Have We Already Defunded the
Police?
https://marginalrevolution.com/marginalrevolution/2020/06/have-we-already-defunded-the-police.html
Jensen Comment
A well known problem in cost accounting comes in precisely defining costs to be
classified. The classic example is the definition of a $20 million building on a
balance sheet.
Firstly, that $20 million most likely includes the cost of the land under and
surrounding the building. Land costs are quite different than construction costs
of the building itself. For one thing land site lasts forever and is not subject
to depreciation like the construction costs of the building certain land
improvements.
Secondly, there's the classic problem in accountancy of costs that get
expensed (on the income statement) versus costs that get capitalized (on the
balance sheet) and the rates at which some of those capitalized costs become
expensed. For example, the costs of light bulbs in a $20 million building is a
significant cost. When the building was new, those light bulb costs were
probably included in the $20 million capitalized cost. However, every year
thereafter the replacement costs of those light bulbs are probably expensed each
year even when the light bulbs themselves are expected to last several years.
Now consider "Police and Corrections Expenditures" in the above article. I
suspect these numbers are taken from the annual expenditure budgets.
Governmental accounting is based more on fund accounting than accrual accounting
used by business firms. But fund accounting is troubled by some of the
definitional problems faced in accrual accounting. Does "Police Expenditure" in
the above article include the cost of operating police station buildings or is
it only based on the salaries and bonuses of police officers and administrators?
Does it include the related cost of vehicles, computers, etc.?
Then there's the gray zone of technology costs affecting policing. Does
"Police Expenditure" include the cost of creating and maintaining databases such
as fingerprint, DNA, and criminal records in national, state, and regional
databases?
Presumably, there are tradeoffs such as the more we spend on newer policing
technologies the less we have to spend on police labor that those technologies
replaced. Those technology costs may be included in budgetary funds other than
"Police Expenditures."
Then there's the problem of those multimillion dollar punitive damage awards
the courts pass against police departments. Are they "Police Expenditures?"
And then there's the enormous problem that the State of Illinois and the City
of Chicago know more about than anybody else. Does "Police Expenditure" include
the massive cost of pensions of police officers and administrators? If so
defunding of police is not such a simple matter since retirement obligations go
on and on even if you fire the entire police force.
My point here is that accountancy in the 21st Century accountancy is much
more complex that in the 1400s when Pacioli expressed double-entry bookkeeping
in simple algebraic equations.
The question of whether we are
already "defunding the police" is not so simple to answer as concluded in the
above article.
**How to Mislead With Statistics
Simple
Solution to California’s Anticipated $54 Billion Budget Deficit ---
https://www.counterpunch.org/2020/05/15/simple-solution-to-californias-anticipated-54-billion-budget-deficit/
. . .
A 50% tax on the
wealth of just Larry Ellison, Mark Zuckerberg and Elon Musk would solve the
deficit with tens of billions remaining. A quick google search puts their
wealth at:[1]
Zuckerberg $68.2 billion
Ellison $67.4 billion
Musk $36.8 billion
An emergency wealth
tax of 50% on these three individuals alone would come to $86.2 billion.[2] That
would leave over $30 billion more than the estimate of California’s
government deficit. That extra money could be used to house the homeless,
guarantee everyone food and access to medical care, finally provide a proper
level of funding for the state’s public colleges and schools, lift many, if
not all, of the state’s residents out of poverty, and have funds to help out
in case the state experiences another round of destructive fires and/or a
major earthquake.
This type of tax should
have no impact on the lifestyles of the super-wealthy. Recently, they
appeared to be able to get by on “far less.” Zuckerberg’s wealth was put at $46
billion at
the end of 2015 and “just” $4
billion in
2010, less than 6% of what it is today. In 2015, Musk’s wealth was estimated
at $13.2
billion,
not even half of what it is now. After the tax, the net worth of the
super-wealthy would still be excessive.
Continued in article
Jensen Common
An extreme
wealth tax such as that suggested above is not so simple as the article naively
makes it sound. California needs cash and none of the billionaires mentioned
above are sitting on tens of billions in cash or gold or any other investments
that are easily cashed in at market values. They're sitting mostly on common
stock in the companies they control (Facebook, Oracle, Tesla, Boring, and SpaceX,
etc.). Stock prices are set by supply and demand at relatively small amounts of
daily trading. Forcing these huge shareholders to quickly dump 50% of their
enormous holdings would send share values plunging to a point where these
billionaires and their companies no longer have the wealth envisioned in the
above article.
Secondly, the
author of the above article assumes that these billionaires will passively
accept a 50% tax on all their wealth. If such legislation in Sacramento
approaches reality those billionaires will be long gone from California and may
even move their companies out of state. The naive author of the above article
does not investigate why Sweden and France experimented with and then abandoned
much more modest wealth taxes on their most wealthy taxpayers as the wealth
taxes were discovered to be counterproductive on the economies.
Thirdly,
California would be sending a message that there is no longer a California dream
of becoming a billionaire with new ventures in the no-longer Golden State.
Instead the message would be to start new ventures iin more business-friendly
states that still offer an American Dream.
Sir Jim
Ratcliffe, Britain's wealthiest man and a key Brexit backer, has decided to
leave the UK and live in Monaco ---
https://www.independent.co.uk/news/uk/home-news/jim-ratcliffe-brexit-uk-richest-man-monaco-move-tax-haven-eu-leave-a8484211.html
Sir Jim Ratcliffe, Britain’s
wealthiest man and a key Brexit backer,
has decided to leave the UK and live in Monaco.
Despite his previous claims
that the UK would be “perfectly successful” outside of the European Union (EU),
the billionaire has chosen to leave the country of his birth and move to the
principality, whose residents do not pay income tax, on the Mediterranean
coast.
Sir Jim, founder and CEO of the
chemicals giant Ineos, was named as
the richest man in Britain in this year’s Sunday
Times rich
list, with an estimated fortune of £21bn.
Continued in
article
The Achilles
heel of the dual income tax : the Norwegian case ---
https://ssb.brage.unit.no/ssb-xmlui/handle/11250/180583
The dual income tax provides the
self-employed individual with large incentives to participate in tax
minimizing income shifting. The present paper analyses the income shifting
incentives under the Norwegian split model in the presence of technology
risk, and it concludes that the
widely held corporation serves as a tax shelter for high-income
self-employed individuals. In addition, real capital investments with
a low risk profile are means to shift income from the labor income tax base
to the capital income tax base for the high-income self-employed.
OECD:
Recommended Tax Reform in Norway --- Phase Out the Wealth Tax
https://www.oecd-ilibrary.org/content/paper/5k9bls0vpd5d-en?crawler=true
Tax Reform in Norway
A Focus on Capital Taxation
Norway’s dual income tax system achieves high levels of revenue collection
and income redistribution, without overly undermining economic performance
and while paying attention to environmental externalities. It treats capital
and labour income in different ways:
capital income is taxed at a single low rate, while labour income is taxed
at progressive rates.
However, effective tax rates on savings vary widely across asset classes.
The favourable treatment of owner-occupied housing relative to financial
savings should be reduced, preferably by taxing imputed rents at the
standard 28% statutory rate. The wealth tax implies very high effective tax
rates on savings, indicating that it either gives rise to tax avoidance or
significantly inhibits growth. The government should investigate the issue
and, if the growth-equity trade-off is too unfavourable to growth,
phase out or lower the wealth tax.
To restrain tax avoidance by the wealthy, the base of the gift and
inheritance tax should be broadened. Overall, the reform package recommended
in this paper would improve the allocation of capital and increase work and
investment incentives. It could be designed to be broadly neutral in regard
to income redistribution and public revenue.
American
Economic Review 2019: Tax Evasion and Inequality (Scandinavia) ---
https://www.aeaweb.org/articles?id=10.1257/aer.20172043
Drawing on a unique dataset of leaked
customer lists from offshore financial institutions matched to
administrative wealth records in Scandinavia, we show that offshore tax
evasion is highly concentrated among the rich. The skewed distribution of
offshore wealth implies high rates of tax evasion at the top:
we find that the 0.01 percent richest households evade about 25 percent of
their taxes. By contrast, tax evasion detected in stratified random
tax audits is less than 5 percent throughout the distribution. Top wealth
shares increase substantially when accounting for unreported assets,
highlighting the importance of factoring in tax evasion to properly measure
inequality.
Here's a humorous and serious TED talk that seriously argues why the world
needs billionaires---
https://www.ted.com/talks/harald_eia_where_in_the_world_is_it_easiest_to_get_ric
**How to Mislead With
Statistics by Assuming a Stationary Process That is Not Stationary
What should we believe and
not believe about R?
https://marginalrevolution.com/marginalrevolution/2020/04/our-best-people-are-working-on-this-problem.html
. . .
Ultimately, the models and
statistics in the field aren’t designed to handle rapidly changing R,
and everything is made much worse by the massive inconsistencies in the
observed data. R itself is a surprisingly subtle concept (especially in
changing systems): for instance, rt.live uses a simple relationship between
R and the observed rate of growth, but their claimed relationship only holds
for the simplest SIR model (not epidemiologically plausible at all for
COVID-19), and it has as an input the median serial interval, which is also
substantially uncertain for COVID-19 (they treat it as a known constant).
These things make it easy to badly missestimate R. Usually these errors pull
or push R away from 1 — rt.live would at least get sign(R – 1) right if
their data weren’t garbage and they fixed other statistical problems — but
of course getting sign(R – 1) right is a low bar, it’s just figuring out
whether what you’re observing is growing or shrinking. Many folks would
actually be better off not trying to forecast R and just looking carefully
at whether they believe the thing they’re observing is growing or shrinking
and how quickly.
All that
said, the growing (not total, but mostly shared) consensus among both folks
I’ve talked to inside Google and with academic epidemiologists who are
thinking hard about this is:
-
Lockdowns, including Western-style lockdowns, very
likely drive R substantially below 1 (say .7 or lower), even without
perfect compliance. Best evidence is the daily death graphs from Italy,
Spain, and probably France (their data’s a mess): those were some
non-perfect lockdowns (compared to China), and you see a clear peak
followed by a clear decline after basically one time constant (people
who died at peak were getting infected right around the lockdown). If R
was > 1 you’d see exponential growth up to herd immunity, if R was 0.9
you’d see a much bigger and later peak (there’s a lot of momentum in
these systems). This is good news if true (and we think it’s probably
true), since it means there’s at least some room to relax policy while
keeping things under control. Another implication is the “first wave” is
going to end over the next month-ish, as IHME and
UTexas (my
preferred public deaths forecaster; they don’t do R) predict.
-
Cases are of course
massively undercounted, but the weight of evidence is that they’re
*probably* not *so* massively undercounted that we’re anywhere near herd
immunity (though this would of course be great news). Looking at
Iceland, Diamond Princess, the other studies, the flaws in the Stanford
study, we’re very likely still at < ~2-3% infected in the US. (25% in
large parts of NYC wouldn’t be a shock though).
Anyways,
I guess my single biggest point is that if you see a result that says
something about R, there’s a very good chance it’s just mathematically
broken or observationally broken and isn’t actually saying that thing at
all.”
That is
all from Rif A. Saurous, Research Director at Google, currently working on
COVID-19 modeling.
Currently it seems to me that those are the smartest and best informed views
“out there,” so at least for now they are my views too.
Jensen Comment
Misleading statistics aren't all bad as long as they get you tenure, promotions,
and pay raises.
**How to Mislead With Bad
Assumptions
Biden plan for free public
college tuition could doom most private colleges ---
https://www.foxnews.com/opinion/biden-free-college-justin-haskins-chris-talgo
Jensen Comment
I'm opposed to free public colleges except possibly the first two years in local
community colleges. My reason is the trillions of dollars it will cost to
otherwise provide free tuition and other aid to all public universities for
undergraduate and postgraduate education. It's unfair to give them free
undergraduate degrees and then tell them they have to pay to graduate schools
aimed at career education.
The conclusion that free public
education will doom most private colleges is misleading.
Some private colleges are on the brink of extinction and will fail with or
without free public college competition.
Free public college education
will overwhelm the best public colleges (think flagship universities) with
applicants. Either top public universities will limit the acceptance rates for
onsite campuses to what it is now, or they will ruin onsite education with
gigantic lecture classes, or they will limit the free tuition to inferior
distance education. By inferior I mean that online courses will be huge with
almost no interaction between students and their teachers and other students in
each course. The very best online courses are small with instant messaging
between faculty and students. These can
be even better than face-to-face tutorials.
The better private schools will
survive by offering what they offer now --- smaller classes, closer interactions
with faculty, and campus residency aimed at providing all the things they cannot
obtain in large public universities, small dormitories, participation in sports
without having to perform at a professional level, etc.
But the nation may not survive
as Biden's social program promises inch up toward $100 trillion per year for
universal health care for legal and illegal residents, minimum basic income,
green initiatives, reparations for all people of color, open borders, massive
housing subsidies, free college for all legal and illegal residents, enormous
increase in funding to K-12 schools, new roads/bridges,
bailout of states, etc.
The ploy of promising everything for
everybody is not new to political candidates.
History is replete with failed promises when economic realities set in for
elected officials. The worry today is that activists will no longer accept
excuses for failed promises and will elect zealots like AOC, Harris, or Bernie
Sanders instead of Joe Biden --- who, like Obama, I hope is more tuned into
economic realities even though Biden's now making unrealistic promises.
I hope Biden's VP choice is a
realist and not a zealot.
Here's One Economic Reality
That Activists Avoid Mentioning
Some argue that public colleges aren't all that radical, and some European
nations (think Finland and Germany) now offer free university education. But
they don't tell you how these nations face economic realities.
These nations painfully limit the number
of students getting free college education or free training to about the top 1/3
of Tier 2 graduates such that the other 2/3 either cannot get into college or
have to rely on private sector companies to train them with apprenticeships
---
http://faculty.trinity.edu/rjensen/HigherEdControversies.htm#Tertiary
**How to Mislead With
Statistics
The Five Most Expensive
Countries in the World ---
https://qz.com/1867733/which-is-the-most-expensive-country-in-the-world/
The latest data, for 2017, demonstrate
the huge disparities in the cost of living between countries. Japan was five
times more expensive than Egypt. This means that the amount the average
Japanese person could buy was about three times more than the average
Egyptian. It’s still a big difference, but not as massive as it might appear
at first glance.
The most expensive country in the
world in 2017 was Bermuda, with prices about 105% above the global average.
Bermuda
was followed by Iceland, Norway, Switzerland, and the Cayman Islands.
These are all very rich countries,
where labor is costly, a major contributor to high prices. It is no
coincidence that three of the top five are islands, which makes importing
goods to these places extra expensive.
The least expensive countries were
poor nations like Eritrea (76% less expensive than average), Egypt (73%,)
and Ukraine (67%).
. . .
Generating price
statistics is not easy. The World Bank works with the statistical agencies
of each country to gather prices on a set of commonly
purchased goods across the world (pdf).
For example, data is
collected on the cost of rice, gas, TVs, and housing. The researchers’ goal
is to collect prices for similar types of goods of more or less the same
quality.
The measurement for the
overall price level of a country is not simply comparing a similar basket of
goods across all countries, but also accounts for what locals tend to buy.
People in China eat a lot of pork, so the price of pork plays a bigger role
than beef in determining China’s overall price level. The amount of any
product that is included in a price level calculation is determined by
examining surveys of household expenditures for that country.
The World Bank also
releases data on the price level by major product type. The data show that
not only do overall price levels vary across countries, but even within
countries, the price differences with the rest of the world fluctuate widely
depending on the product or service. For example, in the UK, the cost of
“transport” was 39% higher than the global average, but the cost of “food
and beverages” was only 7% higher. These differences are often due to
government policies, like trade barriers or business subsidies, that raise
or lower prices for industries. Generally though, prices tend to be
relatively higher in rich countries for goods and services that involve
a lot of labor,
like prices at restaurants and hotels, and relatively lower for commodities
like food and clothing.
The chart below shows the
relative costs of different product groups for the 30 most populous
countries in the world, and if you hover over a dot it will highlight the
cost of that good across all countries.
Continued in article
Jensen Comment
One of the huge problems in comparing cost of living is that items being
compared are not fungible, especially housing. For example, for an Egyptian
median-income homeowner to live like a median-income Swiss homeowner is
enormously expensive in Egypt because of the quality of housing available to
median income residents. There are also great differences in non-quantifiable
quality-of-life factors for home owners. A friend of mine who lived in Egypt
said one of the frustrations was noise at night that arises because so many
Egyptians are outdoors at all hours of the night to escape the heat. Night noise
is not so much a problem in Iceland, Norway, and Switzerland.
Variations in housing costs
vary within nations, and in some nations these variations are much greater than
in other nations. For example, the variation in housing costs in Iceland is much
lower than the variation in housing costs in the USA (think of housing costs in
San Francisco versus Topeka). Or think of variation in housing costs within
given cities like New York, Chicago, and San Antonio.
Transportation costs vary
greatly with geography. Japan is a relatively small nation with very efficient
public transportation. The USA, Russia, China, and India are relatively large
geographic nations where having public transportation everywhere like Japan has
public transportation everywhere is not economically feasible.
Taxes are difficult to compare
between nations. Some countries like Bermuda, Iceland, and Norway can divert
taxes to social services (think health care) since relatively little must be
spent on national defense. For whatever reason, the USA, Russia, India, and
China divert a much higher proportion of tax revenues into national defense
(think nuclear arms and air force spending alone).
There's an enormous problem is
comparing hugely different populations. Bermuda has a permanent population of
slightly over 70,000 residents making labor costs relatively high. Egypt has 100
million residents making labor costs relatively cheap.
I could go on and on, but I
suspect that by now you get the point.
**How to Mislead With
Statistics
Virtual Events Zooming, But
Will It Last?
While
Zoom seemed to be one of few companies actually benefiting from the
lockdown, the picture isn’t quite as rosy as it said. Despite some notorious
security issues, the company posted last month that its daily active users
had jumped from 10 million in December to 300 million in April. But it turns
out Zoom was counting meeting participants, not individual users — likely a
vastly inflated number since people can be in multiple meetings per day. The
company quietly corrected the post, but when questioned said it was a
“genuine oversight.”
People are dying from
coronavirus because clinical research is too slow (and I
think almost impossible given our changed way of life since March 2020)
https://marginalrevolution.com/marginalrevolution/2020/04/people-are-dying-from-coronavirus-because-research-is-too-slow.html
Jensen Comment
One of the main reasons for general clinical research delay (maybe forever) is
that developers fear massive class action lawsuits. This is why, in most
instances, Big Pharma outsources clinical trials to medical schools. However, in
some instances the costs of this outsourcing combined with fear of lawsuits
leads to failure to test at all (particularly in heart medications and devices
mentioned in the above article). Added to the delay is that for successful
research outcomes there is the added delay of cranking up production and fear
that nations who cheat on patents will develop black market versions of the
medication or medical device. In the case of the coronavirus Bill Gates is
investing in early production of the seven leading prospects of vaccination to
avoid some of the production delays.
The big
problem is that there's such a long delay imposed by nature itself. How
often have we heard that a super flu vaccination is in production only to
discover at the end of the season that it's been a flakey flu vaccination.
Viruses mutate so quickly and unpredictably. More accurate testing of a
vaccination alternative takes years and years --- as in the case of the
successful smallpox vaccination.
Then there's the issue of ethics. Suppose
coronavirus Alternative X is being tested among 500 people chosen at random to
receive Alternative X versus 500 who will receive a placebo.
Do you want to be one of those test
subjects put in a chamber that exposes each of these people to very high risk of
infection? Instead we must let those people be exposed in "normal life,"
and in normal life most people aren't being exposed to the coronavirus,
especially during and after the lockdowns. In the olden days we might go to an
third-world country and pay poor people whatever it takes to be put into a high
risk infection chamber. This is now rightly considered a violation of human
rights to even let poor people have such a choice.
Clinical studies of coronavirus vaccinations will
have a high risk of false negatives
for people in both test groups simply because they were not exposed in a
high risk way to the virus. This is particularly a problem for test subjects in
nursing homes who are now being more carefully shielded from exposure.
It would be monumentally difficult to run clinical
trials in New Zealand or Mongolia or Siberia where so many people are
geographically separated due to huge distances between very small towns and
farms.
Added to this is the issue is a great mystery of
the coronavirus immunities.
Covid-19: South Africa versus Louisiana
As of April 17 South Africa reports
2,605 Covid-19 cases to date and
48 deaths
https://www.arcgis.com/apps/opsdashboard/index.html#/bda7594740fd40299423467b48e9ecf6
South Africa has almost 60 million people with over 80% being Black African
As of April 8 Louisiana reports
17,030 Covid-19 cases with 652
deaths (with an abnormally high proportion being African American)
https://gov.louisiana.gov/index.cfm/communication/viewcampaign/2605?&uid=h5d%2Afvl6n%5B&nowrap=1
Louisiana has 4.6 million people with over 32% being African American
Even with reporting discrepancies there should be an investigation of why
African Americans are so much more prone to die from Covid-19 than Black
Africans. There are many possible reasons even after doubting the degree of
testing and poor record keeping in South Africa ---
https://wgno.com/news/health/coronavirus/louisiana-covid-19-cases-reach-12496-with-409-deaths/
International comparisons of most anything are complicated. This is especially
so in the case of the great 2020 pandemic!
**How to Mislead With
Statistics
The average cost of car
insurance in the US ---
https://www.businessinsider.com/personal-finance/average-cost-of-car-insurance
Jensen Comment
The article initially warns of some misleading things about the averages listed
for states. Much depends upon age and driving records. Also much depends upon
package deals where home owner's insurance, personal liability insurance, and
auto insurance are bundled into one deal.
Also much depends upon such
things as deductible choices (having a high deductible usually saves a lot of
money) and "only paying for what you need" such as choosing to forego collision
and theft insurance on older vehicles. Risk of car theft varies greatly by state
such as Texas versus Vermont.
**How to Mislead With Statistics
The wealthiest 1 percent of Americans own more
than 80 percent of all personal shares of stock ---
From an SDS (students for democratic society) manifesto:
https://johnhcochrane.blogspot.com/2020/01/great-society-review.html
Jensen Comment
This is an example of using obscure definitions (e.g., "personal shares") to
mislead. Actually over half of the workers in the USA have pension funds that
mostly or entirely depend upon shares of common stocks and corporate bonds.
Pension funds own over half of the shares of larger corporations. Most of
workers having those pensions are low income or middle income workers like
teachers, municipal workers, business employees, professors, etc.
The misleading part of the above quotation is that if stock market prices
collapse that the only investors hurt will be the wealthy 1%. Nothing could be
further from the truth. Only Bernie Sanders promises that government will pay
("guarantee) all worker pensions in the USA, but he does not tell you that when
the capital markets collapse under his socialist programs guaranteeing all USA
pension obligations will cost more than his Medicare-for-All program ---
https://berniesanders.com/issues/workplace-democracy/
In one way or another nearly all workers in the USA depend upon maintaining
viable capital markets in stocks, bonds, and real estate. What is the Democratic
Party promising to maintain prices in those capital markets? Like it or not
governments in the USA have not set aside funds to guarantee all the pensions of
past, present, and future workers. The only feasible
way to guarantee those pensions is to grow (not just maintain) prices in the
capital markets.
**How to Mislead With Speculative Assumptions
Capitalism Has Failed in Fighting Coronavirus ---
https://www.nakedcapitalism.com/2020/04/capitalism-has-failed-in-fighting-coronavirus.html
Jensen Comment
Socialists are embarrassed by not being able to point to a single socialist
takeover in the real world that succeeded. But they are great at making
speculative assumptions without the least bit of evidence.
For example, the above article assumes that socialist regimes would've
stockpiled the needed supplies for all possible pandemics. This is garbage. Was
Mao stockpiling pandemic supplies for his starving peasants? Firstly there are
too many kinds of possible pandemics and other looming disasters to stockpile
for every contingency. Secondly, socialist regimes have repeatedly demonstrated
an inability to feed the people now, let alone spend trillions on stockpiling
supplies to save their lives if future pandemics hit.
I cringe when reading the following written by an academic:
A worker-coop based economy—where workers
democratically run enterprises, deciding what, how and where to produce, and
what to do with any profits—could, and likely would, put social needs and
goals (like proper preparation for pandemics) ahead of profits.
There's no evidence that worker-coop economies will make enormous sacrifices
needed for social goals. If fact there's no evidence of a single worker-coop
economy that sustained itself in the real world.
There is evidence in capitalist economies
(like the Nordic nations) are willing to tax profits for social goals, but then
so is the USA willing to do so or we would not have Social Security, Medicare,
Medicaid, and one of the more generous welfare systems in the world (think of
the tens of millions of people from all over the world trying to emigrate to the
USA). There aren't many nations giving nearly all its children two meals a day
in or out of school. I followed a school bus yesterday that stopped at nearly
every house on the road to hand out a large bag of food to each child.
I hate to say it but the above article is an example of misleading speculative
assumptions.
**How to Mislead With Mathematics
Marty Weitzman’s Noah’s Ark Problem ---
https://marginalrevolution.com/marginalrevolution/2019/08/marty-weitzmans-noahs-ark-problem.html
Jensen Comment
The article raises its own concern about the analytics.
Tom Lehrer on Mathematical Models and Statistics ---
http://www.youtube.com/watch?v=gfZWyUXn3So
You must watch this to the ending to appreciate it.
Mathematical Analytics in Plato's Cave
http://faculty.trinity.edu/rjensen/TheoryTAR.htm#Analytics
Can the 2008 investment banking failure be traced to a math error?
Recipe for Disaster: The Formula That Killed Wall Street --- http://www.wired.com/techbiz/it/magazine/17-03/wp_quant?currentPage=all
Link forwarded by Jim Mahar ---
http://financeprofessorblog.blogspot.com/2009/03/recipe-for-disaster-formula-that-killed.html
Some highlights:
"For five years, Li's formula, known as a Gaussian
copula function, looked like an unambiguously positive breakthrough,
a piece of financial technology that allowed hugely complex risks to be
modeled with more ease and accuracy than ever before. With his brilliant
spark of mathematical legerdemain, Li made it possible for traders to
sell vast quantities of new securities, expanding financial markets to
unimaginable levels.
His method was adopted by everybody from bond
investors and Wall Street banks to ratings agencies and regulators. And
it became so deeply entrenched—and was making people so much money—that
warnings about its limitations were largely ignored.
Then the model fell apart." The article goes on to show that correlations
are at the heart of the problem.
"The reason that ratings agencies and investors
felt so safe with the triple-A tranches was that they believed there was
no way hundreds of homeowners would all default on their loans at the
same time. One person might lose his job, another might fall ill. But
those are individual calamities that don't affect the mortgage pool much
as a whole: Everybody else is still making their payments on time.
But not all calamities are individual, and
tranching still hadn't solved all the problems of mortgage-pool risk.
Some things, like falling house prices, affect a large number of people
at once. If home values in your neighborhood decline and you lose some
of your equity, there's a good chance your neighbors will lose theirs as
well. If, as a result, you default on your mortgage, there's a higher
probability they will default, too. That's called correlation—the degree
to which one variable moves in line with another—and measuring it is an
important part of determining how risky mortgage bonds are."
I would highly recommend reading the entire thing that gets much more
involved with the actual
formula etc.
The “math error”
might truly be have been an error or it might have simply been a gamble with
what was perceived as miniscule odds of total market failure. Something similar
happened in the case of the trillion-dollar disastrous 1993 collapse of Long
Term Capital Management formed by Nobel Prize winning economists and their
doctoral students who took similar gambles that ignored the “miniscule odds” of
world market collapse -- -
http://faculty.trinity.edu/rjensen/FraudRotten.htm#LTCM
**How to Mislead With statistics
Ages of Authors When They First Publish a Bestseller ---
https://www.inthebook.com/en-us/bestsellers/
Based upon "best sellers" from the following list
https://en.wikipedia.org/wiki/List_of_best-selling_books
Jensen Comment
I'm not all that critical of this particular article that seems to be a study
that can be replicated using the same data source.
Note that these are averages subject to the usual misleading thing about
averages such as having different distribution variances and skewness and the
impact of outliers. Sample sizes are so small that the graphic gives us
some information about distributions such as when Fantasy authors have a much
smaller variance than Romance authors in the article above.
Becoming a best selling author is complicated because in so many cases its a
matter of marketing as well as skills of the author. Certain publishers invest
more in publicity and shelf space and promotions. There's also possible of dirty
gaming with reviews.
Defining a "best seller" can be controversial
https://en.m.wikipedia.org/wiki/Bestseller
Some of the popular "best seller" listings are rigged by bias and fraud ---
https://www.bizpacreview.com/2017/09/05/top-conservative-publisher-exposes-ny-times-best-seller-list-rigged-liberal-fraud-cuts-ties-532914
Also some books are difficult to classify into categories such as when a
"mystery" novel is also a "thriller" or when a "romance" novel is also
"historical fiction."
Data are fuzzy about number of books published each year, but some estimates
range up to nearly one million in the USA alone. This makes becoming a "best
selling author" for the first time quite difficult. It may be easier to write a
popular movie that becomes a book rather than the historic practice of a book
becoming a movie. Of course after an author makes it big on the first book it
becomes easier to make it big on follow up books, especially after an author
like John Grisham attracts a "following."
What is really hard is for a best selling fiction author to also impress
academic critics. It's especially hard for a politically conservative author to
gain academic acclaim --- sort of like passing a camel through the eye of a
needle.
Never trust the reported numbers of copies of a book authored by a celebrity
such as a political leader. Friends of that celebrity may buy up truckloads of
poorly written books just to funnel money to that celebr
Jacinda Ardern ---
https://en.wikipedia.org/wiki/Jacinda_Ardern
Leadership Greatness
**How to Mislead by Comparing Apples to Oranges
New Zealand’s Prime Minister May Be the Most Effective Leader on the
Planet ---
https://www.theatlantic.com/politics/archive/2020/04/jacinda-ardern-new-zealand-leadership-coronavirus/610237/?utm_source=newsletter&utm_medium=email&utm_campaign=atlantic-weekly-newsletter&utm_content=20200419&silverid-ref=NTk4MzY1OTg0MzY5S0
Jensen Comment
Scholars know very well that leadership success varies greatly with time and
place. Churchill was what England needed in WW II but not what was needed after
the war. Herbert Hoover was not a good president of the USA 1929-1933 but may
have been a great president 1940-1948.
Jacinda Ardern’s leadership during the 2020 pandemic seems to be what New
Zealand needed, but would she be as effective when leading other nations after
the pandemic is ended?
Great leaders were at the right place at the right time. Lousy leaders were
either lousy leaders in general or more simply at the wrong place at the wrong
time.
Calling a leader great or lousy is also dependent upon performance criteria.
Is a military leader to be judged primarily upon successful strategies in time
of war or admiration by those under his command as they go down in defeat (think
Robert E. Lee).
Leadership must also be judged on the basis of a time interval such as
short-term versus long-term. For example, Castro had admirable success in
turning Cuba around in the first two decades following his revolution.
However, in the late 20th Century even Castro admitted that his economic miracle
was just not working, and now Cuba is returning to his hated capitalism.
I judge the economic performance of New Zealand in the 20th Century as
mediocre relative to Singapore. Jacinda Ardern’s leadership of New Zealand in
the 21st Century seems to be more of the same in terms of economics. She may be what's needed during a
pandemic, but I question whether she's the best choice when the lockdown is
lifted.
She may be effective when dividing up a small pie, but maybe she should
be judged by the size of the pie she bakes. New Zealand has 10 million sheep and
no Silicon Valley. Many old people would like to emigrate to New Zealand but the
smartest young poor people of the world prefer to emigrate to the USA rather than New
Zealand.
**How to mislead with
statistics
Here's how much flight
attendants in 10 airlines say they make ---
https://www.businessinsider.com/how-much-flight-attendants-make-in-major-airlines-2019-5
Jensen Comment
You cannot compare all hourly wages workers without being misleading in terms of
what what extra hours it takes to get hours that pay. For example, an hourly
factory worker typically gets eight hours of pay for each working day, but there
are no extra unpaid hours required as long as you do not count commuting time
that varies with choices of where to live outside of work. Flight attendants, on
the other hand, often put in extra hours for which they are not paid such as
when a flight attendant puts in ten hours on a flight to London and then has to
wait 14 hours for a return flight for pay. Sure there's discretionary personal
time in the 14 extra hours, but it's not the same discretionary time as time at
home with family. And then there are the days of not being paid while waiting
for an opportunity to catch a paying flight. A flight attendant supposedly
making $35 per hour may in reality be making less per week than an hourly worker
having steady work eight hours per day at least five days per week every week.
Gig workers paid by the job can
have even more misleading "hourly wages." An adjunct professor earning $4,500
for teaching a course that meets for 45 hours per term is seemingly is getting
$100 per hour. But when you add in the time it takes to prepare a course, grade
papers and exams, and communicate (think office hours and email) with students
outside of class the pay rate is probably much less than $100 per hour. And then
there are the unpaid days between classes and between terms.
It's very hard to compare
compensation for different lines of work. You can compare annual wages on W-2
tax forms, but that form does not compare the differences in working time versus
discretionary time. A teacher may report $65,000 to the IRS while an accountant
may also report $65,000 to the IRS. But the accountant may put in 40 hours per
week for 50 weeks of the the year. The teacher has several months of free time
for summers, holidays, term breaks, etc.
My point here is that it's very
difficult to compare compensation levels for differing careers. For example,
when I was a college student it seemed like my professors were "working" less
than 15 hours per week. However, these professors were also responsible for
working hours that I never observed such as study and research time, service
time on campus, service time off campus, etc. When I became a professor I was
often working more than 60 hours per week and was unable to find the time I
wanted for my family.
**How to Mislead With
Statistics
Billionaires Have More
Wealth Than 60% of the World's Population, Report Finds ---
https://time.com/5768346/billionaires-wealth/?utm_source=newsletter&utm_medium=email&utm_campaign=the-brief&utm_content=20200121&xid=newsletter-brief
Jensen Comment
This is misleading in the sense of controversial use of the word
"have." Elon Musk is a billionaire who founded
Tesla Inc. and owns about 22% of the shares of Tesla (which essentially gives
him control for the company's future). Suppose hydrogen technology suddenly
becomes vastly superior to lithium battery technology for vehicles. Tesla Inc.
would most likely go instantly bankrupt and any its tangible assets would become
property of the creditors who loaned lots of money in Tesla for those tangible
assets.. Elon Musk's shares now valued at billions of dollars would be instantly
worthless.
Elon Musk's billions in wealth
are essentially the current value of his residual ownership in corporate shares.
Residual owners are the last investors in a corporation to be paid off if the
corporation collapses. Most billionaires, like Elon Musk, have their billions
tied up in residual ownership that is the highest form of financial risk. There
are of course some exceptions where billionaires have invested in lower risk
alternatives, but most of the billionaires on earth have taken on high financial
risks relative to other investors in the world.
My point here is that to "have"
more wealth generally entails "having" more financial risk, although that risk
can be hedged in a way that reduces risk by "having" less wealth in order to
hedge. Articles such as the one cited above generally ignore financial risk that
billionaires also "have." If Bernie Sanders or Elizabeth Warren want to transfer
wealth by virtually confiscating billionaire wealth then they are also
transferring the financial risk accompanying this wealth. Thus confiscating
billionaire wealth comes at a cost to somebody. For example, Bernie Sanders
would like to confiscate nearly all of Elon Musk's shares of Tesla and put them
into a trust for all 45,000 Tesla workers. Those workers, however, will also
have the financial risk that accompany residual ownership. .
Now we come to the essence of
what Elon Musk or a worker trust "has" with his 22% of the shares of Tesla Inc.
Tesla Inc. is thought by many to be a Ponzi fraud scheme.
The billions in share value are not due to anything
tangible. The billions in value are speculations on price movements
of the future. Today all Tesla share value is air lighter than helium. There's
nothing to Elon Musk's billions other than a residual interest in hope for the
future of Tesla Inc. Elon Musk owns relatively little in terms of tangible
value. It's all intangible hope (Ponzi speculation) for the future.
Not all billionaires have as
much financial risk as Elon Musk. But certainly most billionaires have a lot of
financial risk that accompanies their wealth. If government confiscates their
wealth then government also takes on the financial risk. If government puts
those shares in worker trusts then the worker trusts bear those financial risks.
If government sells those share then buyers of those shares also are buying into
the financial risks.
We might even hypothesize that
"Billionaires Have More Financial Risks Than 60% of the World's Population."
Here's a humorous and serious TED talk that seriously argues why the world
needs billionaires
https://www.ted.com/talks/harald_eia_where_in_the_world_is_it_easiest_to_get_rich
Why did Cuba abandon its socialist/communist dream of equality for everybody?
The Guardian: This was the egalitarian dream of Cuba in the 1960s: For years in
Cuba, jobs as varied as farm workers and doctors only had a difference in their
wages of the equivalent of a few US dollars a month.
https://www.theguardian.com/world/2008/jun/12/cuba
**How
to Mislead With Statistics
David Giles: I think that R2 is one of the least
important statistics to include in our results, but we all do it
https://davegiles.blogspot.com/2019/10/reporting-r-squared-measure-for-count.html
(R2) -
or its "adjusted" counterpart - when reporting the results of a least
squares regression. Personally, I think that R2 is one of the
least important statistics to include in our results, but we all do it.
(See this
previous post.)
If the regression model in question is linear
(in the parameters) and includes an intercept, and if the parameters are
estimated by Ordinary Least Squares (OLS), then R2 has a number
of well-known properties. These include:
1.
0 ≤ R2 ≤
1.
2.
The value of R2 cannot
decrease if we add regressors to the model.
3.
The value of R2 is
the same, whether we define this measure as the ratio of the "explained sum
of squares" to the "total sum of squares" (RE2); or as
one minus the ratio of the "residual sum of squares" to the "total sum of
squares" (RR2).
4.
There is a correspondence between R2 and
a significance test on all slope parameters; and there is a correspondence
between changes in (the adjusted) R2 as regressors are added, and
significance tests on the added regressors' coefficients. (See here and here.)
5.
R2 has
an interpretation in terms of information content of the data.
6.
R2 is
the square of the (Pearson) correlation (RC2) between
actual and "fitted" values of the model's dependent variable.
However, as soon as we're dealing with a
model that excludes an intercept or is non-linear in the parameters, or we
use an estimator other than OLS, none of the above properties are
guaranteed.
For example, when reporting a linear model
that's been estimated by Instrumental Variables, we get different R2 values
depending on which of the two definitions noted in property 3 above is
adopted. Similarly, when estimating Logit and Probit models (for instance),
most econometrics packages report several "pseudo-R2" statistics,
because there's no single measure that has all of the desirable
features that we're used to in the linear model/OLS case.
So-called "count" data arise frequently in empirical economics. These are
data that take values that are only non-negative integers, namely 0, 1, 2,
3, 4, ........ Models for such data are often based on the Poisson or
negative binomial distributions, although other distributions may also be
used. Regressors enter the model by equating the mean of the chosen
distribution to a positive function of these variables and their
coefficients.
For instance, if the yi data (i = 1, 2, ...., n) are being
modelled using a Poisson distribution with a mean of μ, then we typically
assign μi = exp[xi'β], using familiar regression
notation. The resulting non-linear model is then estimated by MLE (or quasi-MLE).
Continued in article
Robustness Statistics ---
https://en.wikipedia.org/wiki/Robust_statistics
**How to Mislead With Statistics
State gun laws, gun ownership, and mass shootings in the US: cross
sectional time series ---
https://www.bmj.com/content/364/bmj.l542
Outcome variables
We used the Supplementary Homicide Reports from the Federal Bureau of
Investigation’s Uniform Crime Reporting System (1998-2015) to obtain counts
of mass shootings by state. We compiled these data in line with the most
commonly used definition of a mass shooting: one event in which
four or more individuals were killed by a perpetrator using a firearm and
the perpetrator themselves did not count toward the total number of victims.
These mass shooting events were analyzed in total and stratified as to
whether the mass shooting was domestic or non-domestic in nature. Domestic
mass shootings included instances where the perpetrator committed the act
against an immediate family member or partner. Non-domestic mass shootings
included all other types of relationships, such as acquaintances, employees,
employers, friends, neighbors, strangers, extended family members, and
others. Florida was excluded due to non-participation in the Uniform Crime
Reporting System program.
Jensen Comment
The above article is badly misleading in that its conclusions are based largely
on rounding error in computing averages and denominator effects that destroy
robustness. The study focuses on rare events, it's conclusions and displays are
unstable to slight sensitivity analysis.
I will focus my criticisms on Figure 2 where Rhode Island, Delaware, New
Hampshire, North Dakota, and Arkansas each have rounded averages of zero mass
shootings across 17 years. There were mass shootings in those five states, but
their averages round to zero. The worst state in Figure 2 is Vermont that
has the highest average of three mass shootings across those same 17 years. Thus
the lowest five states have zero mass shooting averages and the highest state
has an average of three mass shootings. The difference from lowest to highest
(in Figure 2) I suspect is heavily to heavily be rounding error and is not as
significant as it appears in Figure 2.
There also is what is known as a denominator effect that destroys robustness
in Figure 2 due to the low population of 600,000 people in Vermont. Such a low
population destroys much of the robustness in comparing the highest mass killing
state (Vermont) with more populated states like California, New York, Arkansas
and Delaware. The same applies to low population states of Wyoming, Montana,
North Dakota, New Hampshire, and Alaska.
The study concludes as follows:
Discussion
Our analyses show that US state gun laws have become more permissive in
recent decades, and that a growing divide in
rates of mass shootings appears to be emerging between restrictive and
permissive states. A 10 unit increase in the
permissiveness of state gun laws was associated with an approximately 9%
higher rate of mass shootings after adjusting for key factors. A 10%
increase in gun ownership was associated with an approximately 35% higher
rate of mass shootings after adjusting for key factors. On the absolute
scale, this means that a state like California, which has approximately two
mass shootings per year, will have an extra mass shooting for every 10 unit
increase in permissiveness over five years. It will also have three to five
more mass shootings per five years for every 10 unit increase in gun
ownership. These results were also consistent across multiple analyses and
when stratified as to whether or not mass shootings were committed by
someone in a close relationship with the victims.
I contend that the above conclusion is unstable (not robust) such as the
conclusion that a restrictive state like Rhode Island has a hugely greater
divide (an average of zero mass shootings per year) with a permissive state
Vermont (with an average of three average mass shootings) --- a conclusion
that does not, based upon this study, justify legislation for more restrictive
gun laws to reduce mass shootings. The authors of the above study are not
responsible in pointing out the lack of robustness in their displays and
discussion. For example the five states shown in Figure 2 to have zero average
mass shootings all had mass shootings that were so rare they rounded to zero.
The worst state (Vermont) had an average rounded up to three in Figure 2. But in
reality the difference between the worst state (Vermont) and the five best
states is not really 3-0 = 3. This difference is
somewhat due to rounding differences combined with denominator effects rather
than robust statistical outcomes.
The first rule of statistical analysis is discuss the robustness of the
outcomes. The above study lacks a robustness analysis.
Mass shootings aren’t growing more common – and evidence
contradicts common stereotypes about the killers ---
https://theconversation.com/mass-shootings-arent-growing-more-common-and-evidence-contradicts-common-stereotypes-about-the-killers-121471
**How to Mislead With Article
Titles
The problem in the article below is the definition of the word "exactly." Since
Stanford Medical only admits an average of 90 students out of more than 7,500
highly qualified applicants there is no one "exact" way under "sufficient
conditions" to get a given applicant into the entering class. In mathematics we
talk about necessary conditions versus sufficient conditions. The article below
deals with what are mostly necessary conditions but not sufficient conditions.
And since there can be tradeoffs doing really, really well on some necessary
conditions most likely can offset doing not quite so well on other necessary
conditions. For example, being an autistic native American Veteran with one leg
with a perfect MCAT score and a willingness to serve for a lifetime at minimum
wage on a native American reservation probably will probably give you an edge
over all other applicants. You might even get away with bringing up
controversial topics and wear a MAGA hat during the interview.
Here's exactly how to get
accepted into Stanford University's School of Medicine ---
https://www.businessinsider.com/how-to-get-into-stanford-university-medical-school
Meeting a minimum threshold on the MCAT admission test
Get
the right reference letters, and get them early
Use
your essay to talk about not only your science background but also your
longer-term goals as a doctor
Prepare to answer critical-thinking interview questions, and avoid bringing
up controversial topics
**How to Mislead With Statistics
How Do Millennials and Boomers Differ on Patriotism, Hard Work, and Other
Values?
https://jborden.com/2019/08/27/how-do-millennials-and-boomers-differ-on-patriotism-hard-work-and-other-values/
Jensen Comment
My biggest criticism of this study is failure to account for how definitions
change over the decades. Exhibit A is the definition of "hard work." On the farm
even little kids in my day shoveled manure and milked cows from before daylight
until after the sun had set. The only relief was on school days. Decades ago
when I was a kid school hours were from 8:00 am to 4:30 pm with a half hour for
lunch (which we brought from home). Today New Hampshire legislators had to pass
a law just to make sure teachers are in school at least 4.5 hours per day.
Without recess and phys ed, teachers can go home shortly after noon --- and they
still think they're overworked. Migrants desperate for work are now the only
ones who will do such jobs as dig sweet potatoes in Alabama, pick crops in
California, and do roofing work in Texas. The typical hotel housekeeper or taxi
driver working 12-hr shifts in large cities can barely speak any English because
so many of our millennials don't apply for that kind of real work that our
parents were glad to have available.
My grandparents had great financial insecurity --- no such thing as Social
Security disability coverage or even medical insurance. When you became crippled
and/or old without funds either your family took care of you or you went to a
really minimal care "county home." Many rode the rails as hoboes begging for
handouts along the way. There were no community shelters or free food centers.
There was more incentive to have a large family so that your children would take
care of you in hard times. Instead of paying $50 for expensive dental work you
did like my grandmother and had your teeth all pulled at the same time and opted
for $5 dentures.
I'm not sure that "belief in God" changed as dramatically as surveys think
they reveal. My grandmothers were certainly a believers, but I'm not so certain
about my grandfathers. My grandfathers dutifully attended church because
church was the center of their community life --- church was were you met your
lifelong friends who helped you out in times of trouble. Now we expect the
government and insurance payouts to help us out in troubled times and h
ave
less need for our church community centers. We may not have changed our belief
in God as we changed
the role of church in our lives.
**How to Mislead With Statistics
Excerpts taken from the article: “A Famous Study Found That Blind
Auditions Reduced Sexism in the Orchestra. Or Did It?” ---
https://replicationnetwork.com/2019/10/25/in-the-news-reason-october-22-2019/
**How to Mislead With Statistics
For years, the estimates of nonfatal gunshot injuries published by the
Centers for Disease Control and Prevention have grown increasingly unreliable
---
https://fivethirtyeight.com/features/how-one-hospital-skewed-the-cdcs-gun-injury-estimate/
**How to Mislead With Statistics
Here's how much surgeons, lawyers, and 20 other top-earning professionals
make per hour
https://www.businessinsider.com/hourly-salaries-surgeons-lawyers-2016-9
Jensen Comment
There many ways such analyses are (and rankings) are misleading. For example,
surgeons are shown (on average) to make less per hour than anesthesiologists.
I'm not sure you can even compare the hourly wages of these two types of
professions unless you factor in the added time surgeons spend in pre-surgery
office visits and post surgery visits both in the hospital and in the surgeon's
office. Then there's the added time surgeons give to studying how they're going
to perform complicated surgeries. And there's the added costs that many surgeons
have for office space, office nurses, receptionists, accountants, etc.
Anesthesiologists are often given free hospital offices and nurses and other
assistants.
Then there's the problem of factoring in investment of time and expense of
becoming physicians relative to other workers like restaurant dishwashers and
taxi drivers.
It's hard to compare lawyer hourly wages with many other professions since
lawyers invest heavily in professional services of others to conduct basic
investigations (think of what Perry Mason invested in his investigators), legal
aids who conduct legal research on cases, travel time where trips may be partly
professional and partly personal. And lawyers are often paid based upon
contingencies such as jury awards that withstand changes in appellate courts.
Many are also paid on profit sharing formulas in their firms.
Probably the most difficult profession to evaluate by hourly wages are
professors who devote so much of their time to become scholars in general and
researchers building and maintaining reputations in addition to teaching and
both internal and external services.
Add to this the usual problems of comparing averages is misleading without
also comparing standard deviations, skewness (the word kurtosis sounds smarter),
impact of outliers, etc.
The bottom line is that when comparing incomes of most all types of
professionals, reducing the comparison metrics to hourly wages is probably more
misleading than helpful.
**How to Mislead With Data Visualizations
Even the most beautiful maps can be misleading ---
https://phys.org/news/2019-11-beautiful.html
From reporting election
results to
issuing weather
forecasts,
maps offer a powerful, accessible and visually appealing way to convey
complex information. But as a researcher focusing on data visualisation, I'm
aware that even the most beautiful maps can introduce some degree of
misrepresentation.
To see how, consider the
latest statistics on deprivation released by the UK government. The
government ranked 32,844 neighbourhoods, based on measures of deprivation
such as income, employment, health and crime. The figures were widely
reported, from the
BBC to The
Guardian and the Daily
Mail, reigniting long-standing debates about persistent
inequality in England.
Of course, many outlets used
maps to share these findings with the public. But using
traditional boundaries can divert readers' attention away from important
information. In the
BBC's map of deprivation across local authorities, for instance,
sparsely populated rural
areas dominate a disproportionately large area, while urban
areas, such as London, containing millions of people, are
rendered almost invisible.
Distorted data
Recent research
shows that people can interpret information inaccurately, when
they look at maps with these shortcomings. But other techniques can be used
to create a more accurate impression of the underlying data. For instance, cartograms deliberately
distort geography by scaling areas according to a specific variable, such
as local
population.
Dorling cartograms take this one step
further, scaling areas according to a specified variable, but also
representing each area using the same shape, such as a square or a circle.
Other methods achieve uniformity in both size and shape: hexograms and geogrids transform
the original boundaries of the map into hexagons or squares of the same
size, while still aiming to preserve their original arrangement.
Mapping neighbourhood deprivation
in England represents a significant challenge, even for experts. This is
because the government defines a neighbourhood as a "lower
super output area" – each of which contains around 1,500
residents.
Because highly deprived
neighbourhoods tend to be densely populated, they are less visible on a
regular map. By contrast, wealthier suburban areas—which are often less
densely populated and therefore much larger—dominate the map. So there's a
risk that readers might draw inaccurate conclusions about the level of
deprivation in any given area.
Shaping up
Using Dorling
cartograms scaled by resident population, and regular hexagonal geogrids,
I've attempted to minimise any misrepresentation. Take the example of
Blackpool, which was ranked the
most deprived local authority in England. Around 42% of neighbourhoods in
Blackpool are in the top 10% most deprived in England (the "first decile").
Yet these neighbourhoods only make up around 29% of the city's actual area.
Continued in article
**How to Mislead With Statistics
Beware of persistence studies in regression analysis ---
https://marginalrevolution.com/marginalrevolution/2019/06/beware-of-persistence-studies.html
Targeted Taxes: Localities Take Aim at Large Employers to Solve
Homelessness and Transportation Challenges ---
https://poseidon01.ssrn.com/delivery.php?ID=269126002097094115101106070100094068122032049015054052117086126094066078121117116101033022034012040098112080066106124118115124111029057079021093028065068071120082127095033045004070020070021093027112070029104089116090007126077020120114107124119110017005&EXT=pdf
Many localities are facing
unprecedented challenges—such as a dramatic rise in homelessness and
insufficient transportation infrastructure—that have reached crisis levels.
These localities are in a precarious position. If they do not solve these
problems quickly, or if they impose overbearing and poorly designed taxes,
there will be dire economic and social repercussions.
In response to these challenges,
several localities recently enacted or proposed taxes targeted directly at
large businesses, with revenues allocated explicitly for a designated
purpose. Localities are gravitating toward targeted taxes for several
reasons. Some assert that the success of large employers within the
locality contributed to, or even directly created, these challenges.
Perhaps most importantly, targeted tax laws serve a clear expressive
function. Depending on the locality’s primary objective, targeted taxes may
be problematic and counterproductive.
This Article begins by examining
the recent local targeted tax provisions, which have crucial distinctions in
motivations and mechanics. The Article then undertakes a tax policy and
constitutional analysis of these targeted taxes, and considers whether they
are properly characterized as a tax or a fee. The Article concludes with
several proposed alternatives that will generate the requisite revenue—and
may serve an expressive function—more effectively than targeted taxes.
INTRODUCTION ...
I. TARGETED TAX LANDSCAPE .
A. Seattle Homelessness Tax
..
B. San Francisco Business
Taxes
C. Mountain View
Transportation Infrastructure Tax .
D. Cupertino Transportation
Infrastructure Tax ...
E. New York City Transit
Taxes ..
F. “Millionaire” Taxes ...
G. Portland Clean Energy &
Excessive CEO Compensation Taxes
II. THE TROUBLE WITH TARGETED
TAXES
A. Negative Economic Impact
...
B. Complicating Tax Regimes
and the Business Environment ..
C. Constitutional
Considerations ...
D. Additional Policy
Considerations – Crises and Revenue Raising Constraints
E. Blurring the Tax Versus
Fee Distinction
III. SUPERIOR ALTERNATIVES ..
A. Partnering to Foster
Voluntary Contributions ..
B. One Comprehensive Local
Business Tax ..
C. Improving Target Accuracy
..
IV. CONCLUSION .
Jensen Comment
The most important thing to note is that taxable business firms do not pay
taxes. Taxes imposed on those
firms are ultimately paid by customers.
The first thing to ask is what customers?
For example, Portland Oregon's retailer tax hits Portland shoppers the most:
Large retailers mounted
a campaign against the tax, but proponents such as the Green Advocacy
Project and Sierra Club effectively supported it.201 One of the most
significant concerns was whether the tax incidence would ultimately fall on
Portland consumers instead of the targeted large businesses—acting like a
regressive sales tax. The provision itself contemplates retailers passing
the tax through to consumers, and there is some early evidence of this
passthrough occurring with certain sales
Next consider a gross receipts tax imposed
upon all revenues of a company headquartered in a city such as a gross receipts
tax imposed by Seattle or Washington State on all worldwide revenues received by
Amazon headquartered in Seattle. Or similarly suppose the tax is on all net
profit of Amazon. What's wrong with this is hugely wrong
taxation without representation When Bob Jensen buys a shirt from
Amazon online from New Hampshire he in effect is being taxed by Seattle or the
State of Washington. He has no vote regarding the amount of tax included in the
price of the shirt. Similarly, if this is for Seattle or Washington Schools most
worldwide customers of Amazon end up paying for Seattle or Washington schools
while in the same year they are also supporting school taxes in their own
countries, states, and cities of residence. Of course Bob Jensen can protest and
elect to no longer by anything from Amazon, which in turn could wipe out Amazon
if virtually all customers of Amazon worldwide protest a headquarters tax
imposed in this manner.
A gross receipts tax is not the same as a local sales tax. A
local sales tax can and is imposed on sales transactions within a city or state,
but local sales taxes in Seattle cannot be imposed on sales transactions taking
place in Sugar Hill, New Hampshire. Recent legislation forces Seattle residents
who buy online from certain out-of-state vendors (think online buying from
Walmart headquartered in Arkansas) to pay a Seattle sales tax but not residents
outside Seattle. Seattle voters can vote regarding if and how much they pay in
such local sales taxes.
Another thing that's wrong with a gross receipts tax is that
non-taxable entities can end up paying a gross receipts tax. For example, if New
Hampshire tax-exempt public schools pay for cloud computing space rented by
Amazon New Hampshire schools end up paying a Seattle gross receipts tax.
You can find out other things that are wrong with gross receipts
taxes in the above article.
Cities and states are becoming more and more innovative about how
to tax big companies, taxes that are not seemingly so overtly unconstitutional
as a gross receipts tax. The above article discusses some of those innovations.
But at the same time those cities run the risk of driving part or all of those
businesses elsewhere and creating more unemployment and property value losses.
Cities that impose targeted taxes end up triggering loaded guns that can
backfire.
The attribution of homelessness and welfare dependency to being
laid off by a local big business is overstated.
Firstly layoffs occur in firms of all sizes and locales. It's common for people
laid off or divorced in small rural towns to migrate as homeless people to the
big city, e.g., they were laid off by a local contractor in a small town rather
than Amazon in Seattle. Secondly, a homeless person more often than is
unemployed due to being mentally ill or alcoholic or a heroine addict or all
three. Yeah a percentage of Seattle's homeless addicts may be traced back to
illegal acts of doctors, pharmacies, and Big Pharma, but Amazon did not cause
the pain medication addiction of some of Seattle's homeless people.
Analyzing the new Oregon corporate activity tax (that does not
even require physical presence in Oregon and taxes out-of-state-residents)---
https://www.thetaxadviser.com/issues/2019/sep/oregon-corporate-activity-tax.html?utm_source=mnl:cpald&utm_medium=email&utm_campaign=30Sep2019
Tax Foundation: Oregon’s Proposed Corporate Activity Tax
Would Harm Low-Income Oregonians the Most ---
https://www.thetaxadviser.com/issues/2019/sep/oregon-corporate-activity-tax.html?utm_source=mnl:cpald&utm_medium=email&utm_campaign=30Sep2019
Jensen Comment
I don't understand how Oregon can get away with this gross receipts tax.
**How to Mislead With Statistics
U.S. Crime 'Good Guys With Guns' Can Rarely Stop Mass Shootings, and Texas
and Ohio Show Why 'Good Guys With Guns' Can Rarely Stop Mass Shootings, and
Texas and Ohio Show Why ---
https://time.com/5644578/good-guys-with-guns-el-paso-dayton/?utm_source=newsletter&utm_medium=email&utm_campaign=the-brief&utm_content=20190807&xid=newsletter-brief
Jensen Comment
This is a classic biased article from a left wing rag.
In accountancy we hear over and over that financial audits are often failures
at detecting employee pilfering, and it's true that financial statement audits
are not designed to detect pilfering by employees in part because audits to
detect employee pilfering are prohibitively expensive unless there is prior
suspicion that narrows the search. Financial statement audits are designed
to test overall conformance of financial reports to reporting standards.
However, only naive analysts conclude that financial statement audits do not
prevent some employee pilfering.
The problem is that we can never conduct very useful research on the impact
of financial statement auditing on preventing
employee pilfering. How do you catch a moonbeam in
your hand? How many employees are discouraged from pilfering when they
know that internal and external auditors will be poking around their records?
The
Sandy Hook School Shooter knew that
there were no armed teachers, administrators, or police officers on duty at the
school the morning he shot up a bunch of little kids. Would he have been so
brazen if he knew there were armed officials all around the school. Would
he instead have picked a softer target like a restaurant or a park when the
school was no longer a marshmallow target?
We'll never know. How to you catch a moonbeam in
your statistical database?
There are no perfect employee pilfering prevention measures just like there
are no perfect mass shooting prevention measures. But it's a
politically-motivated conclusion that "guns rarely stop mass shootings."
Schools are softer targets than gun shows because there
are fewer guns on site.
How many mass shootings take place at gun shows?
**How to Mislead With Statistics (definitions)
GDP Growth Is Not the Same Thing as Real Economic Growth ---
https://mises.org/wire/gdp-growth-not-same-thing-real-economic-growth?utm_source=Mises+Institute+Subscriptions&utm_campaign=ecd0810c45-EMAIL_CAMPAIGN_9_21_2018_9_59_COPY_01&utm_medium=email&utm_term=0_8b52b2e1c0-ecd0810c45-228708937
**How to Mislead With Statistics
China’s economy is about 12 per cent smaller than official figures indicate, and
its real growth has been overstated by about 2 percentage points annually in
recent years, according to research ---
https://marginalrevolution.com/marginalrevolution/2019/03/china-non-fact-of-the-day.html
**How to Mislead With Statistics (missing variables)
American Economic Review: Who Pays for the
Minimum Wage? ---
https://www.aeaweb.org/articles?id=10.1257/aer.20171445&&from=f
Jensen
Comment
This is one of those studies with conclusions that are embedded in a whole lot
of unmentioned caveats. For example:
Does Hungary have anything close to the $2 trillion underground economy that
provides alternatives to the minimum wage for both employers and employees?
Are
there enormous differences between industries such as restaurant workers
versus landscape workers (in Texas there are probably more landscape workers
working in the underground economy than the
economy paying more and providing benefits)?
My own
opinion is that having an enormous underground economy changes everything about
minimum wage conclusions. Interestingly the underground economy may pay much
more than minimum wage, especially when there are skills (think auto mechanics)
or risks (think farm and yard chemicals) or enormous discomforts (think of
working on a metal roof under Arizona's sun). But even when there relatively
high wages there are seldom underground economy benefits like medical insurance
and unemployment compensation and pension contributions.
Bob
Jensen's threads on the underground economy ---
http://www.cs.trinity.edu/~rjensen/temp/TaxNoTax.htm#Poor
Postmodernism ---
https://en.wikipedia.org/wiki/Postmodernism
What theory?: Watch Short Introductions to Postmodernism, Semiotics,
Phenomenology, Marxist Literary Criticism and More ---
http://www.openculture.com/2019/05/what-the-theory.html?utm_source=feedburner&utm_medium=email&utm_campaign=Feed%3A+OpenCulture+%28Open+Culture%29
The American Dream: Kurdish Immigrant Becomes a
Billionaire ---
TED Talk: Hamdi Ulukaya: The anti-CEO playbook ---
https://www.ted.com/talks/hamdi_ulukaya_the_anti_ceo_playbook?utm_source=newsletter_weekly_2019-05-24&utm_campaign=newsletter_weekly&utm_medium=email&utm_content=talk_of_the_week_image
Jensen Comment
This video is not as anti-business as it sounds, and the fact that Ulukaya
became a billionaire as a CEO entrepreneur proves it. But he did in a socially
responsible way with hiring of refugees and local workers and the sharing of
corporate equity with employees.
Some things are overlooked in this otherwise inspiring video. Firstly, employees
that have their savings invested in their employer's company need, at some point
like retirement, to liquidate their holdings. In other words,
they need some kind of market for their shares that have
increased in value on paper but not necessarily in liquidity. One way
of achieving liquidity is the cursed IPO when private corporate shares are going
public to get into a cash market for those shares. Then
investors start asking questions like what are the profits and what is the
financial security of this investment?
The bottom line is that this is a pro-capitalism video, and seemingly
anti-socialist if you watch it closely. But it's socially responsible capitalism
to a point of where employees and Ulukay himself (a billionaire on paper) want
to cash in on their shares.
The other thing to note about Ulaukaya's yogurt business is that this is a
labor-intensive business relative to more capital-intensive businesses (think
electric cars and pharmaceuticals) that need to justify "profits" or
"anticipated profits" to get investors to put money into the business.
Hence it's a great video for a business case where there's a lot to debate like
keeping wages relatively low by paying in ownership shares.
**How to mislead with statistics
Media Misrepresents Poverty Rate of US Children by More Than Double ---
http://www.breitbart.com/big-government/2015/01/20/media-misrepresents-poverty-rate-of-us-children-by-more-than-double/
In a breathless, Drudge Report-linked headline, the Washington Post
reported last week that the “Majority
of U.S. public school students are in poverty.”
A Huffington Post piece by Rebecca Klein, published 12 minutes
earlier, sported a similar headline, “More
Than Half Of American Schoolchildren Now Live In Poverty.”
. . .
In 2013, some 19.9 percent of children in America
were in families with income at the poverty line or below—in 2014, the
income threshold was $23,850 for a family of four. (Among the native-born of
all ages, the poverty rate was 13.9 percent while among non-citizens, the
rate was 22.8 percent while naturalized residents had a poverty rate of 12.7
percent.)
So, how does 19.9 percent become 51 percent?
Continued in article
Measuring Poverty Around the World ---
https://www.amazon.com/Measuring-Poverty-around-Anthony-Atkinson/dp/0691191220/ref=sr_1_1?crid=3U3VG9LDKEH9M&keywords=measuring+poverty+around+the+world&qid=1559895304&s=gateway&sprefix=measuring+poverty+arou%2Caps%2C118&sr=8-1/marginalrevol-20
**How to Mislead With Statistics
Newspaper Subscriptions ---
https://marginalrevolution.com/marginalrevolution/2019/08/average-is-over-newspaper-edition.html
Also see
https://www.niemanlab.org/2019/07/the-l-a-times-disappointing-digital-numbers-show-the-games-not-just-about-drawing-in-subscribers-its-about-keeping-them/
Jensen Comment
The big problem these days is the confounding of print subscriptions with
digital subscriptions. For example, the NYT purportedly now has 2.7 million
digital-only subscribers (down from 2.9 million in 2017) ---
https://en.wikipedia.org/wiki/The_New_York_Times
I wondered why the above article by Joshua Benton totally ignored the Wall
Street Journal having a 2018 circulation of 2.5 million total with only 1.6
digital subscriptions. The problem is that most WSJ "digital subscriptions"
(like mine) include print edition mailings such that comparing the NYT
digital-only subscriptions with WSJ digital subscriptions compares an
apples-only basket with a fruit basket. Benton does not mention this
comparability problem and leads us to believe that he ignored the WSJ because
its a "niche" market newspaper. That's not a particularly good reason since the
NYT and WSJ both have extensive general news coverage as well as financial
markets coverage.
But Benton is probably safer not comparing NYT circulation with WSJ
circulation because comparisons of digital subscriptions are dubious since the
WSJ does far more bundling of print with digital subscribing.
In any case, the three largest newspapers in the USA benefit heavily from
billionaire ownership of their shares --- Carlos Slim in the case of the NYT,
Jeff Bezos in the case of the Washington Post, and Rupert Murdoch in the
case of the WSJ. These newspapers would not be nearly as successful without
being propped up by these billionaires. Since that billionaire support is so
crucial for worldwide reporting we should be grateful to all three billionaires.
**How to Mislead With Statistics
Gini Coefficient of Poverty
Jensen Comment
The Gini Coefficient is one of the most misleading statistics in economics. It
supposedly measures the gap between the rich and poor in any nation. However,
the terms "rich" and "poor" are highly relative. For example, the USA has a high
Gini Coefficient indicating a gap between the rich and poor. However, South
Sudan has very nearly the same Gini Coefficent where the poor of the USA would
be considered well off in South Sudan. Think of how rich a person would be in
the South Sudan with housing subsidies, food stamps, Medicaid, vehicles, HDTV,
and welfare.
Chile is a high Gini Coefficient nation with about the same score as Zambia,
but the poor in Chile are not nearly as desperate as the poor in Zambia. The
level of income for the poor in Chile is the highest in all of Latin and South
America ---
http://en.wikipedia.org/wiki/Miracle_of_Chile
At one point Canada and North Korea had about the same Gini Coefficient,
although the index is no longer computed for North Korea ---
http://en.wikipedia.org/wiki/List_of_countries_by_income_equality#List
"Countries With the Widest Gap Between Rich and Poor," by Alexander
E.M. Hess, Vince Calio and Thomas C. Frohlich, Business Insider, May 20,
2014 ---
http://247wallst.com/special-report/2014/05/20/countries-with-the-widest-gap-between-rich-and-poor/?utm_source=247WallStDailyNewsletter&utm_medium=email&utm_content=MAY212014A&utm_campaign=DailyNewsletter
Jensen Comment
Denmark has the lowest (best) Gini Coefficient but its public education and
health care systems are lacking and rank below those of Morocco ---
http://www.cs.trinity.edu/~rjensen/temp/SunsetHillHouse/SunsetHillHouse.htm
Other measures of inequality and poverty ---
http://web.worldbank.org/WBSITE/EXTERNAL/TOPICS/EXTPOVERTY/EXTPA/0,,contentMDK:20238991~menuPK:492138~pagePK:148956~piPK:216618~theSitePK:430367,00.html
Measuring Poverty Around the World ---
https://www.amazon.com/Measuring-Poverty-around-Anthony-Atkinson/dp/0691191220/ref=sr_1_1?crid=3U3VG9LDKEH9M&keywords=measuring+poverty+around+the+world&qid=1559895304&s=gateway&sprefix=measuring+poverty+arou%2Caps%2C118&sr=8-1/marginalrevol-20
Average Student Loan Debt For Law School Graduates: $145,500
---
https://taxprof.typepad.com/taxprof_blog/2019/07/average-student-loan-debt-for-law-school-graduates-145500.html
Jensen
Comment
There are two types of populations. One is the total population of law school
graduates. The other is the subset of those graduates who have some student loan
debt. According to the article rougly 25% of the graduates have no student debt.
It would be misleading to include these in the calculation of average student
debt. Doing so would greatly draw down the mean average relative to the mean for
only the subset of students who have debt.
A
second problem is that of defining "student debt." First there is the subset of
students who have "student loans" ---
https://en.wikipedia.org/wiki/Student_debt
Add to
this the graduates who have other forms of debt such as loans from relatives.
These types of loans often are not quite the same as "student debt" in terms of
things like payback timing, interest rates, and legal proceedings in the case of
default. It's very hard to get a database on this type of customized "debt." I
suspect that if this debt could be factored into the database, the mean would be
considerably higher than $145,500.
How to Mislead With Statistics
States Producing the Most Renewable Energy (as a percentage of total energy
production)
https://247wallst.com/special-report/2019/07/24/states-producing-the-most-renewable-energy-2/
Jensen Comment
The Number 1 winner is Vermont --- supposedly producing virtually 100% of its
electricity needs (2.1 million KWh) with
(mostly old) hydro electric power.
At Rank 26 we have Wyoming producing 11.6% of its
electricity needs (46.7 million KWh) with
wind power.
Vermont has 626,000 people whereas Wyoming only has
577,000 people.
The first question is why Wyoming has fewer people but
still needs 20 times more electric power. Partly this is explained by having the
population of Vermont more concentrated, thereby having less transmission line
loss of electricity. But 20 times less when wind power can be generated more
where needed with wind than hydro power that depends more upon geology?
Secondly, Wyoming disserves more credit than Vermont by
meeting power needs with new investments (windmills) whereas Vermont does
relatively little new investing in new renewable power sources since it has very
old hydro dams still meeting power needs.
Actually Vermont sells much of its hydro power to the grid
and relies a great deal more on burning of biomass (wood chips) for cities like
Burlington. Vermont actually discourages investing in wind power as being bad
for aesthetics and tourism.
The second question is why are renewable energy sources
are lumped into one category when they are environmentally different? |
Should you really compare Wyoming (generating 11.6% of its energy needs from
wind power that does not produce carbon) with South Carolina, Rhode Island, and
Virginia (generating most of their renewable energy from biomass wood chip
burning that's second only to coal in terms of producing carbon into the
atmosphere).
What's very misleading, aside from lumping solar, wind,
and biomass into one category, is to ignore state population in the write up of
this energy data. Sure Vermont supposedly generates almost 100% of its
electricity needs with hydro, but when I visit Vermont I see as many fuel oil
and propane trucks in each village as I see in New Hampshire villages. Vermont
is burning petroleum just like New Hampshire, but Vermont is making more selling
power from old hydro dams to states like New York and Massachusetts. Vermonters
are not nearly as environmentally focused as they like to pretend, especially
since much of their newer "renewable" electric power is from burning wood chip
smoke into the atmosphere that's far less environmentally friendly than propane.
In truth we probably should not even be comparing Vermont
and Wyoming with high-populated states like California and New York. There's a
denominator effect where percentages are distorted by very small or very large
denominators relative to numerators of interest.
**How to Mislead With Statistics
Gartner says 90% of blockchain-based supply chain projects are in trouble
---
https://modernconsensus.com/uncategorized/gartner-survey-blockchain-supply-chain-trouble/?utm_campaign=the_download.unpaid.engagement&utm_source=hs_email&utm_medium=email&utm_content=72468246&_hsenc=p2ANqtz-_TdgxzYGXpHXTd_resmlKeteK16nV8BTxj1BkkropYXNpAw2nVGt0W_Zne02cBoZYmiYilYeZRPQRiqu7ZpvkXCG2EfA&_hsmi=72468248
Jensen Comment
This is misleading in that "supply chain" is not adequately defined. The
majority of blockchain applications to date center on bit coin or other
cryptocurrencies, areas where fraud and hacking are enormous.
Even in other supply chain applications there are usually problems that arise
whether or not blockchain is involved. These problems interact with blockchain
applications such that it's difficult to totally blame blockchain applications
for the troubles. For example, if Tesla (hypothetically) implemented a
blockchain application in Tesla's supply chain this would not correct the
chronic problem Tesla has with logistics such as taking weeks or months to
supply parts to Tesla collision repair shops. This in turn is what makes it so
expensive to insure a Tesla for collision. Think of having to provide rental
cars for weeks or months while Tesla repair shops wait for back ordered parts
(like damaged doors).
Cryptocurrency ---
https://en.wikipedia.org/wiki/Cryptocurrency
Fidelity Will Offer Cryptocurrency Trading Within a Few
Weeks ---
https://www.bloomberg.com/news/articles/2019-05-06/fidelity-said-to-offer-cryptocurrency-trading-within-a-few-weeks?cmpid=BBD050619_BIZ&utm_medium=email&utm_source=newsletter&utm_term=190506&utm_campaign=bloombergdaily
Trading manipulation is rampant on certain cryptocurrency exchanges,
according to researchers at several universities ---
https://www.bloomberg.com/news/articles/2019-04-15/-flash-boys-trading-bots-are-running-wild-on-crypto-exchanges?cmpid=BBD041519_BIZ&utm_medium=email&utm_source=newsletter&utm_term=190415&utm_campaign=bloombergdaily
Bitcoin rockets above $5,000 ---
https://markets.businessinsider.com/currencies/news/bitcoin-price-rockets-above-5000-2019-4-1028077970
Nearly 95% of all bitcoin trading is faked by unregulated
exchanges ---
Click Here
Bitcoin: The New Swiss Banks ---
https://taxprof.typepad.com/taxprof_blog/2019/03/bitcoin-the-new-swiss-banks.html
10 Years After Bitcoin Began, are We Underestimating
Crypto? ---
https://readwrite.com/2019/03/29/10-years-after-bitcoin-began-are-we-underestimating-crypto/
Blockchain ---
https://en.wikipedia.org/wiki/Blockchain
Future of fraud in a blockchain world ---
https://www.fraud-magazine.com/article.aspx?id=4295002445
Blockchain and Cryptocurrency/Initial Coin Offering (ICO)
Fraud and SEC Whistleblower Program ---
https://www.zuckermanlaw.com/blockchain-fraud-sec-whistleblower-attorneys/
Bots exploiting blockchains for profit ---
https://techxplore.com/news/2019-04-bots-exploiting-blockchains-profit.html
Is Blockchain the Answer to Fraud Prevention? ---
https://www.comparethecloud.net/articles/blockchain-fraud-prevention/
Will Blockchain Make Auditors Obsolete?
by Eric E. Cohen
ThinkTWENTY20, Issue 1, 2019
---
https://thinktwenty20.store/collections/all
**How to Mislead With Statistics
How Much Income is Taxed Around the World ---
http://www.businessinsider.com/oecd-income-tax-wedge-chart-2015-4
Jensen Comment
There is some argument for comparing a given nation's income tax rate over time.
Most nations have much lower top rates since the 1970s. Many lowered the average
rates since the beginning of the 21st Century ---
http://www.cs.trinity.edu/~rjensen/temp/TaxNoTax.htm
Comparing income tax rates between any two different countries is almost
impossible. Firstly, the definition of "income" may vary greatly, especially
income that is not taxed such as muni bond interest is not taxed at the federal
level in the USA. Secondly, nations vary greatly with respect to deductions in
arriving at taxable income. Thirdly nations vary greatly in terms of preferences
for income tax deferrals. In the USA the top 20% of the income earners pay about
80% of the income taxes. This is not the case in most other nations where the
middle and lower earners bear some of the income tax burden..
Comparing taxes for different nations must consider all types of taxes. For
example, the USA has no VAT tax that tends to increase prices of goods and
services in other nations, particularly in Europe.
Comparing taxes for different nations should consider the goods and services
that these taxes pay for. For example, the USA has only a partial national
health care system (Medicare and Medicaid plus ACA subsidies) whereas many other
nations have much broader national health care coverage of varying scope and
quality. Some nations provide totally free higher education and control the
costs by only allowing a relatively small percentage of the students go to
college. Other nations like the USA have nearly universal higher education and
training opportunity that is only partly subsidized with taxes.
Many nations are able to tax less because they live under the umbrella of a
neighboring country that pays for most of the national defense. The USA spends a
lot defending other nations like South Korea and most nations to the north and
south of the USA.
**How to mislead with statistics (definitions)
The 13 best jobs for people who don't want to work a lot ---
http://www.businessinsider.com/best-jobs-for-people-who-dont-like-to-work-a-lot-2015-11
Jensen Comment
I think this is perhaps one of the most misleading articles I ever read. The
fundamental problem is that the article confuses pay-for-performance versus
pay-for-effort versus pay-for-no-effort types of work. For example, there many
types of jobs that only pay for performance living on realtor sales commissions.
Another example is a cab driver who gets a percentage of the fares collected.
Another cab driver who gets paid for the miles driven is being paid for effort
rather than performance since that driver makes the same whether the moving cab
does or does not have a passenger. At the other extremes there are jobs where
people get paid for presence irrespective of performance or effort. Volunteer
firefighters may get paid whether or not they are called away from their homes
and day-jobs usually are paid only a small proportion of time spent actually
fighting fires.
There are also careers where it's almost impossible to separate work time
from leisure time. For example, fiction writers in some ways are on the job
during every waking moment since they are continually looking for ideas to act
upon in their writing. Researchers are almost always thinking about their work
even when they are doing other things like changing diapers of their babies.
The bottom line is that I see little of value in this article. About all it
says is that there are some jobs where employees have the option or determining
the number of hours worked. Or they are at the beckoning call of employers who
decide when they will get paid for working. Some employees have the option of
ether taking the job or turning it down such as the way some flight attendants
work for the airlines when there are more people wanting a given routing than
are needed for that routing. The routings are then usually allocated on the
basis of seniority.
In any case the phrase "don't want to work" is ambiguous. Some people "don't
want to work" because they are lazy and are willing to make less money by
avoiding work. Some people don't want to work 40 or more hours a week because
they have other things they have to do like being a parent or slaving away at a
hobby.
Myers-Briggs Personality Test ---
https://en.wikipedia.org/wiki/Myers%E2%80%93Briggs_Type_Indicator
**How to Mislead With Statistics
"Why the Myers-Briggs test is totally meaningless," by Joseph Stromberg
and Estelle Caswell, Vox, October 8, 2015 ---
http://www.vox.com/2014/7/15/5881947/myers-briggs-personality-test-meaningless
The Myers-Briggs Type Indicator is probably the
most widely used personality test in the world.
About 2 million people take it annually, at the
behest of corporate HR departments, colleges, and even government agencies.
The company that produces and markets the test makes around $20 million off
it each year.
The only problem? The test is completely
meaningless.
"There's just no evidence behind it," says Adam
Grant, an organizational psychologist at the University of Pennsylvania
who's written about the shortcomings of the Myers-Briggs previously. "The
characteristics measured by the test have almost no predictive power on how
happy you'll be in a situation, how you'll perform at your job, or how happy
you'll be in your marriage."
The test claims that, based on 93 questions, it can
group all the people of the world into 16 different discrete "types" — and
in doing so, serve as "a powerful framework for building better
relationships, driving positive change, harnessing innovation, and achieving
excellence." Most of the faithful think of it primarily as a tool for
telling you your proper career choice.
But the test was developed in the 1940s based off
the totally untested theories of Carl Jung and is now thoroughly disregarded
by the psychology community. Even Jung warned that his personality "types"
were just rough tendencies he'd observed, rather than strict
classifications. Several analyses have shown the test is totally ineffective
at predicting people's success in various jobs, and that about half of the
people who take it twice get different results each time.
Yet you've probably heard people telling you that
they're an ENFJ (extraverted intuitive feeling judging), an INTP
(introverted intuitive thinking perceiving), or another one of the 16 types
drawn from his work, and you may have even been given this test in a
professional setting. Here's an explanation of why these labels are so
meaningless — and why no organization in the 21st century should rely on the
test for anything.
Continued in article
How to Mislead With Statistics
Most Popular Six-Figure Jobs in the USA ---
http://247wallst.com/special-report/2013/08/29/americas-most-popular-six-figure-jobs/?utm_source=247WallStDailyNewsletter&utm_medium=email&utm_content=AUG292013A&utm_campaign=DailyNewsletter
Jensen Comment
One of the most misleading things analysts can do is to compare compensation of
high-end careers. For example, the above "most popular jobs" leaves out owners
of farms in the Midwest who own and farm (i.e., work the land) really big farms,
say 2,500-acre grain farms or larger. How does one compare "profits" on
multimillion farm investments with salaries of "Marketing Managers" who invest
nothing but their labor?
How does one compare the "profits" of a one-neurosurgeon corporation with the
salaries of "Marketing Managers" who may have not even invested in a college
education? The neurosurgeon may have invested hundreds of thousands of dollars
plus years of her life as a student. Her ultimate annual compensation is really
a return on lost opportunity value and a large investment.
How does one compare the profits by partners in a small law firm with the
salaries of lawyers employed in house by an enormous tobacco company?
One of the most misleading types of rankings is where the rankings are based
on averages (means or medians) when there are enormous variances and/or high
kurtosis. And there may be enormous changes over time. A shyster law firm may
really struggle with partners barely earning minimum wage until they win the
legal lottery --- that patient in a coma for 43 years after slipping on a
burrito in a Taco Bell restaurant.
The bottom line is that it is not so misleading to compare hourly wages of
McDonalds workers versus Pizza Hut workers. But don't try to compare the profit
sharing plans of large law firms and medical practices with the salaries of
"Marketing Managers."
**How to Mislead With Statistics
"Secular researchers are likely to discover what they
already suspect which is a co-relation between their values and high levels of
intelligence," noted atheist sociologist Frank Furerdi. He questioned the value
of such a project, where "social science research turns into advocacy research."
"Why Intelligent People Are Less Likely to Be Religious And how our
expectations for Christians in education are changing," by Jordan Monge,
Christianity Today, August 26, 2013 ---
http://www.christianitytoday.com/ct/2013/august-web-only/brains-and-belief-arent-mutually-exclusive.html?paging=off
Thank you Scott Bonacker for the heads up.
**How to Mislead With Statistics
"The truth about the real size of the US national debt," Pravda,
August 22, 2013 ---
http://english.pravda.ru/business/finance/22-08-2013/125468-usa_national_debt-0/
Everyone got used to the largest officially
announced U.S. national debt of 16 trillion dollars. Moreover, despite the
dire predictions, the global economy seems to be more or less stable, and
recently liberal media have been happily reporting GDP growth in the United
States and the European Union. However, it is not all that great.
Let's start with statistics. A number of
researchers have conducted studies that indicate that the official U.S.
statistics in nearly all areas - from unemployment to price fluctuations -
is blatantly distorted and paints a positive picture that is very different
from the reality.
The work of Professor James Hamilton of the
University of Economics, California who analyzed the size of the public debt
of the United States particularly stands out. According to official data
since 2008, when the global economic crisis commenced, the U.S. national
debt has increased from 5 to 16.4 trillion dollars. The debt is repaid by
ordinary taxpayers who pay approximately $220 billion annually in interest
alone.
This huge sum emerged due to the fact that in an
effort to get out of the crisis, the Federal Reserve in coordination with
the U.S. authorities pumped money into the economy and bought a lot of
assets. Accordingly, the amount of state debt increased every year, and the
interest on the debt service alone by 2021 will exceed the costs of defense
spending.
Given these figures, Professor Hamilton has
calculated the value of the U.S. government debt that consists of the debts
of individual states, corporations, individuals, government welfare payments
and other obligations of the federal U.S. government to its creditors. The
resulting figure is a staggering 70 trillion dollars. The U.S. lawmakers
allowed debt ceiling of 16.4 trillion dollars that has been reached late
last year, then U.S. Treasury Secretary Timothy Geithner informed Congress
about the beginning of the suspension of debt repayments and emergency
measures to avoid a default. If this research is only half true, it means
that the U.S. is in a state of a default.
The fact that this assumption is not far from the
truth is evidenced by the situation in American cities. Hundreds of cities
are not able to pay their bills and fulfill social obligations. According to
the World Bank, this may lead to their bankruptcy, putting the country on
the brink of a sovereign default in the next three years.
As of August 1, 2013, 12 U.S. cities have declared
themselves bankrupt and insolvent. Nearly 350 small and medium-sized cities
in the country and 113 municipal districts of large cities, particularly New
York, are close to doing that. In mid-July, the City Hall of the former
automotive capital of the United States Detroit has filed for bankruptcy.
The city's debt amounts to 18 billion, of which 9.2 billion are pensions and
medical.
The overall deficit of the pension fund in the U.S.
is $2.7 trillion, or 17 percent of GDP. The lack of money in the pension
fund, for example, in Illinois is 2.5 times the amount of annual tax
revenues, Connecticut - 1.9, Kentucky - 1.4 times.
The largest bankrupt city is currently Stockton,
California, with 300,000 thousand residents. The situation in this city can
show what will happen to other cities dealing with financial difficulties.
The police department was cut by half, and the streets got filled with
homeless, drug dealers and gangs of drunk teenagers. This year, 56 murders
were recorded in the city, while in New York with the 15 million residents
414 such crimes were registered.
Meanwhile, Stockton, like another bankrupt city of
San Bernardino, is located in the richest state of California. What can be
said about other states when Los Angeles has a budget deficit of $238
million and prospects of a default in the next year?
Continued in article
Jensen Comment
Note that the dispute between $16 trillion versus $70 trillion concerns only the
booked USA National Debt. the Unbooked entitlements under contract bring the
total obligations of the USA Federal Government to over $100 trillion.
Not to worry! Zimbabwe, err I mean the Federal Reserve, will print greenbacks
to meet all USA obligations. This is not Greece. We can print U.S. dollars
instead of taxing or borrowing. Life is good!
Bob Jensen's threads on entitlements ---
http://www.trinity.edu/rjensen/Entitlements.htm
**How to Mislead With Statistics
"Myths About Wheatgrass," by Monica Reinagel, Nutrition Deva, June 26,
2013 ---
http://nutritiondiva.quickanddirtytips.com/wheat-grass-myths.aspx
Consumer Price Index (CPI) ---
http://en.wikipedia.org/wiki/CPI
GDP Deflator ---
http://en.wikipedia.org/wiki/GDP_deflator
**How to Mislead With Statistics
In an effort to deceive the government took food
and fuel price changes out of the Consumer Price Index (CPI) because increases
in those components made inflation so worrisome and expensive when adjusting for
things like Social Security benefits.
But when it comes to calculating the price-level
adjusted GDP for the USA it gets even worse.
"The GDP Distractor," by Peter Schiff,
Townhall, August 21, 2013 ---
Click Here
http://finance.townhall.com/columnists/peterschiff/2013/08/21/the-gdp-distractor-n1669417?utm_source=thdaily&utm_medium=email&utm_campaign=nl
. . .
Most people tend to follow the Consumer Price Index
(CPI) which is compiled by Bureau of Labor Statistics, a division of the
Department of Labor. The CPI is regarded as the broadest measurement tool,
but it has been changed many times over the years. Most famously, its
formulas were loosened in the late 1990's as a result of the "Boskin
Commission" which said that the CPI overstated inflation by failing to
account for changes in consumer behavior. I believe those changes seriously
undermined the reliability of the index. But the CPI itself has to contend
for relevance with its stripped down rival, the "Core CPI,"
which factors out food and energy,
which many believe are too volatile to be accurately counted. The core CPI
is almost always lower than the "headline" number.
Another set of inflation data, the "GDP Deflator"
is compiled by the Bureau of Economic Analysis (part of the Commerce
Department), and is used by them to calculate GDP. The deflator differs from
the CPI in that it has much more flexibility in weighting and swapping out
items that are in its sample basket of goods and services. While the CPI
attracts the lion's share of the media and political attention, it is the
deflator that is relevant when looking at economic growth.
On a quarterly basis the two numbers are usually
close enough to escape scrutiny. (However, the most recent 2nd quarter GDP
estimates relied on annualized inflation of a ridiculously low .7%!). But if
you look at a broader time horizon a very clear pattern emerges that makes a
great difference in how we perceive the economic landscape.
Available data sets for both the CPI and the GDP
deflator go back to 1947. That 66 year period falls neatly into two phases.
From 1947 to 1977 both yardsticks moved together almost identically, both
rising 173% over that time. But in the ensuing 36 years (until 2013), the
CPI is up almost three fold (292%) while the deflator is only up about two
fold (209%). The CPI rising 40% more than the GDP deflator is an extremely
significant factor. How did that happen? As it turns out, quarterly
inflation assumptions have been, on average, .17% lower for the deflator
than for the CPI since 1977. That is a small number. But as with compound
interest small numbers add up to big numbers over time.
If you replace the GDP quarterly growth rates using
the higher CPI rather the deflator, our current economy would be closer to
$13 trillion than 16.6 trillion, about 28% smaller. Even if you were to
split the difference between the CPI and the deflator you would still get an
economy that is significantly smaller than it appears.
The $64,000 question ($188,000 adjusted by CPI
inflation since 1977) is what happened in 1977 to make the CPI and the
deflator diverge? Sadly, the details aren't really made public. What we do
know is that the BEA took over the task in 1972, and that the separation
occurred a few years later when inflation really started to run out of
control. We also know that the deflator is more flexible than the CPI and
that the interests of the government are better served by reporting low
inflation and higher growth. So in other words, the deflator is likely lower
for the same reasons that dogs lick themselves in intimate places: because
they want to and they can.
If we had been growing as quickly as the official
GDP indicates, why would our labor force have contracted so significantly?
Why are we continuously replacing middle class jobs with lower paying ones?
Why would we be using 3 percent less energy nationally than we did 10 years
ago despite an 8.8% growth in population? Why would Americans be spending a
higher percentage of their disposable incomes on basic necessities than they
were 10 years ago? These trends don't conform to healthy GDP growth. So
maybe the growth is largely an illusion?
When you take into consideration the likelihood
that even the CPI drastically understates inflation, you get a much clearer
picture of the true state of the U.S. economy. If you ever wondered how we
went from being the world's largest creditor to its biggest debtor despite
all this economic growth, now you know. As the growth was merely a
statistical illusion, we have been forced to borrow money to maintain a life
style our economy can no longer support.
So the next time you see a GDP report remind
yourself that the "deflator" should really be called the "distractor." It's
there to distract you from the truth.
**How to mislead with statistics
"Stop Saying Robots Are Destroying Jobs—They Aren’t," by Robert D.
Atkinson, MIT's Technology Review, September 3, 2013 ---
Click Here
http://www.technologyreview.com/view/519016/stop-saying-robots-are-destroying-jobs-they-arent/?utm_campaign=newsletters&utm_source=newsletter-daily-all&utm_medium=email&utm_content=20130904
Jensen Comment
What nonsense. This illustrates on macro big data can mislead relative to micro
data. Any analyst who flat out claims robots are not destroying any jobs has not
been inside many factories in the 21st Century. When a Chevrolet dealer submits
an order for a new part a computer processes the order and submits a picking
order to a robots who retrieve the part, package it, and ships it to that dealer
along with a payment invoice. Not a single human is involved in getting this new
part to dealers.
"Rise of the Robots," by Paul Krugman, The New York Times,
December 8, 2012 ---
http://krugman.blogs.nytimes.com/2012/12/08/rise-of-the-robots/
"Raytheon's Missiles Are Now Made by Robots," by Ashlee Vance,
Bloomberg Business Week, December 11, 2012 ---
http://www.businessweek.com/articles/2012-12-11/raytheons-missiles-now-made-by-robots
"Harley Goes Lean to Build Hogs," by James R. Hagerty, The Wall
Street Journal, September 22, 2012 ---
http://professional.wsj.com/article/SB10000872396390443720204578004164199848452.html?mod=djem_jiewr_AC_domainid&mg=reno64-wsj
"Rethink Robotics invented a $22,000 humanoid (i.e. trainable) robot that
competes with low-wage workers," by Antonio Regalado, MIT's Technology
Review, January 16, 2013 ---
Click Here
http://www.technologyreview.com/news/509296/small-factories-give-baxter-the-robot-a-cautious-once-over/?utm_campaign=newsletters&utm_source=newsletter-daily-all&utm_medium=email&utm_content=20130116
A World Without Work," by Dana Rousmaniere, Harvard Business Review
Blog, January 27, 2013 ---
Click Here
http://blogs.hbr.org/morning-advantage/2013/01/morning-advantage-a-world-with.html?referral=00563&cm_mmc=email-_-newsletter-_-daily_alert-_-alert_date&utm_source=newsletter_daily_alert&utm_medium=email&utm_campaign=alert_date
Every symphony in the world incurs an operating
deficit
"Financial Leadership Required to Fight Symphony Orchestra ‘Cost Disease’,"
by Stanford University's Robert J Flanagan, Stanford Graduate School of
Business, February 8, 2012 ---
http://www.gsb.stanford.edu/news/headlines/symphony-financial-leadership.html
What if you sat down in the concert hall one
evening to hear Haydn’s Symphony No. 44 in E Minor and found 5 robots
scattered among the human musicians? To get multiple audiences in and out of
the concert hall faster, the human musicians and robots are playing the
composition in double time.
Today’s orchestras have yet to go down this road.
However, their traditional ways of doing business, as economist Robert J.
Flanagan explains in his new book on symphony orchestra finances, locks them
into limited opportunities for productivity growth and ensures that costs
keep rising.
I think somebody needs to take Robert Atkinson on a tour of factories where
robots have replaced workers.
**How to Mislead With Statistics
How Wealth Possibly Impacts Negative Behavior (e.g., aggression, cheating,
crime, etc)
September 22, 2013 reply from Jagdish Gangolly
I am sure this will be a controversial post, but
could not resist posting it.
Take Two 'Normal' People, Add Money To Just One Of
Them, And Watch What Happens Next
FRIDAY, JULY 19, 2013
Science can explain a lot of things that I've always wondered about (go,
science!). In this case, it explains what I've known for a long time but
been unable to quite understand: Why do some folks who have a lot more
money than others seem to be less nice and more evil to everyone around
them? At
0:50, someone actually takes candy from
babies. No, really. At
3:00, we start to see the science unfold
before our eyes. Entire management courses could — and should — be
taught with the bit starting at
4:40. by Brandon Weber, Upworthy Read
More:
http://www.whydontyoutrythis.com/2013/07/take-two-normal-people-add-money-to-just-one-of-them-and-watch-what-happens-next.html
Regards,
Jagdish
Jagdish S. Gangolly Department of Informatics
College of Computing & Information State University of New York at Albany
1400 Washington Ave Albany, NY 12222 Phone: 518-956-8251, Fax: 518-956-8247
September 22, 2013 reply from Bob Jensen
Hi Jagdish,
This research suggests mankind may have evolved on a different track than
monkeys. Experiments with monkeys repeatedly show that when pairs of monkeys
observe each other getting differential rewards, the monkey in each pair
getting the least reward unfairly becomes aggressive and even dangerous.
Keltner's research findings are counter to automobile insurance pricing.
The overwhelming majority of teenage drivers are not yet rich and do not
come from rich families. Yet they are the ones paying significantly higher
insurance rates until age 26. This suggests that Keltner may be overstating
his univariate results in a complicated world having other causes like
hormone imbalances and diet (including alcohol use) that trump wealth causes
of aggression. In San Antonio the police are called out for domestic
disturbances much more on week ends when people consume much more alcohol.
I suspect that in egalitarian nations like Finland and Sweden, domestic
crime is more closely related to alcohol abuse than wealth distribution, and
the worst aggressors are probably at the lower ends of the wealth scale.
I've not studied the works of Keltner. But his conclusions about behavior
run counter to behavior of drug addicts. It's when they are out of money
needed for a fix that they feel the desperate urge to hold up convenience
stores, rob banks, and mug people on the street. This is just another
example where perhaps Dacher Keltner has assumed away the real world in
running his experiments like playing monopoly games with students.
I've not studied the works of Dacher Keltner, but I would think
scientists would more carefully examine how he controls for such things as
missing variables, differences between game playing and real life, problems
of using students as surrogates, etc.
For example, there's a suspected world of difference between aggression
in urban versus smaller town and rural settings. My psychologist friend Phil
Zimbardo (Stanford) ran an experiment years ago where he left older cars
with windows open in Palo Alto, San Francisco, and Brooklyn while secretly
observing the cars parked on the streets. In Palo Alto people that passed by
rolled up the windows (this was back in the days that windows had cranks).
In San Francisco the car radios were stolen. In Brooklyn young men beat the
crap out the cars the parked cars.
Perhaps Keltner's really on to something here, but he may be prone to
making extrapolations to the real world that are tenuous and oversimplified
in terms of the complicated multivariate real world of infinite varieties of
circumstances that affect behavior. I don't think Phil Zimbardo ever
published his parked car experiments because of these complications in real
life.
Multivariate and nonlinear systemic complications in behavior experiments
in general create enormous research problems unless they are conducted with
massive sample sizes across multiple cultures. The same thing applies to
double blind medicine studies which is why drug manufacturing companies are
often required to conduct drug tests on tens or hundreds of thousands of
subjects in multiple parts of the world.
My point is that it's very hard to extrapolate behavior causes (like the
wealth effect) from the myriad of other factors that affect behavior in
multivariate and non-independent ways, including dynamic ways that are vary
with time and circumstances. For example, I'm a believer of relative ethics
where unethical behavior varies with opportunity that arises and behavior of
others such as fellow students or coworkers at a given point in time.
Exhibit A is recent expulsion of over 60 Harvard undergraduates for
cheating. Ironically, the instructor in that political science course gives
virtually all A grades each semester such that the students that were
expelled were not really cheating for a top grade. It appears they instead
followed the herd and avoided some work required on an assignment.
Small sample behavioral experiments rarely allow for all of the
complications of real life behavior, especially aggression, crime, and
ethical misbehavior. This is probably why the social sciences are the "soft"
sciences that do not control experiments to the degree attempted in natural
science "hard" experiments. As I quote repeatedly: "The physicists stole all
the easy problems."
There's also a huge problem of extrapolating behavioral experiments in
artificial settings (such as a Monopoly game) and real world settings where
risks and rewards are much more complicated. For example, observing student
risk behavior in a campus Bacharach-playing experiment differs greatly from
a casino risk behavior among players with stacks of $10,000 chips in real
world Bacharach-playing.
Anecdotally, Kellner's findings do agree with the occasional findings
where multimillionaire CEOs and organized crime bosses commit new frauds and
other crimes to obtain money that is no longer significant to them for the
sake of just getting more money. This suggests that they become thrill
seekers obsessed with living on the edge.
Respectfully, Bob Jensen
**How to Mislead in the Media
"It's a Cooked Book: Global warmism and the antiscientific method," The
Wall Street Journal, September 24, 2013 ---
http://online.wsj.com/article/SB10001424052702304713704579095340714975708.html?mod=djemEditorialPage_h
In the first five paragraphs of a recent dispatch
from Stockholm, the Associated Press--in our estimation unwittingly, for the
most part--exposes the deep corruption of the "global warming" enterprise:
Scientists working on a landmark U.N. report on
climate change are struggling to explain why global warming appears to
have slowed down in the past 15 years even though greenhouse gas
emissions keep rising.
Leaked documents obtained by The Associated Press
show there are deep concerns among governments over how to address the
issue ahead of next week's meeting of the Intergovernmental Panel on
Climate Change.
Climate skeptics have used the lull in surface
warming since 1998 to cast doubt on the scientific consensus that humans
are cooking the planet by burning fossil fuels and cutting down
CO2-absorbing forests.
The IPCC report is expected to affirm the human
link with greater certainty than ever, but the panel is under pressure
to also address the recent lower rate of warming, which scientists say
is likely due to heat going deep into the ocean and natural climate
fluctuations.
"I think to not address it would be a problem
because then you basically have the denialists saying, 'Look the IPCC is
silent on this issue,' " said Alden Meyer, of the Washington-based Union
of Concerned Scientists.
The first paragraph describes a scientific
problem: a theory that has been put to an empirical test and found wanting.
In the fourth paragraph, we get a passing discussion of alternative
hypotheses. But this is presented as fundamentally a problem of political
communication or public relations.
And these guys look shifty not just for scientists
but for PR men. Specialists in crisis management emphasize the importance of
building (or rebuilding) public trust by being both honest and forthcoming.
But look at that Meyer quote. He's not calling for forthrightness, just for
some sort of statement so that critics--whom he disparages as "denialists"--can't
say the IPCC "is silent."
The AP itself uses the term "climate skeptics,"
which is less pointed than "denialists" but is still problematic. The
purported opposition between "skeptics" and adherents to "the scientific
consensus" is nonsensical, for skepticism is at the very heart of the
scientific method. When the data call a theory into question, a scientist
revisits theory. Instead, the panel is employing the antiscientific
method: It "is expected to affirm" theory "with greater certainty than
ever."
And look how the AP sums up that theory: "that
humans are cooking the planet by burning fossil fuels and cutting down
CO2-absorbing forests." That's science fiction, not science. If Damon Knight
were still with us, he might observe of the IPCC report: "It's a cooked
book."
Meanwhile, a
BBC story on the forthcoming report quotes this
enthusiastic endorsement from Arthur Petersen, a Dutch climate scientist:
"It is a major feat that we have been able to produce such a document which
is such an adequate assessment of the science. That being said, it is
virtually unreadable!"
And London's
Daily Telegraph quotes Tony Blair, a former
British prime minister, as saying in New York: "After this panel assessment
this week, there will no longer be any serious doubt in the minds of serious
people that this is a serious problem."
Manbearpig may be super serial, but the key Blair
phrase is "serious people." Perhaps you recognize the logical fallacy. If
not, here's a hint: Although Tony Blair was born in Edinburgh, his father
was English and his mother was Irish.
Continued in article
**How to mislead with statistics
Are over 1/3 of the adult population of the USA not interested in being in the
work force?
Record 92,898,000 Americans (aged 16 and over) Not In The Workforce ---
http://www.breitbart.com/big-government/2015/01/09/record-92898000-americans-not-in-the-workforce/
Jensen Comment
This is one way to mislead with statistics. A huge proportion of that 93 million
Americans supposedly not in the work force are really in the work force. A huge
proportion of them are working and drawing tax-free wages in the $2 trillion
underground cash economy, including legitimate work that's not reported (e.g.,
house cleaners) and illegal work (e.g., drug dealing and other crimes) ---
http://www.cs.trinity.edu/~rjensen/temp/TaxNoTax.htm
Secondly there are a high proportion of Americans who do not want to work or
cannot work. Millions get lifetime disability pensions. More millions have
partners or parents earning enough income for financial support.
How to Mislead With Statistics
"How the Government Exaggerates the Cost of College," by David Lennhardt,
The New York Times, July 29, 2014 ---
http://www.nytimes.com/2014/07/29/upshot/how-the-government-exaggerates-the-cost-of-college.html?rref=upshot&_r=2
The government’s official statistic for
college-tuition inflation has become somewhat infamous. It appears
frequently in the news media, and policy makers lament what it shows.
No wonder: College tuition and fees have risen an
astounding 107 percent since 1992, even after adjusting for economywide
inflation, according to the measure. No other major household budget item
has increased in price nearly as much.
But it turns out the government’s measure is deeply
misleading.
For years,
that measure was based on the list prices that
colleges published in their brochures, rather than the actual amount
students and their families paid. The government ignored financial-aid
grants. Effectively, the measure tracked the price of college for rich
families, many of whom were not eligible for scholarships, but exaggerated
the price – and price increases – for everyone from the upper middle class
to the poor.
Here’s an animation that explains the difference
succintly. It shows the government’s estimate of how college costs have
changed since 1992 — and, for comparison, toggles between the changes in the
colleges' published prices and actual prices, according to the College
Board, the group that conducts the SAT.
Continued in article
Bob Jensen's threads on higher education controversies ---
http://www.trinity.edu/rjensen/HigherEdControversies.htm
**How to Mislead With Statistics: This time its the Bureau of Labor
Statistics
"4 Million Fewer Jobs: How The BLS Massively Overestimated US Job
Creation," by Tyler Durden, Zero Hedge, August 5, 2014 ---
http://www.zerohedge.com/news/2014-08-05/4-million-fewer-jobs-how-bls-massively-overestimated-us-job-creation
**How to Mislead With Statistics
A new, much discussed comparison of student learning
from non-tenure-track and tenure-track instructors downplayed its limitations
and has been widely misunderstood, writes philosopher Edward Kazarian
"What the Study Didn't Show." by Edward Kazarian, Inside Higher Ed,
September 23, 2013 ---
http://www.insidehighered.com/views/2013/09/23/essay-report-comparing-student-learning-instructors-and-tenure-track
**How to Mislead With Statistics (definitions and assumptions)
"Unemployed by ObamaCare: Three new Fed surveys highlight damage to the
labor market," The Wall Street Journal, August 21, 2014 ---
http://online.wsj.com/articles/unemployed-by-obamacare-1408664211?tesla=y&mod=djemMER_h&mg=reno64-wsj
"The Full-Time Scandal of Part-Time America Fewer than half of U.S. adults
are working full time. Why? Slow growth and the perverse incentives of ObamaCare,"
by Mortimer Zuckerman, The Wall Street Journal, July 13, 2014 ---
http://online.wsj.com/articles/mortimer-zuckerman-the-full-time-scandal-of-part-time-america-1405291652?tesla=y&mod=djemMER_h&mg=reno64-wsj
There has been a distinctive odor of hype lately
about the national jobs report for June. Most people will have the
impression that the 288,000 jobs created last month were full-time. Not so.
The Obama administration and much of the media
trumpeting the figure overlooked that the government numbers didn't
distinguish between new part-time and full-time jobs. Full-time jobs last
month plunged by 523,000, according to the Bureau of Labor Statistics. What
has increased are part-time jobs. They soared by about 800,000 to more than
28 million. Just think of all those Americans working part time, no doubt
glad to have the work but also contending with lower pay, diminished
benefits and little job security.
On July 2 President Obama boasted that the jobs
report "showed the sixth straight month of job growth" in the private
economy. "Make no mistake," he said. "We are headed in the right direction."
What he failed to mention is that only 47.7% of adults in the U.S. are
working full time. Yes, the percentage of unemployed has fallen, but that's
worth barely a Bronx cheer. It reflects the bleak fact that 2.4 million
Americans have become discouraged and dropped out of the workforce. You
might as well say that the unemployment rate would be zero if everyone quit
looking for work.
Last month involuntary part-timers swelled to 7.5
million, compared with 4.4 million in 2007. Way too many adults now depend
on the low-wage, part-time jobs that teenagers would normally fill. Federal
Reserve Chair Janet Yellen had it right in March when she said: "The
existence of such a large pool of partly unemployed workers is a sign that
labor conditions are worse than indicated by the unemployment rate."
There are a number of reasons for our predicament,
most importantly a historically low growth rate for an economic "recovery."
Gross domestic product growth in 2013 was a feeble 1.9%, and it fell at a
seasonally adjusted annual rate of 2.9% in the first quarter of 2014.
But there is one clear political contribution to
the dismal jobs trend. Many employers cut workers' hours to avoid the
Affordable Care Act's mandate to provide health insurance to anyone working
30 hours a week or more. The unintended consequence of President Obama's
"signature legislation"? Fewer full-time workers. In many cases two people
are working the same number of hours that one had previously worked.
Since mid-2007 the U.S. population has grown by
17.2 million, according to the Census Bureau, but we have 374,000 fewer jobs
since a November 2007 peak and are 10 million jobs shy of where we should
be. It is particularly upsetting that our current high unemployment is
concentrated in the oldest and youngest workers. Older workers have been
phased out as new technologies improve productivity, and young adults who
lack skills are struggling to find entry-level jobs with advancement
opportunities. In the process, they are losing critical time to develop
workplace habits, contacts and new skills.
Most Americans wouldn't call this an economic
recovery. Yes, we're not technically in a recession as the recovery began in
mid-2009, but high-wage industries have lost a million positions since 2007.
Low-paying jobs are gaining and now account for 44% of all employment growth
since employment hit bottom in February 2010, with by far the most
growth—3.8 million jobs—in low-wage industries. The number of long-term
unemployed remains at historically high levels, standing at more than three
million in June. The proportion of Americans in the labor force is at a
36-year low, 62.8%, down from 66% in 2008.
Part-time jobs are no longer the domain of the
young. Many are taken by adults in their prime working years—25 to 54 years
of age—and many are single men and women without high-school diplomas. Why
is this happening? It can't all be attributed to the unforeseen consequences
of the Affordable Care Act. The longer workers have been out of a job, the
more likely they are to take a part-time job to make ends meet.
The result: Faith in the American dream is eroding
fast. The feeling is that the rules aren't fair and the system has been
rigged in favor of business and against the average person. The share of
financial compensation and outputs going to labor has dropped to less than
60% today from about 65% before 1980.
Why haven't increases in labor productivity
translated into higher household income in private employment? In part
because of very low rates of capital spending on new plant and equipment
over the past five years. In the 1960s, only one in 20 American men between
the ages of 25 and 54 was not working. According to former Treasury
Secretary Larry Summers, in 10 years that number will be one in seven.
The lack of breadwinners working full time is a
burgeoning disaster. There are 48 million people in the U.S. in low-wage
jobs. Those workers won't be able to spend what is necessary in an economy
that is mostly based on consumer spending, and this will put further
pressure on growth. What we have is a very high unemployment rate, a slow
recovery and across-the-board wage stagnation (except for the top few
percent). According to the Bureau of Labor Statistics, almost 91 million
people over age 16 aren't working, a record high. When Barack Obama became
president, that figure was nearly 10 million lower.
The great American job machine is spluttering. We
are going through the weakest post-recession recovery the U.S. has ever
experienced, with growth half of what it was after four previous recessions.
And that's despite the most expansive monetary policy in history and the
largest fiscal stimulus since World War II.
Continued in article
**How to Mislead With Statistics
"Stop using income as a guide to economic class," Updated by Matthew
Yglesias, Vox, May 12, 2015, ---
http://www.vox.com/2015/5/12/8592689/income-class
**How to mislead with
statistics (definitions)
Jim Borden: America’s Biggest Fears – and Mine ---
htps://www.jborden.com/americas-biggest-fears-and-mine/
Jensen Comment
This type of survey is misleading because it depends crucially upon
what questions are asked plus
how all questions are worded.
For example, there's a huge difference between the wording
of "illegal immigration" versus "Open borders to all seeking to enter." The
phrase "Illegal immigration" to most implies illegal immigration at rates
experienced in the last decade or so. The phrase "Open borders to all seeking to
enter" is an entirely different fear not mentioned in the survey, but it is a
fear that Trump probably wins heaviest on these days. Trump is not building his
political base on illegal immigration at present rates. He's building his base
on fears of open borders, and Democrats are not helping by avoiding mentioning
limits to welcomed immigration hordes.
There's a huge difference between the phrase "High medical
bills" versus "Spending $4+ trillion per year on Medicare-for-All." For many
spending $4+ trillion annually on most any single government program is the
most scary thing they can imagine. Others cannot even comprehend the difference
between $3 billion versus $3 trillion as long as fat cats pay the difference. At
$4+ trillion per year all cats will starve.
I also question how the sampling population "Americans"
was sampled. It's virtually impossible in research such as this to even reach
tens of millions of Americans, and there are tens of millions more who will
refuse to give out such information when contacted,
In other words, I contend that this study is more
misleading than helpful --- mostly due to what
questions are asked plus how all
questions are worded
WaPost fact-checker gives
Ocasio-Cortez four Pinocchios for Pentagon claim ---
https://thehill.com/homenews/media/419730-wapost-fact-checker-gives-ocasio-cortez-four-pinocchios-for-pentagon-clai
**How to Mislead With Statistics (definitions)
Scientific American: Web Searches Reveal (in Aggregate) What We’re Really
Thinking ---
https://www.scientificamerican.com/article/web-searches-reveal-in-aggregate-what-were-really-thinking/
Jensen Comment
The "in aggregate" qualifier is important since anecdotal data for particular
individuals can be especially misleading. And even "in aggregate" search
outcomes may also be misleading. For example, what does it really tell us to
learn (hypothetically speaking today) that nearly half the clergy (including
priests) do a huge amount of searching of the Dark Web? This does not in and of
itself tell us what they're "really thinking." Conversely, if we discover that
over half the male bureaucrats versus female bureaucrats on the job spend over
half of every working week at porn sites it may tell us more about that these
addicts are "really thinking."
For my three blogs I spend hours each day searching all over the Web. Since
the thousands of sites visited often are so many and varied I doubt that anybody
can learn what I'm "really thinking" other than that I must be search for a
variety of really interesting links to share with my readers..
An author might spend thousands of hours at literature sites. That author may
be studying the crafts of other authors to help his or her own writing. Then
again that author might simply be looking for passages that can be cleverly
plagiarized.
**How to Mislead
With Statistics
(definitions)
Survey: Half of Community College Students Report Mental Health Problems
---
https://www.insidehighered.com/quicktakes/2016/03/02/survey-half-community-college-students-report-mental-health-problems?utm_source=Inside+Higher+Ed&utm_campaign=2e5937c71d-DNU20160302&utm_medium=email&utm_term=0_1fcbc04421-2e5937c71d-197565045
Newly released
results of a survey
of community college students found that almost 50 percent of those surveyed had
a current or recent mental health problem. The Wisconsin HOPE Lab, a research
organization, surveyed 4,000 students at 10 community colleges across seven
states. The resulting report found that 36 percent of respondents suffered from
depression, and 29 percent had struggled with anxiety. Those rates are higher
than those among students at four-year institutions, the lab reported. And
mental health conditions also were more common among younger students at
community colleges.
Fewer than half of the community college students with a mental health condition
were receiving treatment, the report found. Roughly 88 percent of community
colleges do not have a psychiatrist or other licensed prescriber on staff or
contracted to provide services, according to the lab. And 57 percent do not
provide suicide prevention resources.
Jensen Comment
When the respondents diagnosis themselves there can be widely varying responses
in terms of subjective assessments of "depression" and "anxiety." At times
virtually all college students have anxiety. Community college students,
however, may have greater anxieties because they are more apt to be part-time
students who are unemployed or greatly under-employed. Many may be stressed out
by responsibilities for yount children while they are trying to earn college
credits.
**How to Mislead With Statistics
Output Per Hour Worked in the USA
From the CFO Journal's Morning Ledger on July 17, 2015
For a decade, economic output per hour worked has
barely budged, and over the past two quarters it has fallen. That is, if you
consult the federal government’s formula for calculating productivity,
something that contrarian economists at Google Inc. and
Stanford recommend against, the
WSJ’s Timothy Aeppel reports. Google chief
economist Hal Varian says sluggish U.S. productivity doesn’t reflect a
high-tech wave of innovations that save people time and money. “There’s a
lack of appreciation for what’s happening in Silicon Valley,” he says,
“because we don’t have a good way to measure it.”
One measurement problem is that a lot of what
originates in America’s technology hub is free or nearly free. But the only
way goods and services move the official U.S. productivity needle is when
consumers and businesses pay for them. Anything free, no matter how much it
improves everyday life, isn’t included. Many in Silicon Valley say it is
just a matter of time before new innovations surface in salable products and
goose the official productivity tally. First, though, businesses must
harness the innovations to the products they sell. Driverless-car
technology, for example, won’t hit city streets for a while.
**How to Mislead With Statistics (definitions, incomplete analysis)
Bacon report serves up baloney
by Tom Shattuck, The Boston Harold, October 27, 2015 ---
http://www.bostonherald.com/news/columnists/tom_shattuck/2015/10/shattuck_bacon_report_serves_up_baloney
**How to Mislead With Statistics (definitions, ranking)
Worst Companies to Work For ---
https://247wallst.com/special-report/2018/06/07/worst-companies-to-work-for/
Jensen Comment
This is misleading in the sense that types of employees differ in organizations.
For example, a university might be stingy with pay and benefits to adjunct
faculty while doing quite well for tenured faculty. An airline might be highly
rated by its pilots and mechanics but not so hot by its ticket agents. My wife
says in the old days hospitals treated nurses like dirt while laying down red
carpets for physicians, including ill-tempered physicians who were arrogant and
rude to hospital staff. I think that in this era of multi-million dollar
lawsuits hospitals and physicians are now more courteous to staff. Even before
the #MeToo craze, lawsuits took its toll on sexual harassment. Still, lingering
sexual harassment in the work place varies by industry --- temptations are
greater in film making, hospitals, airlines, and colleges relative to oil
drilling and road construction. Affirmative action greatly increased sexual
harassment risks in some industries. When I was on a battleship there were only
2,600 men on board. Being a woman today on a Navy ship expanded employment
opportunities and sexual harassment risks simultaneously. The military does not
have a good record to date in preventing sexual abuse, but risks vary greatly
among assignments.
**How to Mislead With Economics (definitions)
Stanford University: An End to Traffic Jams? It Might Not Be a Dream ---
https://www.gsb.stanford.edu/insights/end-traffic-jams-it-might-not-be-dream?utm_source=Stanford+Business&utm_campaign=937c696fa8-Stanford-Business-Issue-137-5-13-2018&utm_medium=email&utm_term=0_0b5214e34b-937c696fa8-70265733&ct=t(Stanford-Business-Issue-137-5-13-2018)
Jensen Comment
Most of this article is not misleading, but there are misleading parts. For
example, suppose you teach third grade in Palo Alto, California. Your spouse
teaches in an Oakland community college. On your combined incomes you would all
have to live in a motor home if you wanted to live in Silicon Valley on the
other side of the Bay. In other words living anywhere near Palo Alto and having
your spouse commute to Oakland is just not affordable due to housing costs in
the Silicon Valley. At present you live in an affordable house in a not-so-nice
part of Oakland. Now the question is how to commute to work if tolls on both the
Bay Bridge, San Mateo Bridge, and the Dunbarton Bridge were set at $50 going
each way in rush hours to speed up commuting time using those bridges. This
makes using those bridges no longer affordable unless you want to drive to Palo
Alto at 1:00 am across the Dunbarton each work day and catch the rest of your
sleep in the car before your work day begins. Public transportation during rush
hour takes forever even if you use BART to pass under the San Francisco Bay. For
one thing there's the problem of economically and conveniently getting from a
train or bus terminal in Palo Alto to your school. After the long public
transportation trip from Oakland to Palo Alto you will be too exhausted to ride
a bike to school.
My point here is that for millions of commuters congestion pricing on
roadways would be a disaster when public transportation and car pooling are both
logistical nightmares. Like all economists the authors of the above study (Ostrovsky
and Schwartz ) propose solutions that sound great if
you ignore the assumptions behind those solutions. The simple fact of
the matter is that with congestion pricing millions of people would have to
abandon their present jobs --- such as trading your great teaching job in Palo
Alto for a not-so-nice teaching job in Oakland. Or you could divorce your spouse
and give up custody of your children. Then living in a motor home in a school
parking lot becomes more feasible --- some workers at Apple making nearly a
million dollars a year live in parking lot vans.
There are also millions of people who, in the right circumstances, fit nicely
into the Ostrovsky and Schwartz model. On nice days some people can live in a
city and ride a bicycle or scooter to work. The Danes and the Dutch have worked
this system out to perfection by, among other things, taxing ownership of a car
to the point where a car is not affordable by over
half their citizens. In Moscow wintertime bikes and scooters aren't so great but
the Moscow subway is fantastic. It would be nice to have such a subway system
serving Los Angeles but the cost of such a system in sprawling Lost Angeles is
astronomical. The same can be said for Silicon Valley.
But it is also true that something must be done about gridlock in USA large
cities. Congestion pricing proposed by Ostrovsky and Schwartz is a thought, but
it's just not a realistic solution except under very restrictive assumptions.
Elon Musk wants to bore tunnels in every city. Immensely costly tunnels relieve
some of the congestion in Boston, but due to growth and other things traffic is
worse than ever.
There is no Swiss Army knife solution to gridlock. But we must keep searching
for practical ideas. Probably one of the best ideas in the age of technology is
to expand the workforce doing their jobs from home. Indeed it's possible to
teach most high school or college courses from home. It's probably not a good
idea to teach third grade from home.
**How to Mislead With Statistics by Cherry Picking Examples
"Foreign Students Aren't Edging Out Locals, Numbers Show," by Karin
Fishcher, Chronicle of Higher Education, February 2, 2015 ---
http://chronicle.com/article/Foreign-Students-Arent-Edging/151547/?cid=wb&utm_source=wb&utm_medium=en
Jensen Comment
This article misleads in a number of ways.
Firstly there's no definition of the term "edging out." Since there are always
more applicants to flagship universities than are admitted, in any given
flagship university thousands of foreign students ipso facto means some in-state
qualified applicants are refused admission. The question is whether those denied
would otherwise be admitted if there were not so many higher-paying foreign
student admissions.
Secondly the article cherry picks illustrations and avoids looking at
flagship universities turning away enormous numbers of qualified applicants. For
example the 10% Law at the University of Texas and Texas A&M by the admissions
of their presidents means that huge numbers of qualified applicants are being
denied admission to these universities because of the 10% Affirmative Action
constraints ---
http://www.trinity.edu/rjensen/HigherEdControversies2.htm#10PercentLaw
Adding thousands of foreign admissions further denies thousands of qualified
in-state applicants.
Thirdly, the article dwells on rates of change rather than absolute numbers
and then cherry picks only schools where the numbers look pretty good except for
UC Berkeley. For example no mention is made of the University of Illinois.
University of Illinois at Urbana–Champaign in
2014 enrolled 4,898 students from China, more than any other American
university. They comprise the largest group of international students on the
campus, followed by South Korea (1,268 in fall 2014) and India (1,167).
Graduate enrollment of Chinese students at UIUC has grown from 649 in 2000
to 1,973 in 2014 ---
http://en.wikipedia.org/wiki/University_of_Illinois_at_Urbana%E2%80%93Champaign#International_students
It is obvious that flagship universities are playing both ends against the
middle. They want generous state support for in-state residents and then get top
dollar by denying qualified in-state residents so they can earn higher tuition
from foreign students.
Bob Jensen's threads on higher education controversies ---
http://www.trinity.edu/rjensen/HigherEdControversies.htm
**How to Mislead With an Article Title
"Who Really Likes the Police? Older, Richer, White, Conservative Republicans,"
by Emily Eakins, Reason Magazine, October 24, 2014
http://reason.com/blog/2014/10/24/who-really-likes-the-police-older-riche2
Jensen Comment
The title of this article is consistent with the content, but it's still
misleading. The majority of inmates in prison are there because of crimes
committed against the poor and middle class. In part this is because there are
many more poor and middle class people. But it's mostly about the proximity of
criminals to the poor and middle class. The wealthy people are tucked away
behind gated neighborhoods, have the most expensive security systems money can
buy, and are not out walking the streets at night or living in high crime areas.
A large proportion of the felonies are drug related where the victims are far
from being wealthy.
The bottom line is that the residents who are in effect getting the most 911
call policing service from police are the people claim that they hate the
police because they do not get enough protection.
And they are correct!
Young black and Latino females have a higher probability of being raped than
young white females. Black and Latino men have a higher probability of being
assaulted and/or murdered than white men.
Perhaps the article should have the title "Who Really Needs the Police? Poor,
Liberal Democrats." Of course those that need the police the most probably have
a higher probability to be abused by the police such as in racial profiling.
Hence, those that need the police the most may also fear and dislike the police
the most.
All this of course does not mean that everybody has equal protection by
the police.
But this is partly a chicken versus the egg thing. The people having the worst
protection by the police also live in parts of the USA having the highest
probability of crime. To provide everybody with equal protection might mean
having 50 police officers walking the beat back and forth on every block of high
crime areas. This becomes insanely expensive to provide truly equal protection
under the law.
One of my 70+ year-old neighbors, a very close friend, in San Antonio
volunteered to ride in Mary Mont district police cars at night. He did so simply
to help the police who otherwise patrolled alone in their cars. He had a license
to carry a gun, but I don't think he did so when accompanying a police officer.
He told me that in what was called our Mary Mont district of San Antonio, over
90% of the 911 calls came from the one subsidized housing project in Mary Mont
--- what the author
P.J.
O'Rourke called a "whorehouse for drug dealers."
The bottom line is that the residents who were in effect getting the most 911
call policing service from the San Antonio police in Mary Mont were the people
who probably also would claim that they hated the police because they did not
get enough protection. And they were correct!
**How to Mislead With Statistics
"Women with MBAs face a gender-based pay divide that starts as soon as they
graduate, and plagues them throughout their careers," by Natalie Kitroeff
and Jonathan Rodkin, Bloomberg, October 20, 2015 ---
http://www.bloomberg.com/news/articles/2015-10-20/the-real-cost-of-an-mba-is-different-for-men-and-women?cmpid=BBWGP102115_BIZ
As far as investments go, business school is an
unimpeachable bet for young professionals who can muster $100,000. MBAs, who
are typically in their early 30s and have already spent a few years in the
workforce, saw their salaries triple within eight years of graduation. They
also report consistently high levels of job satisfaction and career growth,
according to a survey of thousands of alumni conducted by Bloomberg
Businessweek as part of the magazine’s annual ranking of business schools.
But that general contentment hides a troubling divide: Within a few years of
graduation, women with MBAs earn lower salaries, manage fewer people, and
are less pleased with their progress than men with the same degree.
Each year, we rank business schools by polling
students on topics such as academics, career services, and campus climate.
We also ask employers about skills they seek in MBA hires and which schools
best prepare their graduates. This year, for the first time, we surveyed
alumni who graduated six to eight years ago, asking them how well their
degrees had delivered on the promise of a fulfilling, well-paid job. The
12,773 responses we collected offer a wealth of salary information and other
data on MBAs working in a variety of industries.
The inclusion of the alumni responses helped propel
Harvard Business School to the top of the 2015 rankings. HBS alums reported
the largest gains in compensation and many attributed their success to their
alma mater. Last year’s No. 1, Duke Fuqua School of Business, slipped to
eighth overall, partly because of a comparatively lackluster job placement
rate of 86.1 percent, which is below the 87.9 percent rate overall.
Women and men start their post-MBA careers earning
almost the same money—$98,000 for women and $105,000 for men—according to
our survey of those who graduated from 2007 through 2009. But the gap then
widens sharply. By 2014 men hauled in a median of $175,000 and women,
$140,000. That means employers pay women 80 percent of what men with the
same degree take home.
Continued in article
Jensen Comment
I want to start out by saying that I believe there are differences in
compensation levels by gender. However, the article above, and virtually every
other related article I've ever encountered, does not probe very deep to uncover
possible reasons for the so-called gender salary gap. First I want to compliment
the authors for using medians rather than mean averages. This is the first thing
I look for because means can be skewed by outliers more easily than medians.
Let me begin by noting that what are outliers in smaller populations can also
be outliers in large populations but there are randomly more such outliers in
large populations. It was always surprising in the NBA when the Houston Rockets
imported
Yao Ming, a 7-foot 6 inch Chinese center. In both the USA and China Yao Ming
is an outlier in terms of height ---
https://en.wikipedia.org/wiki/Yao_Ming
In terms of population the USA has an estimated population of slightly
over 320 million people. China has an estimated 1,376 million people. People
over seven feet tall are outliers in both the USA and China. However, the odds
of having many more people over seven feet tall are much greater in China than
the USA due to the sheer difference in the populations of these two nations.
In a random sample of 320 female MBA graduates and a random sample of 1,376
male graduates one would expect that the mean and median salaries of the men
would be higher than the women due to random chance because there are many more
high-salaried outliers in the larger sample of males. Since the lower salaried
men and women are bounded by zero the means
and medians of the random samples are driven upward by the higher salaried men
and women. Suppose we designated a high salary as anything over $200,000. One
would expect more high salaried men than women in these two samples due to the
difference in the sample sizes.
It's the bottom part of the salary distribution where gender analysis becomes
more complicated. In a random world one would expect to find more zero-salaried
men than women in the above samples due to the sample size differences. However,
here is where the real world is not random because statistically female MBA
graduates in reality have a higher probability of not entering or soon dropping
out of the work force to devote full time or nearly full time to mothering their
new babies.
As a result statistical analysis showing higher mean or median salaries among
the 1,376 males is not probably as much due to hiring and promotion bias due to
gender as it is to such complications as having more male MBA graduates than
female graduates and the higher probability that a female will leave the
full-time work force at least during the early years of raising children.
Of course all of this becomes more complicated when the number of female
graduates becomes larger relative to male graduates. I think there are still
more male MBA graduates, but in terms of accounting graduates the number of
females now exceeds the number of male graduates. Also the large public
accounting firms are hiring more female than male graduates. Carried to extremes
suppose that we randomly sample 1,376 female accounting graduates and 321 male
accounting graduates. My hypothesis is that the mean and median salaries of the
females will exceed those of the males after five years of employment. Of course
these averages may differ for the entire populations of accounting graduates
because the gender differences among all accounting graduates is closer to 50/50
than 1,376/321.
There are other complications in this analysis. My opinion is that
newly-hired male and female graduates joining a given local office of a Big Four
firm will earn the same starting compensation. However, the new hires in the San
Francisco local office will have higher salaries than the San Antonio office of
a given firm based upon huge differences in costs of living in these two cities.
To do a complete gender analysis we would have to factor in whether there are
gender differences based upon cost of living in local offices. Do mothers tend
to prefer or avoid San Francisco vis-a-vis San Antonio? It's certainly more
complicated to both work full time and raise young children in San Francisco
where rents are now higher than anywhere in the USA. Hence one would expect
mothers to prefer San Antonio relative to San Francisco. One would expect more
females moving away from the San Francisco office once they became mothers.
My point is that one has to be very careful when it comes to inferring gender
bias causality in most any type of statistical analysis beyond the usual problem
of spurious correlation. I think most studies of gender differences in salaries
do not delve deeply enough into the really complicated factors affecting
statistical analysis outcomes.
But I do still believe there is gender bias against mothers of young children
in terms of employment and compensation. I'm not convinced there's such a degree
of bias against those women who are not mothers of young children.
"The 100 Best Companies For Working Moms," by Jacquelyn Smith,
Working Mothers Magazine via Business Insider, September 16, 2014 ---
http://www.businessinsider.com/best-companies-for-working-moms-2014-9
The largest CPA firms are among the best places for moms to be employed.
Bob Jensen's threads on careers ---
http://www.trinity.edu/rjensen/Bookbob1.htm#careers
Bob Jensen's threads on the histories of women in the professions ---
http://www.trinity.edu/rjensen/Bookbob2.htm#Women
Gallup ---
http://en.wikipedia.org/wiki/Gallup_%28company%29
Jim Clifton ---
http://en.wikipedia.org/wiki/Jim_Clifton *
**How to Mislead With Statistics
"The Big Lie: 5.6% Unemployment," by Former Gallup CEO Jim Clifton,
LinkedIn, February 3, 2015 ---
https://www.linkedin.com/pulse/big-lie-56-unemployment-jim-clifton?trk=pulse-det-nav_art
Here’s something that many Americans -- including
some of the smartest and most educated among us -- don’t know: The official
unemployment rate, as reported by the U.S. Department of Labor, is extremely
misleading.
Right now, we’re hearing much celebrating from the
media, the White House and Wall Street about how unemployment is “down” to
5.6%. The cheerleading for this number is deafening. The media loves a
comeback story, the White House wants to score political points and Wall
Street would like you to stay in the market.
None of them will tell you this: If you, a family
member or anyone is unemployed and has subsequently given up on finding a
job -- if you are so hopelessly out of work that you’ve stopped looking over
the past four weeks -- the Department of Labor doesn’t count you as
unemployed. That’s right. While you are as unemployed as one can possibly
be, and tragically may never find work again, you are not counted in the
figure we see relentlessly in the news -- currently 5.6%. Right now, as many
as 30 million Americans are either out of work or severely underemployed.
Trust me, the vast majority of them aren’t throwing parties to toast
“falling” unemployment.
There’s another reason why the official rate is
misleading. Say you’re an out-of-work engineer or healthcare worker or
construction worker or retail manager: If you perform a minimum of one hour
of work in a week and are paid at least $20 -- maybe someone pays you to mow
their lawn -- you’re not officially counted as unemployed in the
much-reported 5.6%. Few Americans know this.
Yet another figure of importance that doesn’t get
much press: those working part time but wanting full-time work. If you have
a degree in chemistry or math and are working 10 hours part time because it
is all you can find -- in other words, you are severely underemployed -- the
government doesn’t count you in the 5.6%. Few Americans know this.
There’s no other way to say this. The official
unemployment rate, which cruelly overlooks the suffering of the long-term
and often permanently unemployed as well as the depressingly underemployed,
amounts to a Big Lie.
And it’s a lie that has consequences, because the
great American dream is to have a good job, and in recent years, America has
failed to deliver that dream more than it has at any time in recent memory.
A good job is an individual’s primary identity, their very self-worth, their
dignity -- it establishes the relationship they have with their friends,
community and country. When we fail to deliver a good job that fits a
citizen’s talents, training and experience, we are failing the great
American dream.
Gallup defines a good job as 30+ hours per week for
an organization that provides a regular paycheck. Right now, the U.S. is
delivering at a staggeringly low rate of 44%, which is the number of
full-time jobs as a percent of the adult population, 18 years and older. We
need that to be 50% and a bare minimum of 10 million new, good jobs to
replenish America’s middle class.
I hear all the time that “unemployment is greatly
reduced, but the people aren’t feeling it.” When the media, talking heads,
the White House and Wall Street start reporting the truth -- the percent of
Americans in good jobs; jobs that are full time and real -- then we will
quit wondering why Americans aren’t “feeling” something that doesn’t
remotely reflect the reality in their lives. And we will also quit wondering
what hollowed out the middle class.
Jim Clifton is Chairman and CEO of Gallup. He is author of The
Coming Jobs War (Gallup Press, 2011).
Jensen Comment
Part-time jobs, especially those without benefits, should be excluded from the
calculation of the main unemployment rate --- especially since so many of the
"new jobs created" are part-time jobs.
**How to Mislead With Statistics (definitions)
"The macabre truth of gun control in the US is that toddlers kill more people
than terrorists do," by Cindy West, The Guardian, March 13, 2016 ---
http://www.theguardian.com/commentisfree/2016/mar/13/the-macabre-truth-of-gun-control-in-the-us-is-that-toddlers-kill-more-people-than-terrorists-do
So what Cindy?
Suppose that the probability of being shot dead by a toddler in 0.000000044.
Further that other things being equal a $1 trillion initiative to buy back guns
from USA households reduces that probability to 0.000000022 but does drive it to
zero since not everyone will sell their guns to the government. This probably
does not meet any reasonable cost-benefit test even though it's impossible to
put a monetary value on any single human life.
Furthermore if $1 trillion is spent buying back guns other things are not
equal in the real world. The probability of then being shot dead by a home
invader greatly increases if most home owners no longer have guns that home
invaders fear.
PS
Here's another example of the proportionate law of large numbers
Not a single day now goes by without an Islamist
suicide bombing, rocket attack, shooting spree, kidnapping or stabbing somewhere
in the world.
Sohrab Ahmari ---
http://www.wsj.com/articles/global-jihads-deadly-calendar-1458688588?mod=djemMER
Islam has an estimated 1.7 billion adherents ---
https://en.wikipedia.org/wiki/Islam_by_country
There are over 2 billion Christians earth ---
https://en.wikipedia.org/wiki/Christian_population_growth
Each day on average there are kidnappings and murders by people claiming to
be Christians. The probabilities of being harmed by people claiming to be
Islamists may even be smaller than the probabilities of being harmed by people
claiming to be Christians.
A Cambridge professor on how to stop being so easily manipulated by
misleading statistics ---
http://qz.com/643234/cambridge-professor-on-how-to-stop-being-so-easily-manipulated-by-misleading-statistics/
**How to Mislead With Statistics (definitions, non-stationarity)
Women ranked a favorable
social status for their partner more highly in 2008 than in 1939. Interestingly,
men rated a woman’s desire for home and children and good cooking and
housekeeping more highly over time — perhaps because these qualities were no
longer taken for granted in a wife.
"What men and women wanted in a spouse in 1939 —
and how different it is today," by Ana Swanson,
The Washington Post, April 19, 2016 ---
https://www.washingtonpost.com/news/wonk/wp/2016/04/19/what-men-and-women-wanted-in-a-spouse-in-1939-and-how-different-it-is-today/
Jensen Comment
This falls into my "How to Mislead With Statistics" Department. The reason is
that marriage in 1939 is not the same as marriage in 2008 --- largely due to the
important impact birth control had upon living relationships between males and
females. For example, it's now common for "significant other relationships" to
lead to marriage relationships only when the couple elects to start having
children. Thus, it's really not surprising that a woman's "desire for home and
children" increased in importance as a marriage condition in 2008 relative to
1939. In other words a couple in a long-term unmarried relationship has less
incentive for marriage in 2008 until they plan to have children.
My point is that comparing a "marriage" in 2008 with a
"marriage" in 1939 is a lot like comparing apples and lemons. They are not the
same
**How to Mislead With Statistics (definitions, non-stationarity)
This is the best research we've seen on how
many Americans are really struggling financially, and it is heartbreaking
---
http://www.businessinsider.com/just-capital-research-on-living-wage-2016-12/#a-staggering-number-of-americans-arent-making-a-living-wage-1
Jensen Comment
The article does not stress what seems to me to be obvious in the graphic ---
raising the minimum wage may be dysfunctional. For example, California, Oregon,
and Washington that have raised minimum rages have some of the worst problems
with counties struggling financially. Firstly, there's a problem with cost of
living. A minimums wage of $25 per hour might not be enough in those states
counties where living costs are relatively high. For example, in San Francisco
nearly all low-wage workers have to be homeless or cummute long distances from
outside the city. This is not the case in San Antonio, Texas.
Secondly, there's a problem of how businesses and local governments deal
with minimum wages. One problem is outsourcing such as when a university or
courthouse outsourcers its janitorial services. A related problem is to cut back
on working hours as wage rates increase. Another problem, especially in
California and Oregon is discouraging new business ventures due to taxation and
regulations. For example, the Town of Portland, Oregon just imposed a surtax on
some companies (like Wal-Mart) to raise money to help the homeless. This may
help the homeless at the expense of low-wage workers who will actually see their
incomes decline due to working less hours and losing opportunities for jobs in
companies that now shirk moving into Portland.
Will the Minimum Wage Debate Ever Be Settled?
---
https://www.theatlantic.com/business/archive/2016/12/minimum-wage-debate/510383/
Jensen Comment
About the only thing we can conclude is that minimum wages have differing
impacts in differing circumstances such as local employment markets, worker
ages, living costs, and fringe benefits such as the value of
training/apprenticeships. In a really free market economy some workers might
benefit greatly from working for nothing if the training is extremely valuable.
And we have to consider the prospects of workers on minimum wages. Wal-Mart has
low wages but in most instances those wages are above minimum wage. But Wal-Mart
also offers solid promotion tracks for quality workers, and the promotions in
almost all instances are relatively attractive even if the work itself can be
boring and stressful at the same time.
Minimum wage impact data from Seattle may be highly misleading when compared
to similar studies in San Antonio.
Minimum wage impact data may be quite different when comparing Burger King in
San Antonio with construction workers in San Antonio. This is because Burger
King resists hiring undocumented workers nationwide whereas in San Antonio there
are probably more undocumented construction workers in the underground
(cash-only) market than those who work for reported wages and fringe benefits.
In my opinion raising the minimum wage in San Antonio will only strengthen the
underground market job supply. Authorities are hesitant to shut down the
underground labor supply since doing so will badly hurt thousands and thousands
of families of undocumented workers.
Comparing minimum wages in Europe with the USA is also misleading. In spite
of the current media coverage of immigration issues in Europe, those issues are
relatively small compared to immigration issues for people easily getting into
the USA from Latin and South America.
**How to Mislead With Statistics (Definitions, Incomplete Analysis)
The following two articles show how economists can put two different spins
on the same data (something that seems to be taught in social sciences in
general whenever politics gets involved).
The City of Seattle hired a group of economists to study the transitory
impact of minimum wage hikes on labor and business firms in Seattle. I say
"transitory" because the wage hikes are being phased in and won't reach the $15
level until
The Study
REPORT ON THE IMPACT OF SEATTLE’S MINIMUM WAGE ORDINANCE ON WAGES, WORKERS,
JOBS, AND ESTABLISHMENTS THROUGH 2015 The Seattle Minimum Wage Study Team1
University of Washington
July 2016
http://evans.uw.edu/sites/default/files/MinWageReport-July2016_Final.pdf
This report presents the short-run effects of the
Seattle Minimum Wage Ordinance on the Seattle labor market. The Seattle
Minimum Wage study team at the University of Washington analyzed
administrative records on employment, hours, and earnings from the
Washington Employment Security Department to address two fundamental
questions: 1) How has Seattle’s labor market performed since the City passed
the Minimum Wage Ordinance, and particularly since the first wage increase
phased in on April 1, 2015? 2) What are the short-run effects of the Minimum
Wage Ordinance on Seattle’s labor market? While quite similar at first
glance, these two questions address very different issues and require very
different methods to answer. The first question can be studied with a simple
before/after comparison. Although the comparison is simple, it risks
conflating the impact of the minimum wage with other local trends. Many
things have happened in Seattle’s labor market since June 2014, most of them
having little or nothing to do with the minimum wage itself. The City has
enjoyed steady expansion in tech sector employment, and a construction boom
fueled by rising residential and commercial property prices. Even the
weather – a key determinant of economic activity in the Puget Sound region –
was favorable in 2015, with record-low precipitation in the early months of
the $11 minimum wage. The before-after comparison can tell us the net impact
of all these simultaneous trends, but this comparison cannot distinguish
among them. Our second question – the more important one for purposes of
evaluating the policy – aims to isolate the impact of the minimum wage from
all the other regional trends seen over the same time period. Whereas the
first question asks “are we better off than we were when Seattle raised the
minimum wage” and requires only a simple comparison of yesterday to today,
the second asks “are we better off than we would have been if Seattle had
not adopted a higher minimum wage?” To answer it requires imagining how the
local economy would look in absence of a Minimum Wage Ordinance. While it is
impossible to directly observe what would have happened if no wage ordinance
had been implemented, this report uses widely accepted statistical
techniques to compare Seattle in its current state—with the presence of the
Minimum Wage Ordinance—to an image of what Seattle might have looked like
today if not for the Minimum Wage Ordinance. We take advantage of data going
back to 2005 to build a model of the way Seattle’s labor market typically
works. We also take advantage of data on nearby regions that did not
increase the minimum wage to better understand how other factors might have
influenced what we observe in the City itself.
3 In this report, we present findings on wages,
workers, jobs, and establishments. Our findings can be summarized as
follows: Wages: The distribution of wages shifted as expected. The share
of workers earning less than $11 per hour declined sharply. This decline
began shortly after the ordinance was passed. However, similar declines
were seen outside of Seattle, suggesting an improving economy may be the
cause of the change in the distribution of wages. Low-Wage Workers: In the
18 months after the Seattle Minimum Wage Ordinance passed, the City of
Seattle’s lowest-paid workers experienced a significant increase in wages.
The typical worker earning under $11/hour in Seattle when the City Council
voted to raise the minimum wage in June 2014 (“low-wage workers”) earned
$11.14 per hour by the end of 2015, an increase from $9.96/hour at the time
of passage. The minimum wage contributed to this effect, but the strong
economy did as well. We estimate that the minimum wage itself is responsible
for a $0.73/hour average increase for low-wage workers. In a region where
all low-wage workers, including those in Seattle, have enjoyed access to
more jobs and more hours, Seattle’s low-wage workers show some preliminary
signs of lagging behind similar workers in comparison regions. The minimum
wage appears to have slightly reduced the employment rate of low-wage
workers by about one percentage point. It appears that the Minimum Wage
Ordinance modestly held back Seattle’s employment of low-wage workers
relative to the level we could have expected. Hours worked among low-wage
Seattle workers have lagged behind regional trends, by roughly four hours
per quarter (nineteen minutes per week), on average. Low-wage individuals
working in Seattle when the ordinance passed transitioned to jobs outside
Seattle at an elevated rate compared to historical patterns. Seattle’s
low-wage workers did see larger-than-usual paychecks (i.e., quarterly
earnings) in late 2015, but most— if not all—of that increase was due to a
strong local economy. Increased wages were offset by modest reductions in
employment and hours, thereby limiting the extent to which higher wages
directly translated into higher average earnings. At most, 25% of the
observed earnings gains—around a few dollars a week, on average—can be
attributed to the minimum wage. Seattle’s low-wage workers who kept
working were modestly better off as a result of the Minimum Wage Ordinance,
having $13 more per week in earnings and working 15 minutes less per week.
4 Jobs: Overall, the Seattle labor market was
exceptionally strong over the 18 months from mid2014 to the end of 2015.
Seattle’s job growth rate tripled the national average between mid-2014 and
late 2015. This job growth rate outpaced Seattle’s own robust performance
in recent years. Surrounding portions of King County also had a very good
year; the boom appears to fade with geographic distance. Job growth is
clearly driven by increased opportunities for higher-wage workers, but
businesses relying on low-wage labor showed better-than-average growth as
well. For businesses that rely heavily on low-wage labor, our estimates of
the impact of the Ordinance on the number of persistent jobs are small and
sensitive to modeling choices. Our estimates of the impact of the Ordinance
on hours per employee more consistently indicate a reduction of roughly one
hour per week. Fewer hours per employee could reflect higher turnover
rather than cutbacks in staffing. Reductions in hours are consistent with
the experiences of low-wage workers. Establishments: We do not find
compelling evidence that the minimum wage has caused significant increases
in business failure rates. Moreover, if there has been any increase in
business closings caused by the Minimum Wage Ordinance, it has been more
than offset by an increase in business openings. In sum, Seattle’s
experience shows that the City’s low-wage workers did relatively well after
the minimum wage increased, but largely because of the strong regional
economy. Seattle’s low wage workers would have experienced almost equally
positive trends if the minimum wage had not increased. Although the minimum
wage clearly increased wages for this group, offsetting effects on low-wage
worker hours and employment muted the impact on labor earnings. We strongly
caution that these results show only the short-run impact of Seattle’s
increase to a wage of $11/hour, and that they do not reflect the full range
of experiences for tens of thousands of individual workers in the City
economy. These are “average” effects which could mask critical distinctions
between workers in different categories. Our future work will extend
analysis to 2016, when Seattle’s minimum wage increased a second time and
began to distinguish between businesses of different sizes and industries.
It will also incorporate more detailed information about workers by linking
employment records to other state databases. This will give us a greater
capacity to answer key questions, such as whether the workers benefiting
most from higher minimum wages are more likely to be living in poverty. We
are also in the process of collecting additional survey information from
Seattle businesses and conducting interviews with a worker sample tracked
since early 2015. The next report, expected in September, will focus
specifically on how the minimum wage has affected nonprofit organizations.
Continued in article
Spin From Investors Business Daily
The Bitter Lesson From Seattle's Minimum Wage Hike
August 10, 2016
http://www.investors.com/politics/commentary/the-bitter-lesson-from-seattles-minimum-wage-hike/
Spin From a Respected, Albeit Very Liberal Economist --- Jared Bernsten
So far, the Seattle minimum-wage increase is doing what it’s supposed to
do
August 10, 2016
https://www.washingtonpost.com/posteverything/wp/2016/08/10/so-far-the-seattle-minimum-wage-increase-is-doing-what-its-supposed-to-do/?utm_term=.d5bf0bcad438
Jensen Comment
The issue of minimum wage became an enormous political issue when the workers
receiving the wage changed. When I grew up in the 1950s and 1960s and those
McJobs having low pay were primarily intended to be temporary jobs where
students could earn a little outside the classroom and where younger people in
general could get a start in the work place. Nobody with normal capabilities
intended to make careers out of those very low paying McJobs. Somewhere along
the way things changed to where now those McJobs became careers for many folks
who are not destined for bigger and better careers in the economy. With that
change came increasing demands to increase the minimum wage to a more suitable
wage for longer-term careers.
The real question that the Seattle study is trying to answer is whether
raising the minimum wage in Seattle had a positive or negative impact on
employers, employees, and low-skilled unemployed. The answer seems to be varied
(depending upon what economist and what workers you consult.) Impact on is hard
to isolate statistically because Seattle is a relative boom town due to the high
tech economic sector. Thus just because a lot of McJob employers are still
thriving is confounded by the boom times apart from the minimum wage increase.
McJob employers are likely to be hit harder in communities having less boom
success in general. Also the wage increases are being phased in over time (until
2021)such that there is not one big boom to study.
It's hard judge impact on some McJob employers in very large or otherwise
isolated communities relative to those surrounded by competition not required to
raise minimum wage. For example, restaurant customers in in Seattle are not
likely to go elsewhere because their favorite restaurant had to raise prices
slightly. Restaurant customers on the very edge of Seattle might drive a bit
further for better prices.
Thus the impact of the Seattle's minimum wage hike focuses more on
labor/employment impact than on employer impact. And herein commences the lying
or possible lying with statistics. I would dwell on all the issues since you can
read them for your self in the above links.
Personally, I think the $15 minimum wage eventually is a good idea in a high
cost city like Seattle.
But I would like to conclude with what I think is trickery in Jared
Bernstein's rejoinder. He skirts important issues like how entry level employees
without skills (like students in need of part-time jobs and employees who messed
up their early years (e.g., with drugs and crime) get a start without higher
turnover in the minimum wage jobs that open up entry-level jobs.
At times he totally ignores the study's findings such as:
Wages:
The distribution of wages shifted as expected.
The share of workers earning less than $11 per hour declined sharply.
This decline began shortly after the ordinance was passed.
However, similar declines were seen outside of Seattle, suggesting an
improving economy may be the cause of the change in the distribution of
wages.
Second he seems to imply without more data or foresight that in larger firms
the minimum wage is an even better idea than it is at fast-food restaurants.
What he fails to note that it is in the larger firms where robotics alternatives
to low-paying jobs are exploding. :
Wal-Mart Has An Army Of Robots That Pick, Pack, and Send in Their 130
Distribution Centers ---
http://www.businessinsider.com/wal-mart-warehouse-robots-2013-12
McJobs in those Wal-Mart distribution centers have already disappeared with
advances in robotics. Perhaps this was inevitable but eliminating McJobs with
higher minimum wages will speed up job sacrices to robots and drive more and
more low skilled workers to welfare rolls and crime.
Also see
The Automated Wal-Mart: A Thought Experiment
http://faculty.washington.edu/sandeep/automated/walmart.pdf
The Seattle experiment is hard to extrapolate to every town and city in the
USA. I think higher minimum wages where the cost of living is very high is
probably a good idea. For example, the cost of living is even high in the
suburbs of Seattle and San Francisco. But the same minimum wage successes for
those metropolitan areas can be a disaster in rural America where the job losses
are likely to be enormous, For example, down the road from our mountain cottage
is an old fashioned hardware store that is already struggling to compete with
stores 10 miles away (in Littleton, NH), stores like Wal-Mart, Home Depot, and
Lowes. A $15 minimum wage might close the doors on my favorite and struggling
little hardware store that now makes almost zero profit. The workers in this
store are typically part-time spouses who supplement the family income with a
bit of added wage within walking distance of the store.
The main conclusion from this illustration is that professional economists
cannot agree on much of anything!
PS
Cleveland just rejected a $15 miniumum wage ---
http://townhall.com/tipsheet/mattvespa/2016/08/12/good-call-cleveland-rejects-15-minimum-wage-proposal-n2204064?utm_source=thdailypm&utm_medium=email&utm_campaign=nl_pm&newsletterad=
**How to Mislead With Statistics (definitions)
Applicants to Law Schools (Downward) Versus Medical Schools (Upward)
http://taxprof.typepad.com/taxprof_blog/2018/05/applications-to-law-school-versus-medical-school.html
Jensen Comment
Of course these are applicants and not admissions. In a given university I
suspect it's much more common for medical school applicants to be rejected. But
I did not research that question. Rejection rates are misleading. For example,
Harvard's first year rejection rate is not extremely high because so many
possible applicants give up Harvard hopes before they apply. I'm told that if
you're a good pre-med graduate and get rejected don't give up hope. Keep
studying and retaking the MCAT. The same is probably true for law student
rejections who are really good students.
**How to Mislead With Statistics (definitions)
Less than 1% of Delta Flight Attendant Applicants are Accepted
It's harder to get invited to the Delta Flight Attendant training center than to
get into Harvard University ---
http://www.businessinsider.com/delta-airlines-flight-attendant-training-school-inside-look-2018-3
Jensen Comment
Yes Harvard has a higher acceptance rate, but saying it's "harder to be a flight
attendant" is misleading due to the lower population of applicants. It's a bit
analogous to saying it's harder to be a Delta flight attendant than a Delta
pilot.
The clinker here is that neither applicants to Harvard nor applicants to be
Delta pilots apply unless they themselves feel that they have sufficient
credentials to incur the cost and/or ordeal of applying. The same is true for
aspiring flight attendants but many, many more of those applicants think they
have sufficient credentials to be accepted.
The credentials themselves are far less rigorous in the case of flight
attendants.
**How to Mislead With Economics (definitions)
Elizabeth Warren favors having the IRS create software for filing many more
taxpayer returns ---
https://www.vox.com/2016/4/13/11417676/elizabeth-warren-tax-return-free-filing-tax-day-intuit-hr-block-turbotax-automatic-simple
Jensen Comment
This might put TurboTax, TaxAct, and other tax software companies out of
business, but it may not eliminate the need for professional tax help and return
filing by tax specialists, CPAs, and attorneys. Senator Warren's proposal would
simplify filing of tax returns but not simplify most of the very complicated USA
Income Tax Code that confuses so many taxpayers.
The article is critical of the present IRS free-filing program that's
allegedly used only by less than 3% of the taxpayers even though nearly 50% of
the taxpayers who file tax returns owe no income taxes.
Comparisons of the filing simplicity of other nations with the USA is
misleading because their income tax laws are so simple compared to the
exceedingly complicated USA Tax Code. Also many of those nations rely on taxes
other than income taxes such as the VAT tax that's popular in Europe. Another
example is the way the USA provides complicated income tax relief for medical
services and medications compared to other nations with relatively simple
national health care plans that do not complicate income tax filing.
Reply from Barbara Scofield
An additional complication is the interaction of
state returns and federal returns. I do volunteer tax preparation with AARP
Tax Aide which targets low income senior citizens. Many of our clients come
because the state of Kansas gives a refundable tax credit for property tax
paid by those who meet the age and income requirements. To file for this
"homestead credit," the taxpayers must file federal and state returns, even
though they have had no tax withheld from their social security and do not
meet the thresholds to file taxes. We have to trick the software by adding
$1 of Other income, which we call "For Filing Purposes" so that the software
will be willing to efile the returns.
The "homestead credit" is a great program, but it
breaks my heart when clients get back the $250 they paid in property tax,
which suggests that the value of their home is incredibly low.
Barbara W. Scofield, PhD, CPA
Professor of Accountancy
Washburn University
HC 311L Topeka, KS 66621
**How to Mislead With Statistics (definitions)
Can It Really Be True That Half of Academic Papers Are Never Read?
https://www.chronicle.com/article/Can-It-Really-Be-True-That/243564?cid=at&utm_source=at&utm_medium=en&elqTrackId=c455702a0de2462ebafcb2afb044e117&elq=aa24539026d84dd9b66f1ae178897fdd&elqaid=19283&elqat=1&elqCampaignId=8794
Jensen Comment
This article is misleading in the sense that the word "read" is a spectrum
rather than a point. I "read" papers on a spectrum from reading the title to
reading the abstract to scanning or speed reading the article to really digging
into article like I have to discuss it in detail in front of an audience or on
my blogs. Also there is a matter of timing. I may have only read the abstract of
a paper in 1981. Then in 2018 a link to the article pops up in one of my
searches on Google Scholar. In 2018 I might dig much deeper into that article.
My point is that over long periods of time papers get read a whole lot more than
in the first year after publication.
There are of course great risks in how I read. Sometimes I may settle for the
main conclusion of an article (e.g., that "half of academic papers are never
read") as stated in the title without reading further. This is dangerous in my
blog, however, since I might additionally state something about the article
that's incorrect about that article, an error that makes it obvious I did not
read the article. Thus I try to read articles that I additionally comment about
in my blogs. If I don't do an added search to see if the findings have been
replicated I'm remiss by merely accepting the findings of a study as being
accurate. I did read the article linked above in detail (it's a short article)
but I did not search for replications.
Over my 20 years of blogging I depended a great deal on the integrity of the
source. I'm more apt to trust reputable publishers (e.g., the NYT and WSJ or
Nature versus some lone wolf blogger). But reputable journals such as the
Chronicle of Higher Education do not referee articles as rigorously as
The Accounting Review (TAR). However, in spite of rigorous refereeing, TAR
studies are rarely replicated ---
http://faculty.trinity.edu/rjensen/TheoryTAR.htm
TAR on occasion publishes articles where the data were fabricated or filled with
errors ---
http://faculty.trinity.edu/rjensen/Plagiarism.htm#ProfessorsWhoPlagiarize
The world of expanding knowledge in the Academy is far from perfect.
Many authors who cheat are never detected.
I run three blogs and am very active on two listservs. I cannot count, nor do
I want to count, the mistakes that have been pointed out my readers. Over 99% of
the time I admit to making mistakes when I agree they were mistakes. However,
it's also true that at times I've baited readers with claims or intentional
mistakes for the purpose of generating discussion. I appreciate that "lurkers"
have their reasons for not speaking up, but it can be frustrating when they
don't correct my unintentional 99+% mistakes or intentional 0.01%- mistakes.
Probably the main reason I blog is to learn rather than teach. At this late
stage of my life in retirement I don't really care about building a resume or
seek "fame." What I really want is to learn, and I wish lurkers would do more to
help me out. Often my responders also make mistakes ---this leads to what I
really, really enjoy --- a good debate! Often lurkers do not respond because for
one reason or another they don't want to debate with me in public. Sigh!
**How to Mislead With Statistics (definitions, rankings)
Who pays the most tax in Europe?
http://www.euronews.com/2018/04/26/who-pays-the-most-tax-in-europe-
Jensen Comment
You've probably heard me warn repeatedly that when taxes are compared it can be
misleading unless you also compare what those taxes are paying for in family
living. Income tax rates in the USA are relatively low and highly progressive
with nearly half of the taxpayers paying zero income taxes. But this is
misleading since things like health care and public education are paid out of
other taxes and/or personal savings. Even when comparing nations with national
health care plans funded heavily out of income taxes, comparing tax rates can be
misleading. Firstly there are taxes other than income taxes such as VAT taxes
and sales taxes. Secondly, not all national health care programs are equivalent
in terms of how certain coverages are paid for. In Germany, for example, the
public health plan is rather minimal and most Germans that can afford it have
private supplemental medical insurance. My neighbors from England at the moment
are back in the U.K. arranging to sell a parent's home for nursing home care
expenses. Nursing home care in the U.K. is covered in the national health plan
but revenues from home sales must be applied to this care --- so I'm told by my
neigbors.
In Europe taxes supposedly pay for college education and/or job training, but
less than half the young people are admitted to programs funded by tax dollars
---
http://faculty.trinity.edu/rjensen/HigherEdControversies.htm#Tertiary
Other people depend upon companies to fund on-the-job training, and many people
are not allowed into college unless they study in other countries or take
distance education courses such as MOOCs..
**How to Mislead With Statistics (definitions, rankings, correlations)
States Where Teachers Are Paid the Most and Least ---
https://247wallst.com/special-report/2018/05/15/states-paying-teachers-most-and-least/2/
Jensen Comment
Higher pay does not necessarily translate to higher graduation rates. New York
pays the highest salaries and is mired down in down in low graduation rates.
South Dakota has low teacher pay and high graduation rates.
Also note the cost of living ranking reported with each state. This matters a
lot where pay buys a whole lot more (think housing) in South Dakota versus New
York and Connecticut.
**How to Mislead With Statistics (definitions)
Left-Leaning VOX: The $21 trillion Pentagon accounting error that can’t pay
for Medicare-for-all, explained ---
https://www.vox.com/policy-and-politics/2018/12/3/18122947/pentagon-accounting-error-medicare-for-all
The US military budget is such a bloated
monstrosity that it contains accounting errors that could finance two-thirds
of the cost of a government-run single-payer health insurance system. All
Americans could visit an unlimited array of doctors at no out of pocket
cost. At least that’s a notion spreading on left-wing Twitter and endorsed
and amplified by newly elected Rep.
Alexandria Ocasio-Cortez,
one of
Democrats’ biggest
2018 sensations and an undeniable
master at the fine art of
staying in the public
eye.
Unfortunately, it’s not true.
The idea
spread like a game of telephone from
a Nation article
to the US Congress while losing a crucial point of detail: The Pentagon’s
accounting errors are genuinely enormous, but they’re also just accounting
errors — they don’t represent actual money that can be spent on something
else.
Proponents of this vision have the political wind at their backs and
continue to deploy the idea effectively to win intra-party arguments without
really making any headway on the core obstacles to writing a
Medicare-for-all bill that could become law. That said, to the extent that
political power rather than concrete legislation is the goal, that’s
probably for the best.
Misunderstandings fly around on Twitter all the time, and
AOC’s level of policy knowledge is pretty typical for a
member of Congress.
But this particular flub is telling about progressive frustration over the
double standard on military versus non-military spending, and also the
fraught state of play regarding the push for a Medicare-for-all program.
The Pentagon’s mystery $21 trillion, explained
The underlying article by Dave Lindorff in
the Nation that kicked this off is an investigative report into the
Defense Department’s accounting practices.
Lindorff reveals that Pentagon accounting is quite weak, that the department
keeps flunking outside audits, that funds are shifted between accounts
without proper oversight, and that overall documentation of what’s actually
happening with the Pentagon’s vast budget is extremely poor.
Lindorff goes beyond these observations to allege that what’s happening
amounts to deliberate fraud, the purpose of which is to persuade Congress to
increase appropriations levels beyond what would otherwise be approved.
Continued in article
Jensen Comment
We really cannot compare proposed Medicare-for-All plan without more specific
definitions of "Medicare-for-All" and the "cared for population." For example,
Medicare currently does not pay for the enormous cost of long-term nursing care.
Medicare only pays 80% of most of the things it does cover like hospital and
doctor care.
Also Medicare has built up trust funds over the 50 years using payroll
deductions from individuals and employers. The trust funds are not sustainable
at predicted usage rates, but it's not like the existing Medicare program did
not accumulate any finds for the elderly and disabled. A
Medicare-for-All plan does not have 50 years of payroll deductions to help pay
for an abrupt shock to the system.
Advocates of Medicare-for-All never mention that Medicare for all is mostly a
private sector program where claims are serviced in the private sector along
with private sector doctor, nursing, and medicine delivery of goods and
services. Medicare is not like the U.K. system where most services are delivered
by government employees.
The Nation's analysis of the Defense Department's expenses ignores the fact
that even if we entirely eliminated the current Army, Navy, and Air Force the
government's obligations to retired and disabled former military personnel would
carry on for hundreds of billions of dollars into the indefinite future. And how
long would the USA and its Medicare-for-All program survive without any Army,
Navy, and Air Force?
The Nation's analysis is an example of totally irresponsible and misleading
statistics.
WaPost fact-checker gives Ocasio-Cortez four Pinocchios for Pentagon claim
---
https://thehill.com/homenews/media/419730-wapost-fact-checker-gives-ocasio-cortez-four-pinocchios-for-pentagon-claim
**How to Mislead With Statistics (definitions, correlation)
Harvard Study Concludes People Who Graduate During Recessions Earn Less Money —
but They’re Happier ---
https://hbr.org/2018/09/people-who-graduate-during-recessions-earn-less-money-but-theyre-happier?utm_medium=email&utm_source=newsletter_daily&utm_campaign=dailyalert_not_activesubs&referral=00563&deliveryName=DM14780
Jensen Comment
I think this study is limited to those that have jobs for which they aspired to
rather than those that are unemployed or have jobs beneath their aspirations
such as when an Ph.D. can only get a fast-food job or an adjunct teaching job
rather than a tenure-track position.
Secondly, recessions and booms are not binary events. No two recessions are
exactly alike in degree or in terms of impact degrees on labor sector varying
impacts in the economy. A study of workers in the 2008 recession may not apply
to workers in future recessions. Happiness varies over time such as when
increased numbers of student loan borrowers are increasingly stressed over loan
repayments. Its always tough to do statistical analysis on non-stationary
systems.
Also, I'm dubious of measures of "happiness." There are many unknown
variables when studying "happiness." Also people sometimes forget things when
asked about their "happiness." For example, some respondents may ignore that
they have to still live with parents when asked about their happiness in a
particular job.
**How to Mislead With Statistics (definitions, missing variables)
50 million Americans live below the official poverty income — here are the
poorest towns in every US state
https://www.businessinsider.com/poorest-towns-in-every-us-state-2018-9
Jensen Comment
This is highly misleading for a number of reasons. Firstly the poverty line in
the USA is upper middle class in the majority of other nations, especially when
things like the safety nets of earned income credits, Medicaid, SS disability
income, food stamps, housing subsidies, and welfare are factored into the
equation.
Secondly there's an enormous $2+ trillion underground economy where
supposedly USA's "poor people" are collecting substantial tax-free cash earnings
that are never reported by employers or employees. Often those unreported
earnings are supplemented by food stamps, housing subsidies, and welfare. The
types of underground economy earnings alternatives are listed at
http://www.cs.trinity.edu/~rjensen/temp/SunsetHillHouse/SunsetHillHouse.htm
And remember that crime often pays in America. Some of the fattest cats in
the luxury penthouses that drive the most expensive cars are drug dealers,
legislators, and City Hall executives.
**How to Mislead With Statistics (definitions)
San Francisco paid $400,000 for questionable research that says its filthy
streets are clean ---
https://www.businessinsider.com/san-francisco-paid-400000-for-claims-that-its-streets-are-clean-2018-9
Jensen Comment
San Francisco is paying a heck of a lot to clean its streets including paying
the poop patrols $180,000+ per worker per year (including benefits). But it's a
little like street safety in New Orleans. The police heavily patrol New Orleans
tourist centers (think the French Quarter) but freedom from muggers and
panhandlers is not so great outside the tourist districts in New Orleans and
other big cities.
In San Francisco I suspect the same can be said for the Poop Patrol.
Cities dependent upon conventions and tourist dollars will use stratified
spending like auditors use stratified sampling. The problem with freedom to roam
in the USA is that the homeless will do just that such as moving into the
tourist areas by day and then sleeping in the residential areas, maybe near the
Pelosi mansion.
For San Francisco there's a Catch 22. The better you treat the homeless the
more of them you're going to get . When I was a little kid it was a time when
hobos still rode the rails. When they hit Swea City they knew which homes were
most likely to give out free dinners. My Grandmother Dourte's house was probably
the favorite to hit. Every day around noon time we had several hobos sitting on
the back porch eating dinner off her china ---
http://faculty.trinity.edu/rjensen/max01.htm
You can guess why they always headed for the Dourte house when they hit town on
the rails. God bless her soul!
**How to Mislead With
Statistics (definitions, distortions)
Chicago's mayor declared Chicago is on the firmest financial footing in
years, but taxpayers should understand that the pitch is deeply misleading ---
http://www.chicagobusiness.com/opinion/how-emanuel-misleading-you-citys-debt
**How to Mislead With Statistics (definitions)
Krugman redefines ‘Medicare for all,’ but gets it wrong ---
http://pnhp.org/news/krugman-redefines-medicare-for-all-but-gets-it-wrong/
. . .
Comment:
By Don
McCanne, M.D.
“Medicare for all…would mean allowing individuals and employers to buy into
Medicare – basically a big public option.” Who says? Well Paul Krugman and
many others. This is not simply a debate about labels. This is a debate
about fundamental policy. Are we going to accept the status quo with the
tweak of a public option, or are we going to address the fundamental defects
in our system that have driven up costs, perpetuated mediocrity, and left
tens of millions vulnerable with impaired access to health care with all of
its consequences and often with intolerable financial hardship?
This
is similar to the debate that took place within the Democratic Party just
before Hillary Clinton and Barack Obama began jockeying for the 2008
presidential nomination. The Democratic Party machine was in complete
control of the policy debate on health care reform. The neoliberal party
elite had decided that we were going to “build on what works” –
employer-sponsored and union-supported plans – and reject single payer based
on their concepts of what was politically feasible. Those of us advocating
for the expanded and improved Medicare for all single payer approach were
ejected from the conversations (often rudely so – they were in charge!).
Similarly, with the contest for the 2016 Democratic presidential nomination,
the debate at the platform committee confirmed that the battle had not
changed. The neoliberal leadership, represented by Neera Tanden, was
successful in rejecting the single payer Medicare for all plank.
Tanden,
of the Center of American Progress, has continued the fight for control of
the policy debate by releasing their new proposal, “Medicare Extra For All.”
Although some of the tweaks proposed seem beneficial, it basically continues
the current dysfunctional, fragmented financing system, but with one
important political change. They have stolen the “Medicare for all” label!
This has contributed to the ubiquitous deception that the public option is
Medicare for all. When the current candidates campaign on Medicare for all
but behind the scenes are supporting an option to buy into Medicare while
accepting campaign funds from the insurance and pharmaceutical industries,
we need to call them on their deception.
It is
no wonder the public is confused, even if they do not realize it. When Nobel
laureate Paul Krugman jumps in and says Medicare for all is allowing
individuals and employers to buy into Medicare as a public option, then we
know that the political campaigns are corrupted with deceptions. How can we
get the public to understand that a well designed, single payer national
health program – a bona fide Improved Medicare for All – is the reform that
they crave?
**How to Mislead With Statistics (Distortions, Definitions)
50 million Americans live below the official poverty income — here are the
poorest towns in every US state
https://www.businessinsider.com/poorest-towns-in-every-us-state-2018-9
Jensen Comment
This is highly misleading for a number of reasons. Firstly the poverty line in
the USA is upper middle class in the majority of other nations, especially when
things like the safety nets of earned income credits, Medicaid, SS disability
income, food stamps, housing subsidies, and welfare are factored into the
equation.
Secondly there's an enormous $2+ trillion underground economy where
supposedly USA's "poor people" are collecting substantial tax-free cash earnings
that are never reported by employers or employees. Often those unreported
earnings are supplemented by food stamps, housing subsidies, and welfare. The
types of underground economy earnings alternatives are listed at
http://www.cs.trinity.edu/~rjensen/temp/SunsetHillHouse/SunsetHillHouse.htm
And remember that crime often pays in America. Some of the fattest cats in
the luxury penthouses that drive the most expensive cars are drug dealers,
legislators, and City Hall executives.
**How to Mislead With Statistics (definitions and dumb expectations)
From the CFO Journal on October 18, 2018
New York taxpayers
sent about
$24 billion more to the U.S. government
last
year than the state got back in federal spending, Comptroller Thomas
DiNapoli reported Wednesday, according to Bloomberg.
Jensen Comment
What if all states expected to get at least the same amount back in federal
spending as they paid into the USA treasury? Who would pay for the USA military
and the gazillions more spent at the national level that only indirectly benefit
individual states?
What a dumb expectation!
**How to Mislead With Statistics
How many of your state's taxes leave the state (and don't come back)?
https://www.businessinsider.com/states-pay-federal-government-lose-gain-2019-1
Jensen Comment
The biggest problem with this study is virtually impossible to define what taxes
leave the state and what taxes come back. The closest I could come to the
definition used in this study is the referenced item at
https://www.osc.state.ny.us/reports/budget/2018/federal-budget-fiscal-year-2017.pdf
For example, consider the amount for "corporate taxes leaving the state." The
definition appears to be whether the corporation is chartered in state. But this
has almost nothing to do with what that corporation does for the state. For
legal reasons many USA corporations are chartered in Delaware most of whom have
no presence whatsoever in Delaware. A St Louis corporation may do 95% of its
business in Minnesota while filing its Federal tax return as a chartered
Missouri corporation.
There's a tremendous lag factor not accounted for in this study. For example the
"social taxes and contributions" (think Social Security and Medicare deductions)
sent out of New York to the IRS for a worker over 40 years may later be returned
to Florida after that worker retires in Miami. Florida later benefits for income
sacrificed earlier in New York and confounds the error in calculating the net
tax benefits or costs each year for New York versus Florida.
Definitions of Federal Spending in states begins on Page 9 of
https://www.osc.state.ny.us/reports/budget/2018/federal-budget-fiscal-year-2017.pdf
These definitions are heavily based on "Direct Payments" (especially Social
Security and Medicare) to each state. It also includes Federal spending for
"Procurements" such as when the Air Force buys supplies in Vermont for a pilot
training base. But if the USAF pays $5 million for supplies from Vermont
businesses the net benefit to Vermont is not $5 million . Vermont businesses
maybe paid $4+ million to other states for those supplies later sold to the Air
Force base in Vermont.
Then there's the tremendous difference between capital expenditures versus
annual expenses. When NASA built the Cape Canaveral launching site in Florida
much of the huge expenditure was a one-time investment. Florida got a huge
influx of cash for a short period of time like three years needed to build the
site. This great influx of taxpayer money into Florida is not reflective of the
annual influx of operating revenues thereafter.
I'm totally befuddled by the rankings of states according to net tax
benefits/losses at
https://www.businessinsider.com/states-pay-federal-government-lose-gain-2019-1
For example, I'm completely confused why Missouri is at Rank 19 with a
per-capita +$3,472 benefit in comparison to why Minnesota is at Rank 45 with a
negative -$1,078 per-capita deficit.
I think this study is more than nonsense. It's absolutely misleading based upon
lousy definitions.
**How to Mislead With Statistics (definitions)
How median household income has changed (allegedly very little)
https://apnews.com/bfac20c7cdf14719ac03d750d8fdffbc/US-household-incomes-grew-in-2017,-yet-inequality-worsens
But Much depends on how "household income" is defined
Vox: Trump’s White House says wages are rising more than liberals think:
The White House is probably right ---
https://www.vox.com/2018/9/6/17823072/trump-cea-wages
**How to
Mislead With Statistics (Distortions, Definitions
Nearly Half of Undergraduates Are Students of Color. But Black Students
Lag Behind ---
https://www.chronicle.com/article/Nearly-Half-of-Undergraduates/245692?cid=at&utm_source=at&utm_medium=en&elqTrackId=4b25b4445cd449deab2ac48c46f77478&elq=e53c5591cbc9463eaa6a81d8ee5ad6fd&elqaid=22249&elqat=1&elqCampaignId=10942
The key data
points in the American Council on Education's new report on race and
ethnicity in higher education come as no surprise: College-student
populations are growing more diverse, yet achievement gaps persist among
different racial groups.
Still, the poor
outcomes for black students in particular are glaring.
All students of
color now make up more than 45 percent of the undergraduate population,
compared with less than 30 percent two decades ago, the association's report
found. Nearly one-third of graduate students are now people of color.
Hispanic students have shown the most growth; they are enrolling in and
completing college at levels never seen before.
Black students,
too, represent a larger share of the undergraduate- and graduate-student
population than 20 years ago, and a larger share of the students who earn
degrees. But black students who began college in the fall of 2011 had higher
dropout rates and lower six-year completion rates — 46 percent at public
institutions, 57 percent at private institutions — than any other racial
group.
The gender gap
for black students is wider than it is for any other group, as nearly
two-thirds of black undergraduates, and more than two-thirds of black
graduate students, are women. Black male students pursuing bachelor's
degrees were the most likely among any demographic group to drop out after
their freshman year.
Black
undergraduates also owed 15 percent more than other students after
graduation: an average of $34,010, compared with $29,669 for all students.
One-third of black students accumulated more than $40,000 in debt after
graduation, versus 18 percent of students over all.
Even with a
bachelor's degree, black graduates between the ages of 25 and 34 had lower
salaries than other graduates of a similar age, and their unemployment rate
was two-thirds higher, on average.
Continued in article
Jensen Comment
The phrase "color" is somewhat ambiguous in the USA --- especially since Latinos
are multiracial, particularly in terms of origins from Europe versus darker
native heredity ---
https://en.wikipedia.org/wiki/Demography_of_the_United_States#Race_and_ethnicity
It would seem that "whites" are now underrepresented in undergraduate
enrollments in the USA.
According to the 2010–2015
American Community Survey, the racial
composition of the United States in 2015 was:
|
Race |
Population (2016 est.) |
Share of total population |
|
Total |
318,558,162 |
100% |
|
One race |
308,805,215 |
96.9% |
|
White |
233,657,078 |
73.3% |
|
Black or African American |
40,241,818 |
12.6% |
|
American Indian and Alaska Native |
2,597,817 |
0.8% |
|
Asian |
16,614,625 |
5.2% |
|
Native Hawaiian and Other Pacific Islander |
560,021 |
0.2% |
|
Other races |
15,133,856 |
4.8% |
|
Two or more races |
9,752,947 |
3.1% |
|
White and Black or African American |
2,525,509 |
0.8% |
|
White and American Indian and Alaska Native |
1,884,407 |
0.6% |
|
White and Asian |
1,956,740 |
0.6% |
|
Black or African American and American Indian and Alaska Native |
318,302 |
0.1% |
Population distribution by race 1940-2010 (in %)
Hispanics
are shown like part of the races. Source:
U.S. Census Bureau, decennial census
of population, 1940 to 2010.[47]
|
Years |
1940 |
1950 |
1960 |
1970 |
1980 |
1990 |
2000* |
2010* |
|
White |
89.8 |
89.5 |
88.6 |
87.5 |
83.0 |
80.3 |
75.1 |
72.4 |
|
Black or African American |
9.8 |
10.0 |
10.5 |
11.1 |
11.7 |
12.1 |
12.3 |
12.6 |
|
American Indian and Alaska Native |
|
|
|
|
0.8 |
0.8 |
0.9 |
0.9 |
|
Asian and Native Hawaiian
and other Pacific Islander |
|
|
|
|
1.5 |
2.9 |
3.8 |
5.0 |
|
Some other race |
|
|
|
|
3.0 |
3.9 |
5.5 |
6.2 |
|
Two or more races |
|
|
|
|
|
|
2.4 |
2.9 |
|
Sum (%) |
99.6 |
99.5 |
99.1 |
98.6 |
100 |
100 |
100 |
100 |
*Data
are shown for the White, Black or African American, American Indian and
Alaska Native, Asian and Native Hawaiian and Other Pacific Islander, and
Some other race alone populations.
**How to Mislead With Statistics (distortions)
Tesla owners are more satisfied than any other auto brand's, according to
Consumer Reports ---
https://www.businessinsider.com/tesla-tops-consumer-reports-owner-satisfaction-list-2019-2
I might also point out that the Chevy Bolt electric car also came out in the Top
10
Jensen Comment
This is what I call "satisfaction" being conditioned on unmentioned supplements.
Nearly every owner of a Tesla or Bolt has a supplement of a second gas-guzzling
vehicle (think SUV or pick up truck). What would be more interesting to me is if
Consumer Reports asked two-car owners which car they would give up if they were
only allowed to keep only one of their two cars. My guess is that the most
satisfying single car owner might be one with a hybrid rather than severely
range-limited Teslas or
Bolts.
Alternately the survey question might be if two-car owners would be as happy
with two electric cars as with one electric
car and one conventional vehicle.
My point is that Tesla owners are conditionally satisfied as long as they have a
convenient supplemental vehicle option for driving 300+ miles without having to
spend so much time recharging batteries on longer trips.
Also sample selection is quite biased in this survey.
Roughly half the Tesla USA buyers live in sunny California with most
of those buyers living in or near larger California cities where there are
convenient Tesla recharging stations and service centers. We can't extrapolate
their wonderful experiences with electric cars to Great Falls, Montana owners
facing -30F frigid days of batteries working poorly and no Tesla recharging
center or service center.
Tesla shares fall after Consumer Reports says it will no longer recommend
Model 3 (due to reliability issues) ---
https://www.cnbc.com/2019/02/21/tesla-tanks-subaru-soars-in-consumer-reports-new-reliability-survey.html
**How to Mislead With Statistics (distortions, definitions)
Why the US needs better crime reporting statistics ---
https://theconversation.com/why-the-us-needs-better-crime-reporting-statistics-104731
Okay, makes sense. But here’s the catch: None of
these crimes are weighted. When a “beautiful, innocent 9-year-old child who
was laying on the bed doing her homework” is murdered in Ferguson as a
retaliation killing, it counts just the same as when an individual is
arrested for shoplifting US$50 or more from the Dollar Store. This flawed
metric allows for incredible confusion
*
*How to Mislead With Statistics
(Definitions, Distortions)
How Much Accountants And Tax Preparers Earn In Every State --
https://taxprof.typepad.com/taxprof_blog/2019/02/how-much-accountants-and-tax-preparers-earn-in-every-state.html
Jensen Comment
I could make my usual criticisms such as cost of living differences and state
taxation differences that overwhelm the supposed earning differences by state.
I could also criticize the BLS mean statistics as not being accompanied with
data on variances and skewness.
Averages get distorted by wages of newly-hired college graduates mixed in with
employees having years of experience.
In tax season a whole lot of overtime gets paid to accountants who are tax
preparers where not so much overtime gets paid to accountants who don't work in
tax.
But mostly I will focus on the vagueness of what is a "an accountant and tax
preparer." Some are entrepreneurs and partnerships (including LLC corporations),
those equity owners of accounting firms. And accounting firms vary in size
from no employees to thousands of employees. And those firms most likely mix
revenues from tax preparation to systems consulting to auditing to whatever. It
would be misleading merge what partners make with the salaries they pay their
employee "accountants and tax preparers." And those salaries paid to employees
probably have a lot of benefits not picked up in the BLS data such as profit
sharing and bonuses and fringe benefits such as expensive training and day care
subsidies.
My basic point is
that "owners" of accounting firms are still doing a lot of the accounting,
auditing, consulting, and tax work alongside their employees. Public accounting
(and law) firms are not like NFL teams where owners are in the luxury
boxes and not getting knocked around on the playing fields. What is paid to an
employee in "salary" is typically only paid for the first 5-10 years until
employees either become part owners of the firm or are moved out of public
accounting into business firms or government (think FBI).
You just cannot compare what public accountants make in "salaries" with what
accountants make in business firms and government where accountants spend their
entire careers living on "salaries."
Most
public accountants are only on "salaries" for the first 5-10 years of their
careers.
After that they're working
owners
and no longer "public accountants working for owners."
And now we get to the most important reason the salaries
in the above article are so low. The problem is definitional. CPAs having
masters degrees are mixed in with "accountants and tax preparers" who might've
never graduated from high school. The non-CPAs' low
salaries drag down the BLS mean averages. Most candidates for the CPA
exam have masters degrees since they have to have 150 or more college credits to
even sit for the CPA exam.
We know
physicians and other health care providers will have huge income losses under
Medicare-for-All? Who will have the big income losses under College-for-All?
Who’ll Take a Pay Cut for Free College?
https://www.wsj.com/articles/wholl-take-a-pay-cut-for-free-college-11563404022?shareToken=st7bc13470eeb840e0ad81041fe2c97565
Democratic candidates for president, in their impressive
expansiveness, are promising free college. Some limit their proposals to
community colleges, others to state-run schools, and a few, going for broke,
want also to forgive student debt for private-college tuition. Since no
realm of American life has undergone greater inflation in recent decades
than higher education, this is no piddling promise. The cost to taxpayers
could be in the trillions, though the prospect would please a nephew of mine
who this autumn is sending a son to Dartmouth at the annual price of
$76,000.
If government is going to pay for college, at least it ought
to try to bring down the cost. I taught at a university for 30 years and
have a few suggestions. Start at the top: I would reduce the salaries of
university presidents by, say, 90%. (At the institution where I taught, the
president made more than $2 million when last I checked.) I would also evict
them from their rent-free mansions and remove their cadres of servants. The
contemporary university president, after all, has little or nothing to do
with education, but is chiefly occupied with fundraising and public
relations. If universities were restaurants, the president would be a maître
d’. To encourage their fundraising skills, perhaps they could be paid a
small commission on the money they bring into their schools—cash, so to
speak, and carry—excepting that on money used to erect more otiose buildings
filled with treadmills, computers and condom machines.
The next big cut in the cost of higher education would be in
superfluous administrative jobs, for the contemporary university is nothing
if not vastly overstaffed. All those assistant provosts for diversity, those
associate deans presiding over sensitivity programs, those directors for
student experience—out, out with them. I would also suggest dispensing with
courses that specialize exclusively in victimology, the history of victim
groups told from the point of view of the victims. Young men and women do
not need reinforcement in their already mistaken belief that they are
victims because of their skin color, ethnicity or sexuality.
Another place serious money could be saved is college
athletics. I’ve read that the highest-paid public employee in most states is
the state-university football coach. The school at which I taught is not a
state school, but its reasonably successful football coach earned $3.3
million in 2017, ranking him only 32nd among all college football coaches.
Nick Saban, the football coach at the University of Alabama,
earns $8.3 million a year. Mike Krzyzewski, the basketball coach at Duke,
earns $7 million. The argument for these astonishing figures is that
football at Alabama and basketball at Duke more than pay for themselves. The
Alabama football “program,” as they like to refer to this most brutal of
sports, with its postseason games and television fees, brings in nearly $100
million a year. Duke’s perpetually winning basketball teams doubtless result
in more student applications and alumni donations.
Under pure capitalism, Messrs. Saban and Krzyzewski might be
said to earn their pay. But if higher education is to be free, as Bernie
Sanders and Elizabeth Warren would have it, we are no longer talking about
capitalism. Coaches’ salaries could be greatly reduced and the money earned
by college sports—which means chiefly football and basketball—would need to
be turned over to the federal government to help pay the cost of education
itself.
Which brings us to the faculty. Faculty jobs in American
universities have risen well in excess of any visible improvement in the
quality of university teachers: $200,000-a-year-or-more professorships are
now not uncommon. When I began teaching in my mid-30s, an older friend, long
resident at the same university, said to me, “Welcome to the racket.” What
he meant is that I would be getting a full-time salary for what was
essentially a six-month job, and without ever having to put in an eight-hour
day. At the tonier universities, professors in the humanities and social
sciences might teach as few as three or four courses a year, the remainder
of their time supposedly devoted to research. Like the man said, a sweet
racket.
Under free higher education, perhaps it would make sense to
pay university teachers by the hour, with raises in the wage awarded by
seniority. Surely they could not complain. After all, the two most common
comments (some would say the two biggest lies) about university teaching
are, “I learn so much from my students” and “It’s so inspiring, I’d do it
for nothing.” A strict hourly wage for teachers, as free university
education may require, would nicely test the validity of that second
proposition.
Free higher education—what a splendid ring it has, sufficient
tintinnabulation to cause one to forget the old axiom that you get what you
pay for.
Mr. Epstein is author, most recently, of “Charm: The Elusive
Enchantment.”
In Europe and Elsewhere Free College Education Means College is Only for the
Intellectually Elite
Countries that provide more public funding for higher education tend to have
fewer graduates over all (restricting college education or free job training
to only the most intelligent 1/3 or Tier 2 graduates ---
https://www.insidehighered.com/news/2019/08/08/countries-often-sacrifice-postsecondary-attainment-when-they-expand-subsidies?utm_source=Inside+Higher+Ed&utm_campaign=5f76e299a1-DNU_2019_COPY_01&utm_medium=email&utm_term=0_1fcbc04421-5f76e299a1-197565045&mc_cid=5f76e299a1&mc_eid=1e78f7c952
Democratic politicians
-- many of them vying for their party's 2020 presidential nomination --
propose free college programs or other major investments in higher education
that reflect systems in countries like Finland and Sweden. But an
American Enterprise Institute report
released Thursday
argues that when developed nations dedicate more public resources to
postsecondary education, they tend to produce fewer graduates.
The
institute's customarily contrarian resident fellow, Jason Delisle, and
co-author Preston Cooper, an education research analyst at AEI, compared 35
high-income (gross domestic product per capita above $30,000) member
countries of the Organisation for Economic Co-operation and Development,
which produces statistics on countries’ total institutional spending,
college attainment rates among 25- to 34-year-olds, and government
subsidies. The OECD includes almost all large Western and Central European
countries, Australia, the Baltic states, Chile, Israel, Japan, New Zealand,
North America, Scandinavia, South Korea and Turkey.
Each
country makes sacrifices when it prioritizes one aspect of higher education
-- attainment rates, institutional spending and government subsidies -- over
another, Delisle said, a reality he thinks is often ignored during debates
about free college. Politicians in the U.S. like to suggest America can
“learn from other countries and take the good parts” of their education
systems, without considering the impact subsidized education has on the
overall quality and accessibility of college, Delisle said.
“If you
have a heavily subsidized system, that leads a country to ration higher
education, leading to a system that’s more selective,” Delisle said.
“That’s not an egalitarian higher education policy, which a lot of policy
makers on the left insist is the case.”
“If
you want less college, one way to do that is to make it free,” he said.
Delisle’s interest in researching international
spending on higher education was piqued during the 2016 presidential
campaign, he said, when Senator Bernie Sanders, the Vermont Independent,
began promoting his plan to eliminate the cost of attending public colleges
and universities. More recently, on June 24, Sanders announced his
College for All Act,
which if passed would eliminate tuition at public institutions and subsidize
learning with 100 percent government funding -- 67 percent from Washington
and 33 percent from individual states.
“[The legislation]
makes certain that all Americans, regardless of income, can get the college
education or job training they need to secure decent-paying jobs by making
public colleges, universities and trade schools tuition-free and debt-free,”
Sanders said in a
news release.
However, college admissions would become much more competitive if the U.S.
could not rely on tuition to fund its institutions, Delisle said, though the
goal of free college policy suggestions is to increase the number of
students with degrees.
“The
whole public university system in Finland has an admissions rate on par with
elite U.S. colleges,” Delisle said. “Not quite as selective as Harvard or
the [Ivy League colleges], but if you took a Berkeley, or a [University of
Virginia] -- imagine if the entire education system of the U.S. had to meet
UVA-level test scores.”
In the
report, Delisle highlights Finland, which ranks first among the 35 countries
in government subsidies provided for tertiary education (international
equivalent to an associate degree or higher in the U.S.). Ninety-six percent
of Finland’s higher education resources are public, but its attainment rate
-- the proportion of citizens ages 25 to 34 with a degree beyond K-12
education -- is less than 45 percent, placing it 25th among OECD countries.
South Korea-based higher education, on the other hand, gets about 36 percent
of its funding from the government and achieves a 70 percent attainment
rate, the highest among OECD countries, according to the report.
The
U.S. ranks 31st for subsidies and third when it comes to institutional
resources, which is measured as the amount of money -- a combination of
government funds and private dollars -- spent on each full-time-equivalent
student. These numbers are also adjusted for a country’s GDP per capita, so
as not to penalize countries with smaller economies for spending less.
The
report praises more investment in higher education from government and
private sources as positive, suggesting that “generally, institutions with
greater resources have more latitude to offer a high-quality education.”
This could bring criticism from “our colleagues on the right” who prioritize
spending reductions, Delisle said.
“We
gave [spending] a positive spin, and we also gave attainment a positive
spin,” Delisle said. “There are definitely people on the right who would
say, ‘We have too many people with college degrees and spend too much on
higher education.’”
The
OECD includes subsidized student loan programs in its spending metrics, so
while governments in the U.S., U.K. and Australia are increasingly providing
loans and debt forgiveness, that’s not counted as public funding in the
report, Delisle said. Instead, student loans are considered individual
expenditures on tuition, though they could be paid off by these governments
in the future.
Loans
should be kept in mind when reading the report, Delisle said, but they don’t
have enough impact in the U.S. to shift the country’s ranking, since the
government uses more of a “safety net” model for specific groups of students
in need. But forgiven loans make up a higher share of Australia’s and the
U.K.’s subsidies, which can’t be seen in the OECD data, he said.
There
are other contextual differences between countries that are also absent from
data in the report, because these differences are vast and difficult to
measure, Delisle said. One variance -- countries’ typical age range for
college attainment -- could affect how the report is read, said Alex Usher,
president of Higher Education Strategy Associates.
While
the AEI report analyzes 25- to 34-year-olds who may or may not have degrees,
students in Nordic countries tend to start college later and often take
breaks from their learning to participate in the labor market, Usher said.
Additionally, Nordic countries have a lower wage premium for
college-educated adults than the U.S., he said.
“Those
countries tend to look fantastic when you look at adult education -- it’s
actually adults who are going back and forth and taking breaks” from higher
ed, Usher said. “Here, it’s normal at age 25 to have a degree. There, it’s
not so normal.”
Continued in article
Jensen Comment
Only the radical left in the USA would destroy a nations economy to give free
health care, free medicine, free college, guaranteed annual income etc. to
everybody who wants it. Combined with the green new deal and existing safety
nets the estimated cost is over $20 trillion per year. As Nancy Pelosi says: "
How do we pay for that?"
Bob Jensen's threads on Tertiary Education in the USA Versus Europe ---
http://faculty.trinity.edu/rjensen/HigherEdControversies.htm#Tertiar
**How to mislead with
statistics (definition of universal free education)
Tertiary education ---
http://en.wikipedia.org/wiki/Tertiary_education
Tertiary education, also referred to as third stage, third
level, and post-secondary education, is the educational level
following the completion of a school providing a
secondary education. The
World
Bank, for example, defines tertiary education as including universities
as well as institutions that teach specific capacities of higher learning
such as colleges, technical training institutes, community colleges, nursing
schools, research laboratories, centers of excellence, and distance learning
centers.[1]
Higher education is taken to include
undergraduate and
postgraduate education, while
vocational education and training beyond secondary education is known as
further education in the
United Kingdom, or
continuing education in the
United States.
Tertiary education generally culminates in the receipt of
certificates,
diplomas,
or
academic degrees.
NPR's Very Tentative Conclusions After One Year of the
Tennessee Promise Program
Five Free Semesters of Higher Education for Tennessee's High School Graduates ---
https://www.npr.org/sections/ed/2018/05/28/614435379/a-degree-with-zero-student-debt-does-it-work?elqTrackId=13fc85ae5732430b8f1156d7f288d64b&elq=71d1e243c95446b48809a4c5e3e15740&elqaid=19242&elqat=1&elqCampaignId=8748
Jensen Comment
This is not a benefit versus cost of the Tennessee Promise Program. In fairness
it will take more years of evaluation in terms of costs and benefits, and even
then human education is difficult to quantify for such an analysis. Also
experiments should be run with regard to other alternatives. Studies need to be
conducted regarding how well students in this program are performing later on in
higher education, especially performance of lower achievers. Are they
really prepared to ultimately be admitted by a flagship university or are they
finding jobs consistent with the level of their education?
No European or other nation to my knowledge comes anywhere
close to providing universal free higher education to lower achievers. In fact,
OCED nations like New Zealand, Finland, Norway, Denmark, France, Germany, etc.
do not offer 50% of Tier 2 graduates free training and/or education. Those
nations rely on the majority of Tier 2 graduates to get employer-funded training
that is much more intensive than such funding my USA employers ---
http://faculty.trinity.edu/rjensen/HigherEdControversies.htm#Tertiary
Especially note the OECD nations listed at
https://en.wikipedia.org/wiki/List_of_countries_by_tertiary_education_attainment
Turkey and Argentina provide free college education but competition get such a
free education "are fierce" ---
https://en.wikipedia.org/wiki/Free_education
Russia offers more widespread free education, but the Russian higher education
system is notoriously corrupt.
Tennessee and some other parts of the USA seem to be unique in
providing universal college education free to low achievers. Some might argue
that community college graduates from two-year programs are not really more
advanced on average than Tier 2 graduates in other OCED nations. I'm not quite
so cynical, but it would be interesting to know more about the competency level
of community college graduates having lower than 3.0 gpa records in the
Tennessee Promise Program after it is rolling well beyond the first year.
There are, of course, many free college credits (not usually
degrees) available in the USA
**How to mislead with statistics (definitions)
Applicants to Law Schools (Downward) Versus Medical Schools (Upward)
http://taxprof.typepad.com/taxprof_blog/2018/05/applications-to-law-school-versus-medical-school.html
Jensen Comment
Of course these are applicants and not admissions. In a given university I
suspect it's much more common for medical school applicants to be rejected. But
I did not research that question. Rejection rates are misleading. For example,
Harvard's first year rejection rate is not extremely high because so many
possible applicants give up Harvard hopes before they apply. I'm told that if
you're a good pre-med graduate and get rejected don't give up hope. Keep
studying and retaking the MCAT. The same is probably true for law student
rejections who are really good students.
**How to mislead with statistics (definitions)
None of Us Understands Probability ---
https://www.rcmalternatives.com/2018/06/none-of-us-understand-probability/
Jensen threads on mathematics, probability, and statistics
---
http://faculty.trinity.edu/rjensen/Bookbob2.htm#050421Mathematics
**How to Mislead With Statistics bias, definitions)
Dividends and Buybacks ---
http://aswathdamodaran.blogspot.com/2019/02/january-2019-data-update-8-dividends.html
Jensen Comment
Not only should accounting students know how to account for dividends and
buybacks, they should know how the two ways of getting cash to shareholders are
different and yet related.
I like this article as a quick and easy way to teach students about this
complicated issue.
Most of the political articles on buybacks are misleading, and
voters are easily misled by those political articles.
This, like a lot of academic articles, falls among those articles that
politicians would like to hide from the public. That's not very hard to do since
voters are not much interested in our research and messaging.
**How to Mislead With Statistics (definitions)
From a Chronicle of Higher Education Newsletter on February 14, 2018
A new report says
that students who attend for-profit
colleges are
outperformed on earnings and employment by other students in nearly every
category, and that many for-profit-college students would be better off not
attending college at all.
Jensen Comment
One of our sons went deeply in debt to get a business degree from a for-profit
university and is now saddled with repaying his student loans. He was a diesel
mechanic for Caterpillar before he started the online program and cannot find a
white collar job that pays better than his blue collar job. He's still a diesel
mechanic with Caterpillar.
His experience provides clues on why the above report may be misleading.
Firstly, many folks who attend for-profit colleges have some blue collar skills
that don't pay all that bad, and it's a myth that those graduates tend to do
better with white collar opportunities after graduating from college. Studies
indicating that going to college pays off are often comparing only those
students who got white collar jobs with blue collar workers. Those studies also
fail to mention that many college graduates (including those like our son) could
not find white collar jobs or they had to move to very high cost living areas to
find white collar work after earning college diplomas.
Also many graduates from for-profit colleges have other income such as those who
served in the military for 20+ years after high school receive lifetime pensions
and health care benefits during and after graduation from a for-profit
university. I don't think the above study partitioned "income" into components
that excluded "earnings" from pensions and investments.
Also there's a problem of defining "better off" with a college degree only in
terms of annual monetary earnings. We must always remind the public that being
"better off" from education also entails being "better off" in terms of a lot of
intangibles in life. Some graduates better appreciate poetry or reading blogs
of college professors. Many folks (think stay-at-home parents) want to take
college courses for reasons other than finding a job.
Given the many new online distance education alternatives from top non-profit
colleges and universities plus the thousands of free MOOCs from the most
prestigious universities in the world, I'm no longer an advocate of for-profit
certificate and degree alternatives except in cases where for-profit colleges
have unique programs not available elsewhere ---
http://faculty.trinity.edu/rjensen/Crossborder.htm
Each state awards a gold medal to the highest scoring CPA exam taker in that
state. I will never forget the year that a gold medal winner took only
for-profit correspondence courses back in the days before there were computers
and an Internet. Her only higher education opportunities in the rural part of
the world where she lived were to take correspondence courses.
Also for-profit colleges never reject any applicants, and on occasion there may
be a college applicant with such lousy credentials that the for-profit college
is the only alternative for a college degree. I did not research this, but I'm
certain there are many success stories out there about "dummies" who became
scholars in this manner. I know a successful nurse (now retired) who was
rejected by the Eastern Maine Medical Center nursing school in Bangor. She then
went to the local for-profit nursing program, and then proceeded into a fine
career in the EMMC where she was initially rejected for nursing school.
Lastly, there's a problem with attributing "success" to where you got your
college diploma 10 years earlier. Too many factors (including luck) intervene
between college graduation and the executive suite. Less than 25% of the hires
in international CPA firms ultimately become partners in those firms. I
sometimes scan the new partner listings of large CPA firms with an eye on where
they went to college. Prestige of an alma mater is usually a poor predictor of
being admitted to the partnership, although it is somewhat of a factor in
getting that first-job in an international CPA firm. There are just too many
other intervening variables over the years in the firm that affect becoming a
partner.
**How to Mislead With Statistics
So what's wrong with performance ranking systems in general?
Bob Jensen's answers are at
http://www.trinity.edu/rjensen/HigherEdControversies2.htm
**How
to Mislead With Statistics
The
US has become one of the lowest-taxed countries in the world. Here are the 6
other nations with the smallest tax burdens ---
https://markets.businessinsider.com/news/stocks/6-nations-smallest-tax-burdens-outside-us-ultra-low-tax-2019-12-1028748866#mexico-16-1-tax-rate1
Jensen
Comment
Talk about comparing Apples with Thistles
Some things just cannot be compared between nations --- things like poverty,
health care, and taxes. Poverty is tough because some people below the poverty
line in the USA live like the middle or even upper class in really poor nations
that have no comparable free education, Medicaid, food stamps, welfare, housing
subsidies, and a $2+ trillion underground economy that funds millions of people
in the USA ---
https://en.wikipedia.org/wiki/Gini_coefficient#Limitations
Health
care is tough because of differences in services timing and quality as well as a
myriad of other considerations. Some nations (think Canada and Germany) with
very basic government-funded health care plans also have private sector funding
for higher quality health care. Some nations have different policies on things
like simplified euthanasia of patients who want to die. An enormous cost of
Medicare and Medicaid in the USA is for patients who want to die. Some nations
spend far less than the USA trying to save pre-mature babies. Some nations
make it more difficult for the elderly to get funding for some medical services
like dialysis and very complicated surgeries like when Medicare paid for one of
my wife's 14-hour spine surgeries to break her back in three places and implant
rods.
Tax
comparisons between nations are almost impossible because of differences in
benefits that come with the taxes. In most of Europe, Canada, and some other
nations taxes cover health care and long-term nursing care, college and training
for some (such as the top 1/3 of high school graduates) and many other benefits
that are not included in taxes in the USA. If that funding is added to tax
revenues in the USA, the USA is no longer one of the "lowest-taxed countries of
the world."
One way
to see how tax comparisons differ greatly between nations is to compare payroll
taxes and benefits at
https://en.wikipedia.org/wiki/Payroll_tax
**How to Mislead With Rankings:
When Academic Research
Stops Being Relevant to the Outside World
Ranking Accounting Journals by Topical
Area and Methodology ---
Journal of Information Systems
Article Volume 33, Issue 2 (Summer 2019)
https://aaajournals.org/doi/full/10.2308/isys-51981
This paper presents rankings of
accounting journals disaggregated by topical area (AIS, audit, financial,
managerial, tax, and other) and methodology (analytical, archival,
experimental, and other). We find that only for the financial topical area
and archival methodology does the traditional top-3 characterization of the
best journals accurately describe what journals publish the most-cited work.
For all other topic areas and methodologies, the top-3 characterization does
not describe what journals publish the most-cited work. For only analytical
research does the traditional top-6 journal characterization accurately
describe what journals publish the most-cited work. In AIS, the traditional
top-3/-6 journals are even less representative, as only one traditional
top-3 journal is listed among the six journals publishing the most-cited AIS
work, and only three of the traditional top-6 journals are in this list. In
addition to creating journal rankings using citations, we create rankings
using a unique measure of the attention given by stakeholders outside of the
academy. With this measure we find similar results; the traditional top
journals are not publishing the articles that receive the most attention in
some topical areas. The results call into question whether individuals and
institutions should rely solely on the traditional top-3/-6 journal lists
for evaluating research productivity and impact.
The article itself has important citations on the limitations of
rankings based upon citations and the limitations of classifications of
multi-topic journals. I won't dwell on these.
The main limitations of the rankings is that with only a few
exceptions the articles published in all of these academic journals are not
validated by replication which in science would be considered absurd ---
http://faculty.trinity.edu/rjensen/TheoryTAR.htm
This is a set of prestigious academic accounting journals that
mostly cite articles by each other with no added consideration of their impact
on the accounting practitioners, business leaders, the financial press, or the
outside world (outside of accounting academics) world.
There's an enormous bias toward publishing articles with
equations as opposed to narratives.
There's virtually no recognition given to how
articles published in these journals changed the world apart from the world
of publishing in these journals. No attempt is made to detect the impact of any
article on the professional world.
Hermann Weyl born in Hamburg, Germany. He wrote,
"One may say that mathematics talks about the things which are of no concern to
men. Mathematics has the inhuman quality of starlight---brilliant, sharp, but
cold ... thus we are clearest where knowledge matters least: in mathematics,
especially number theory." ---
http://www-groups.dcs.st-and.ac.uk/~history/Biographies/Weyl.html
Also see Mathematical
Analytics in Plato's Cave
http://faculty.trinity.edu/rjensen/TheoryTAR.htm#Analytics
Robert Shiller ---
https://en.wikipedia.org/wiki/Robert_J._Shiller
Yale: Robert Shiller on the power of narratives
---
https://news.yale.edu/2019/11/04/robert-shiller-power-narratives
Jensen Comment
Among the most prestigious academic accounting journals narratives have been
virtually abandoned in favor of equations.
Jacinda Ardern ---
https://en.wikipedia.org/wiki/Jacinda_Ardern
Leadership Greatness
**How to Mislead by Comparing Apples to Oranges
New Zealand’s Prime Minister May Be the Most Effective Leader on the
Planet ---
https://www.theatlantic.com/politics/archive/2020/04/jacinda-ardern-new-zealand-leadership-coronavirus/610237/?utm_source=newsletter&utm_medium=email&utm_campaign=atlantic-weekly-newsletter&utm_content=20200419&silverid-ref=NTk4MzY1OTg0MzY5S0
Jensen Comment
Scholars know very well that leadership success varies greatly with time and
place. Churchill was what England needed in WW II but not what was needed after
the war. Herbert Hoover was not a good president of the USA 1929-1933 but may
have been a great president 1940-1948.
Jacinda Ardern’s leadership during the 2020 pandemic seems to be what New
Zealand needed, but would she be as effective when leading other nations after
the pandemic is ended?
Great leaders were at the right place at the right time. Lousy leaders were
either lousy leaders in general or more simply at the wrong place at the wrong
time.
Calling a leader great or lousy is also dependent upon performance criteria.
Is a military leader to be judged primarily upon successful strategies in time
of war or admiration by those under his command as they go down in defeat (think
Robert E. Lee).
Leadership must also be judged on the basis of a time interval such as
short-term versus long-term. For example, Castro had admirable success in
turning Cuba around in the first two decades following his revolution.
However, in the late 20th Century even Castro admitted that his economic miracle
was just not working, and now Cuba is returning to his hated capitalism.
I judge the economic performance of New Zealand in the 20th Century as
mediocre relative to Singapore. Jacinda Ardern’s leadership of New Zealand in
the 21st Century seems to be more of the same in terms of economics. She may be what's needed during a
pandemic, but I question whether she's the best choice when the lockdown is
lifted.
She may be effective when dividing up a small pie, but maybe she should
be judged by the size of the pie she bakes. New Zealand has 10 million sheep and
no Silicon Valley. Many old people would like to emigrate to New Zealand but the
smartest young poor people of the world prefer to emigrate to the USA rather than New
Zealand.
**How to Mislead With
Statistics
Explore the Full WSJ
Sustainable Management Ranking ---
https://www.wsj.com/articles/explore-the-full-wsj-sustainable-management-ranking-11602506733?mod=wsj_eng_sustainableJRemail
The Wall Street Journal’s list
of the top sustainably managed companies takes
a broad view of sustainability, assessing a company’s leadership and
governance practices for their ability to create value for shareholders over
the long term. The ranking was produced by the Journal’s environment, social
and governance research analysts, who assessed more than 5,500 publicly
traded businesses based on a range of sustainability metrics. View the full
methodology.
Jensen Comment
Sometimes you can have too much of a good thing. Each company was scored by
combining up to 165 company-reported data items. With so many variables, one or
a few of the very most important variables may get watered down in importance
with relatively minor variables. For example, imagine ranking professional
athletes on 165 health variables. The athlete with an inoperable brain tumor may
not seem so bad as long as 164 other health variables are amazing.
Also for most any variable its
importance may vary greatly with magnitude.
More importantly, some of the
variables may be highly interactive with other variables and with variables not
included in the study. In the case of sustainability some of the most important
variables are dependent upon highly unpredictable future happenings such as
having much of the operations close to a dangerous earthquake fault.
I grew suspicious of this
ranking when I noted that HP ranked very high with a 8/100 ranking, and Xerox
ranked relatively high with an 18/100 ranking. How sustainable are HP and Xerox
relative to Crown Holdings having a 93/100 ranking? Both HP and Xerox are
struggling with their current product lines and are seeking to diversify.
Royal Dutch Shell has a 33/100
ranking while Exxon and Chevron did not even make the top 100. It's not clear to
me that Royal Dutch Shell is that much more sustainable than Exxon and Chevron
that have billions in resources to diversify into alternative energies.
My main point is that with 165
predictor variables, the most important interactive combination variables can
get lost in the forest with so many trees.
**How to Mislead With Statistics
Ranking of State Economies ---
https://247wallst.com/special-report/2020/08/25/the-states-with-the-best-and-worst-economies-4/2/
01 Utah (best)
02 Idaho
03 Washington
04 Colorado
05 Washington
05 Maryland
06 Arizona
07 Nebraska
08 Oregon
09 Minnesota
10 Georgia
. . .
41 Rhode Island
42 New Jersey
43 Michigan
44 Alaska
45 Illinois
46 Delaware
47 West Virginia
48 Mississippi
49 New York
50 Louisiana (worst)
To determine the states with the best and worst
economies, 24/7 Wall St. ranked states based on an index comprising five
measures: GDP growth, job growth, unemployment rate, poverty rate, and the
bachelor’s degree attainment rate among adults. The average annual GDP
growth rate from Q1 2015 to Q1 2020 came from the Bureau of Economic
Analysis and was included in the index at full weight. The average annual
employment growth rate from June 2015 to June 2020 came from the Bureau of
Labor Statistics and was included in the index at full weight. The
seasonally-adjusted unemployment rate as of June 2020 also came from the BLS
and was included in the index at full weight. The share of adults living
below the poverty line came from the U.S. Census Bureau’s 2018 American
Community Survey and was included in the index at full weight.
In addition to the components in the index, we
considered additional state data. Real GDP and contributions to real GDP
growth by industry came from the BEA. Median household income, college
attainment rate, and the share of workers commuting outside of the state for
work came from the 2018 ACS. The affordability ratio of median home value to
median household income is a 24/7 Wall St. calculation based on ACS data.
Data on regional price parity, a measure of cost of living, came from the
BEA and is for 2018. Population change due to natural causes and net
migration from 2010 to 2019 came from the U.S. Census Bureau. All data are
for the most recent period available.
Continued in article
Jensen Comment
This is misleading in the sense that the ranking does not necessarily reflect
states with the greatest flexibility for changing their rankings. For example,
Delaware is a relatively low taxation state with no income tax. It has more
ability to raise its ranking than New York that, like Illinois, has taxed just
about everything to the maximum and has almost run out of options other than
begging for bailouts from Washington DC. There are also states in the middle
that are in more desperate needs for additional revenue than the bottom 10
states above. For example, California has been hit by both natural disasters
(think wild fires) and bad management (think of phasing out gas power plants too
quickly to avoid risk of electricity shortages that have very expensive
solutions). Oregon and Washington are at greater risk of expensive civil war
with entrenched Antifa factions.
The Jewish Express: A Brief History of
Antifa: Part I ---
https://www.jewishpress.com/indepth/opinions/a-brief-history-of-antifa-part-i/2020/06/14/
The Jewish Experess: A Brief History of
Antifa in the USA: Part II ---
https://www.jewishpress.com/indepth/opinions/a-brief-history-of-antifa-part-ii-antifa-in-the-united-states/2020/06/24/
**How to Mislead With Statistics
Here's how much every US
state (and Washington DC) pays its teachers and how much they spend on each
student ---
Click Here
Rank (Teacher
Salary Average. Spending Per Student)
01 New York ($87,543,
$24,040)
02 California ($84,649,
$12,498)
03 Massachusetts ($83,622 ,$17,058)
04 Washington, DC ($79,350,
$22,759)
05 Connecticut ($78,247,
$20,635)
06 New Jersey ($76,376,
$20,021)
07 Maryland ($73,444,
$14,762)
08 Washington ($72,965,
$12,995)
09 Alaska ($70,877,
$17,726)
10 Pennsylvania ($70,258,
$16,395)
...
42 Indiana ($51,508,
$10,262)
43 South Carolina ($51,485,
$10.856)
44 Missouri ($50,817,
$10,810)
45 Arizona ($50,381,
$8,329)
46 West Virginia ($50,238,
$11,334)
47 Louisiana ($50,217,
$11,452)
48 Arkansas ($49,822,
$10,139)
49 South Dakota ($49,220,
$10,073)
50 Florida ($48,800,
$9,346)
51 Mississippi ($45,192,
$8,935)
Jensen Comment
Broad generalizations are misleading. We might say that it costs about half as
much to live in Mississippi as in New York, but this is not entirely true
because it costs much more than double to live in New York City and much less
than double to live in Poughkeepsie, New York.
One might conclude that
southern states pay teachers a lot less, but why do South Dakota, Indiana, and
Arizona rank down among the low paying southern states? Some southern states
(think Georgia) are not in the bottom 10 in terms of average teacher salaries.
There are all sorts of statistical problems when dealing with average salaries
without considering dispersions around the mean. In New York for example the
salaries highly skewed upward by the immense number New York City high salaries,
These very high average salaries skew the state's mean upwards relative to what
it would be if New York City was taken out of the mean calculation.
There are also statistical
concerns about the spending per student numbers shown above.
There are many factors affecting spending per student. Vermont and Georgia at
ranks 17 and 18 have nearly identical average teacher salaries (about $61,000)
And yet Vermont's spending per student is a whopping $19,340 compared to
Georgia's spending per student at $10,810. This is due mostly to a policy of
allowing miniscule rural towns in Vermont to have their own unconsolidated
school districts. The Vermont joke is that some school districts have more
supervisory board members than the numbers of students in their very rural
schools. The good news is that the student/teacher ratio is very, very low in
Vermont while administrator/student ratios are also very high. This is probably
a very good thing from a pedagogical standpoint but a bad thing from an
accounting standpoint. It cost a lot extra to heat and maintain school buildings
for only a few students.
In Georgia school districts
tend to be more consolidated giving rise to a lower average spending per
student. Vermont could greatly lower its spending per student by consolidating
more districts, but this would also increase the student/teacher ratios and make
students be bussed relatively long distances across mountain passes in the
winter. New Hampshire at rank 19 spends less per student ($16,893) than Vermont
($19,340), but this is due in part to having a population of 1,400,000 compared
to Vermont's sparse 644,000 population over roughly the same land mass and
terrain. New Hampshire has more populated school districts due heavily to having
over twice as many residents in the state. This in turn is due to New
Hampshire's attraction of having no income tax and no sales tax, whereas Vermont
taxes everything it can think of to tax. One thing very high taxes do is keep
the population low.
The above type of reasoning
does not apply to all states. What Mississippi and Florida spend per student is
just plain miserable no matter how you look at it. But look at how much more New
York state spends per student relative to California. Go figure why New York
spends nearly twice as much per student!
My main point is that spending
per student is a very misleading number because there are so many heterogeneous
efficiencies and inefficiencies blended into that one number. In Vermont high
spending per student leads to very small numbers of students per teacher. But in
New York high spending per student is not generally such a good thing for
student/teacher ratios like high spending is in Vermont. Spending per student is
highly skewed by the cost of everything in New York City.
What Went Wrong With Academic Accounting Research?
http://faculty.trinity.edu/rjensen/theory01.htm#WhatWentWrong
The Bottom Line
As with so many disciplines academic research ceased being
relevant to the outside world --- like Political Science
Chronicle of Higher Education: How Political
Science Became Irrelevant
The field turned its back on the Beltway
https://www.chronicle.com/article/How-Political-Science-Became/245777?utm_source=cr&utm_medium=en&cid=cr
In a 2008 speech to the Association of
American Universities, the former Texas A&M University president and
then-Secretary of Defense Robert M. Gates declared that "we must again
embrace eggheads and ideas." He went on to recall the role of universities
as "vital centers of new research" during the Cold War. The late Thomas
Schelling would have agreed. The Harvard economist and Nobel laureate once
described "a wholly unprecedented ‘demand’ for the results of theoretical
work. … Unlike any other country … the United States had a government
permeable not only by academic ideas but by academic people."
Gates’s efforts to bridge the gap between Beltway and
ivory tower came at a time when it was growing wider, and indeed, that gap
has continued to grow in the years since. According to a Teaching, Research
& International Policy Project
survey,
a regular poll of international-relations scholars, very few believe they
should not contribute to policy making in some way. Yet a majority also
recognize that the state-of-the-art approaches of academic social science
are precisely those approaches that policy makers find least helpful. A
related poll of senior national-security decision-makers confirmed that, for
the most part, academic social science is not giving them what they want.
The problem, in a nutshell, is that
scholars increasingly privilege rigor over relevance. That has become
strikingly apparent in the subfield of international security (the part of
political science that once most successfully balanced those tensions), and
has now fully permeated political science as a whole. This skewed set of
intellectual priorities — and the field’s transition into a cult of the
irrelevant — is the unintended result of disciplinary professionalization.
The decreasing relevance of political science flies in
the face of a widespread and longstanding optimism about the compatibility
of rigorous social science and policy relevance that goes back to the
Progressive Era and the very dawn of modern American social science. One of
the most important figures in the early development of political science,
the University of Chicago’s Charles Merriam, epitomized the ambivalence
among political scientists as to whether what they did was "social science
as activism or technique," as the American-studies scholar Mark C. Smith put
it. Later, the growing tension between rigor and relevance would lead to
what David M. Ricci
termed
the "tragedy of political science": As the discipline sought to become more
scientific, in part to better address society’s ills, it became less
practically relevant.
When political scientists seek rigor, they
increasingly conflate it with the use of particular methods such as
statistics or formal modeling. The sociologist Leslie A. White
captured
that ethos as early as 1943:
We may thus gauge the ‘scientific-ness’
of a study by observing the extent to which it employs mathematics — the
more mathematics the more scientific the study. Physics is the most mature
of the sciences, and it is also the most mathematical. Sociology is the
least mature of the sciences and uses very little mathematics. To make
sociology scientific, therefore, we should make it mathematical.
Relevance, in contrast, is gauged by
whether scholarship contributes to the making of policy decisions.
That increasing tendency to embrace
methods and models for their own sake rather than because they can help us
answer substantively important questions is, I believe, a misstep for the
field. This trend is in part the result of the otherwise normal and
productive workings of science, but it is also reinforced by less legitimate
motives, particularly organizational self-interest and the particularities
of our intellectual culture.
While the use of statistics and formal models is not
by definition irrelevant, their edging out of qualitative approaches has
over time made the discipline less relevant to policy makers. Many pressing
policy questions are not readily amenable to the preferred methodological
tools of political scientists. Qualitative case studies most often produce
the research that policy makers need, and yet the field is moving away from
them.
Continued in article
Jensen Comment
This sounds so, so familiar. The same type of practitioner irrelevancy commenced
in the 1960s when when academic accounting became "accountics science" ---
About the time when The Accounting Review stopped
publishing submissions that did not have equations and practicing accountants
dropped out of the American Accounting Association and stopped subscribing to
academic accounting research journals.
An Analysis of the Contributions of The Accounting
Review Across 80 Years: 1926-2005 --- http://faculty.trinity.edu/rjensen/395wpTAR/Web/TAR395wp.htm
Co-authored with Jean Heck and forthcoming in the December 2007 edition of
the Accounting Historians Journal.
Unlike engineering, academic accounting research is no longer
a focal point of practicing accountants. If we gave a prize for academic
research discovery that changed the lives of the practicing profession who would
practitioners choose to honor for the findings?
The silence is deafening!
**How to Mislead With
Rankings
What Makes the People of Finland So Happy?
https://jborden.com/2020/03/21/what-makes-the-people-of-finland-so-happy/
Jensen Comment
Hi Jim,
There are some negatives from the standpoint of progressives. First, Finland
is a highly capitalist economy opposed to socialism. Second, Finland hates
diversity and quickly closed its borders to refugee immigration while such
immigration was causing troubles in neighboring Sweden. Immigrants that
sneaked into Finland were re-routed to the Swedish border. Finland across
the years has never welcomed immigration.
Third, Finland’s single-payer medical system has been deemed non-sustainable
and recently led to the overthrow of the government. Four, even before the
pandemic Finland had a relatively high rate of unemployment.
Five, like most wintry nations Finland has a problem with alcoholism. I was
once lecturing in Finland on May Day that is a celebration day, especially
among college students. The entire downtown area was closed to traffic, and
when I got up the next morning the streets were lined with fallen students
that were still passed out. The good news is that nobody drinks and drives
in Finland. Doing so leads to an automatic year in jail, although jail time
in Finland is more or less a discretionary come-and-go type of thing for
non-violent offenders.
Six, sex with partners is on the decline in Finland —
https://www.helsinkitimes.fi/finland/finland-news/domestic/14163-nationwide-sex-survey-findsincrease-in-masturbation-decrease-in-sex.html
Seven, unlike Denmark Finland is not a particularly welcoming nation when it
comes to tourists (strangers) on the streets. Finns tend to avoid eye
contact and making greetings even with one another unless they know each
other. My university hosts, however, were very warm and friendly. I was
invited into their homes for nightly dinners.
**How to Mislead With
Statistics
The Five Most Expensive
Countries in the World ---
https://qz.com/1867733/which-is-the-most-expensive-country-in-the-world/
The latest data, for 2017, demonstrate
the huge disparities in the cost of living between countries. Japan was five
times more expensive than Egypt. This means that the amount the average
Japanese person could buy was about three times more than the average
Egyptian. It’s still a big difference, but not as massive as it might appear
at first glance.
The most expensive country in the
world in 2017 was Bermuda, with prices about 105% above the global average.
Bermuda
was followed by Iceland, Norway, Switzerland, and the Cayman Islands.
These are all very rich countries,
where labor is costly, a major contributor to high prices. It is no
coincidence that three of the top five are islands, which makes importing
goods to these places extra expensive.
The least expensive countries were
poor nations like Eritrea (76% less expensive than average), Egypt (73%,)
and Ukraine (67%).
. . .
Generating price
statistics is not easy. The World Bank works with the statistical agencies
of each country to gather prices on a set of commonly
purchased goods across the world (pdf).
For example, data is
collected on the cost of rice, gas, TVs, and housing. The researchers’ goal
is to collect prices for similar types of goods of more or less the same
quality.
The measurement for the
overall price level of a country is not simply comparing a similar basket of
goods across all countries, but also accounts for what locals tend to buy.
People in China eat a lot of pork, so the price of pork plays a bigger role
than beef in determining China’s overall price level. The amount of any
product that is included in a price level calculation is determined by
examining surveys of household expenditures for that country.
The World Bank also
releases data on the price level by major product type. The data show that
not only do overall price levels vary across countries, but even within
countries, the price differences with the rest of the world fluctuate widely
depending on the product or service. For example, in the UK, the cost of
“transport” was 39% higher than the global average, but the cost of “food
and beverages” was only 7% higher. These differences are often due to
government policies, like trade barriers or business subsidies, that raise
or lower prices for industries. Generally though, prices tend to be
relatively higher in rich countries for goods and services that involve
a lot of labor,
like prices at restaurants and hotels, and relatively lower for commodities
like food and clothing.
The chart below shows the
relative costs of different product groups for the 30 most populous
countries in the world, and if you hover over a dot it will highlight the
cost of that good across all countries.
Continued in article
Jensen Comment
One of the huge problems in comparing cost of living is that items being
compared are not fungible, especially housing. For example, for an Egyptian
median-income homeowner to live like a median-income Swiss homeowner is
enormously expensive in Egypt because of the quality of housing available to
median income residents. There are also great differences in non-quantifiable
quality-of-life factors for home owners. A friend of mine who lived in Egypt
said one of the frustrations was noise at night that arises because so many
Egyptians are outdoors at all hours of the night to escape the heat. Night noise
is not so much a problem in Iceland, Norway, and Switzerland.
Variations in housing costs
vary within nations, and in some nations these variations are much greater than
in other nations. For example, the variation in housing costs in Iceland is much
lower than the variation in housing costs in the USA (think of housing costs in
San Francisco versus Topeka). Or think of variation in housing costs within
given cities like New York, Chicago, and San Antonio.
Transportation costs vary
greatly with geography. Japan is a relatively small nation with very efficient
public transportation. The USA, Russia, China, and India are relatively large
geographic nations where having public transportation everywhere like Japan has
public transportation everywhere is not economically feasible.
Taxes are difficult to compare
between nations. Some countries like Bermuda, Iceland, and Norway can divert
taxes to social services (think health care) since relatively little must be
spent on national defense. For whatever reason, the USA, Russia, India, and
China divert a much higher proportion of tax revenues into national defense
(think nuclear arms and air force spending alone).
There's an enormous problem is
comparing hugely different populations. Bermuda has a permanent population of
slightly over 70,000 residents making labor costs relatively high. Egypt has 100
million residents making labor costs relatively cheap.
I could go on and on, but I
suspect that by now you get the point.
**How to Mislead With Statistics
Here are the best colleges in America according to U.S. News & World
Report for 2019 ---
https://www.10news.com/news/national/here-are-the-best-colleges-in-america-according-to-u-s-news-world-report
Jensen Comment
What I have to say about best college rankings is ditto what I have to say below
about hardest colleges to get into. In mathematics we say that those many-to-one
transformations can be terribly misleading.
Hardest Colleges to Get Into in the USA
https://247wallst.com/special-report/2019/09/06/hardest-colleges-to-get-into/?utm_source=247WallStDailyNewsletter&utm_medium=email&utm_campaign=DailyNewsletter&utm_content=SEP102019a
Jensen Comment
I don't dispute the that the rankings are somewhat meaningful. What I dispute is
the ignoring of some of the criteria used for admissions --- often unique
combinations of criteria.
Admission to a prestigious university is a multivariate combination of
factors, and it's misleading to rank universities on a superficial subset of the
variables evaluated in the admissions process.
The first thing to do is to totally ignore the "acceptance ratio" criterion.
It costs money to apply to these universities. And most students across the USA
don't waste their time and money applying to colleges where they have little or
no chance of gaining acceptance. Hence, the denominator of an "acceptance ratio"
for Cal Tech or Harvard is misleading from get go due to self selection of what
schools a student tries to get into. The denominator may have much more meaning
for applicants to the Rank 50 university than to the Rank 1 university.
The second thing to do is to recognize that almost all (although not all)
applicants to schools like Cal Tech and Harvard have very high SAT scores plus
4.0 grade averages from their high schools. Cal Tech and Harvard need some other
criteria to pick the best from the best. And often those criteria are somewhat
unique and can't be easily compared. Purportedly, Marjory Stoneman Douglas High
School's David Hogg was did not have a stellar SAT score, but he was admitted to
Harvard for some other criteria not comparable with most other applicants ---
https://en.wikipedia.org/wiki/David_Hogg_(activist)
Many students are admitted to a prestigious university because of unique life
experiences that are both interesting and unlike experiences of other
applicants.
Those life experiences can't be quantifies in a ranking such as the one
above.
What's interesting to me is the unique qualifications of students who are
admitted to prestigious universities barely after reaching puberty (think 14
years old). What makes them so worthy of admission at such a young age.
A related question that I will probably never see answered is whether its
more common to flunk out of Cal Tech than Harvard among students that are really
trying to graduate and have no severe mental health issues. My priors are that
Harvard can be pretty easy once you're admitted, although there are exceptions
for certain disciplines that weaker students typically avoid.
One of my former girlfriends from decades ago was called to her chemistry
professor's office. He promised to give her a C in introductory physical
chemistry if she promised to change her major out of chemistry. She eventually
graduated in nursing.
**How to Mislead With Statistics
U.S. Funding for University Research Continues to Slide ---
https://itif.org/publications/2019/10/21/us-funding-university-research-continues-slide
The United States continues to fall further behind
world leaders in funding for university research. To reverse course, it
should increase support by $45 billion per year and provide stronger
incentives for businesses to increase their investments.
KEY TAKEAWAYS
Research
universities play a critical role in generating innovation-based economic
growth and driving U.S. global innovation leadership.
According to the
most recent OECD data, the United States has slid to 28th of 39 nations in
government funding for university research as a share of GDP, with the 12
leading governments investing more than double the U.S. investment.
Between 2011 and
2017, U.S. government funding for university research as a share of GDP fell
by nearly a quarter—0.06 percentage points. On average, nations decreased
0.03 percent of GDP during that time.
Congress should
commit to increasing university research support by $45 billion per year,
which would place the United States among the top seven nations in the world
in funding for university research.
Congress
should also expand the energy-related collaborative research and
experimentation tax credit to apply to any field of university research
investment—not just energy research—made by businesses.
Continued in article
Jensen Comment
How can these statistics possibly be misleading? One huge way is in failing
to count much of the research funding. For example, in the USA universities have
undergraduate and graduate business programs to a much larger extent than
colleges and universities in the rest of the world. Indeed the business college
on a USA campus is often the largest college on a university campus, especially
in most state-supported universities. There are also large humanities programs
such as modern languages. Whereas science and engineering colleges on campus
rely heavily on government and business research grants, the colleges of
business and humanities have few such grants counted in the above study as
"research." However, in colleges of business and humanities the tenure and
performances of faculty are heavily weighted on research performance. Over the
years teaching loads of upwards of five courses per semester dropped to two or
three courses per semester to support the research mission. In graduate schools
of business it is now common to only require one or two course preparations per
year. Plus most universities fund sabbatical leaves and summer research.
My point here is that in the USA much of the funding for business and
humanities research did not get counted in the above study. Faculty instead get
teaching relief and other university stipends that were overlooked in the above
study. In other parts of the world business education programs, if they exist at
all on campus, are part of science divisions (think economics) where government
research grants are more readily available than they are for business colleges
in the USA.
If research funding is so great in Switzerland, Norway, and Denmark why don't
the Chinese and Russians spend billions more trying to steal their research
relative to what is spent trying to steal the research of the USA?
Apart from university campuses, the above study ignores much of the research
taking place in business and government in the USA. The problem is that research
funding is confounded with funding of other job duties. The best example here is
product development in business firms where research is only part of the entire
heavily-funded total operation of product development. It's virtually impossible
to separate what part of product funding is development and what part is
comprised of other aspects of product development.
The above study ignores output volumes in terms of research publications of
the largest countries like the USA, China, and India. My hunch (strictly a guess
at this point) is that the USA, China, and India produce more research
publications than the rest of the world combined, although counting home
countries of authors gets complicated because of the rise in joint authorships
between USA authors and foreign authors.
The above study ignores funding of research facilities (link science,
medical, and computing laboratories in universities and business firms) where
the USA dominates.
If the other nations of the world are doing such a great job funding research
where are their new patents?
New Drug Patents by Country ---
https://www.americanactionforum.org/wp-content/uploads/2016/05/2016-05-17-Drug-Patents-Checkup.pdf
Over the past half century, the United States
has been the birthplace of the majority of the world’s biomedical
innovations.1 Despite a global slowdown in the development of new medical
interventions, due to the scientific shift towards more complex biologic
treatments, innovation in the U.S. has remained relatively steady thanks to
strong financial incentives to invest in research and development (R&D). In
fact, the below chart may underrepresent American contributions to
pharmacological breakthroughs in the past two decades as a result of U.S.
corporations relocating their headquarters to Switzerland and the U.K. to
take advantage of those countries’ lower corporate tax rates.
Jensen Comment
This does not justify some of the evil pricing schemes of big pharma in the USA,
especially pricing by patent trolls. But it does illustrate how complicated the
invention of biomedical innovations (that includes more than drugs) becomes,
especially when comparing the USA with the more highly populated European Union.
Why doesn't the EU lead in discovery of biomedical innovations? Why aren't
Russia and China inventing new biomedical innovations as fast as they are
inventing technology innovations?
I think that the highly defective and misleading ranking of nations on the
basis of research funding is secretly political in a subtle scare-tactic effort
to get lawmakers to greatly increase taxpayer funding of research in the USA. It
would be more meaningful if it did not leave out so much data on the total
funding of research in the USA.
**How to Mislead With Statistics
America's Best and Worst States for Taxes ---
https://finance.townhall.com/columnists/danieljmitchell/2019/10/24/americas-best-and-worst-states-for-taxes-n2555297?utm_source=thdaily&utm_medium=email&utm_campaign=nl&bcid=b16c6f948f297f77432f990d4411617f
The
combining of "taxes" can be misleading. For example, compare the above ranking
with the following ranking.
01 New Jersey
(highest taxes)
02 New York
03 California
04 Connecticut
05 Arkansas
06 Minnesota
07 Vermont
08 Maryland
09 Iowa
10 Louisiana
. . .
41 Indiana
42 Utah
43 Oregon
44 Nevada
45 New Hampshire
46 Montana
47 Florida
48 Alaska
49 South Dakota
50 Wyoming (lowest taxes)
Jensen Comment
There's no one state that's best or worst on all types of taxes. And even with
respect to one tax, the outcomes can be misleading. Take property taxes.
California is horrible for recent home buyers, but property taxes are relatively
low for long-time home owners because of Proposition 13 ---
https://en.wikipedia.org/wiki/1978_California_Proposition_13
And states that appear to be best
in terms of all taxes in the above ranking are among the worst for some types of
business taxes. And some taxes that are the highest taxation states often make
the best deals for attracting and keeping businesses with tax breaks and
subsidies --- Exhibit A is New York.;Exhibit B is New Jersey; and Exhibit C is
Illinois.
But the biggest problem lies in
how multiple tax burdens are aggregated across different taxpayers. Compare the
ranks above with the ranks below.
States with the highest, lowest state and local tax collections ---
https://taxfoundation.org/state-local-tax-collections-per-capita-2019/?fbclid=IwAR3zpltt_AMIquAps_TtHDDUk482ovmEqO9sU1jUu3GQX32Ttp-g1p4Amrs
01 New York
(highest taxes)
02 Connecticut
03 New Jersey
04 North Dakota
05 Hawaii
06 Massachusetts
07 Minnesota
08 California
09 Maryland
10 Vermont
. . .
41 Missouri
42 Georgia
43 Mississippi
44 Arizona
45 Idaho
46 Florida
47 Oklahoma
48 South Carolina
49 Tennessee
50 Alabama (lowest
taxes)
Jensen Comment
This is a classic case of ranking based upon averages that ignore sampling
distributions (particularly skewness), standard deviations, and outliers.
For example, Alabama supposedly offers the best tax deal, but not necessarily
if you make over $250,000 per year. Alabama has all types of taxes, including an
income tax. If you make over $250,000 per year you're probably better off in a
state without an income tax like Nevada or Florida. The problem is that Alabama
has a skewed distribution with lots of low income people who pay little or no
income tax. In comparison New York has a much higher proportion of very high
income people who pay lots and lots of income tax.
Wealthy people are fleeing high income tax states like New York and Vermont,
but not many are choosing to relocate in
Alabama because Alabama supposedly, according to the above article, offers the
best tax deal among all 50 states. That alone should tell you something is wrong
with the above ranking of states.
Taxation was a factor in my decision about where to retire, especially when
comparing high tax states like California, Wisconsin, Vermont, and Maine with
with relatively low taxing New Hampshire (that has no sales tax or income tax).
It's also hard to compare some types of taxes. California, for example, is
exceedingly difficult to evaluate in terms of property taxes without knowing the
context of the comparisons. If you've owned a big house in Palo Alto, California
for 40 years property taxes are not a killer because of Proposition 13 that
locks you into paying less than $25,000 per year. However, if you sell your
house the buyer may have to pay way over $250,000 per year in property taxes on
that same house.
Even outside California property taxes are much different than income taxes
and sales taxes. For example, I pay relatively high property taxes on my
four-acre home site in New Hampshire. However, I hope to get some of those taxes
returned if and when I elect to sell the property. However, there would be no
return of sales and state income taxes if New Hampshire had taxes on sales and
incomes.
This is something I considered when I chose to
retire in New Hampshire. But. given my level of retirement income I
would never consider buying a house in Palo Alto after retiring from my job in
Texas. I could not afford to pay property taxes of $250,000+ per year even if
one day in the future some of those taxes were returned in the selling price of
my Palo Alto house.
**How
to Mislead With Statistics
The
20 cities in the Northeast that Americans are escaping (from)
in droves (2010-2018) ---
https://www.businessinsider.com/cities-in-the-northeast-americans-are-fleeing
Jensen
Comment
There were 9/20 losing cities in New York, followed by 4/20 from New Jersey, and
3/20 from Pennsylvania, 3/20 From Connecticut, and 1/20 from Maine.
Those
four states are the only ones in the Top 20 out of 14 states generally
considered in the Northeast ---
https://en.wikipedia.org/wiki/Northeastern_United_States
What's
causing the exodus?
We might look at taxes, but the high taxing states of Massachusetts and Vermont
are not included in the Top 20 above.
We might look at climate, but the too many of the coldest states are not
included in the Top 20.
We
might look at fiscal mismanagement in state government since New Jersey,
Connecticut, and Pennsylvania are hit hard, but this leaves out badly mismanaged
Rhode Island and some other states with relatively poor fiscal management.
Besides this is a ranking of cities rather than states.
The cities in the Top 20 are so varied in terms of size and crime rates, I don't
think crime is the underlying issue here.
I think
that one underlying issue is such a wide variation in population of these
cities. The New York metro area has nearly 20 million people whereas
Lewiston-Auburn in Maine barely has 100,000 people with some of the other cities
having less than 200,000. Yeah, I know the ranking is based upon the proportion
of exiting population, but nevertheless comparing a giant pumpkin (NYC) to a
raison (Lewiston-Auburn) raises some other issues.
The
problem with including very small cities in the above rankings is that a random
event can dominate small town population loss more than cities with millions of
people. Lewiston and Auburn in Maine was were dead mill towns (think shoes) long
before 2010 ---
https://en.wikipedia.org/wiki/Lewiston,_Maine
In 1999, partly due to low-cost empty houses in Lewiston, the government located
12,000+ refugees from Somalia. These newer residents started a relatively large
number of retail shops, but Lewiston was already a relatively lousy place to
locate new retail shops. The bottom line is that the shops have not prospered
and many Somalis moved elsewhere 2010-2018.
My
point is that population spurts and losses are likely to be affected by a random
event in a small town more than population spurts and losses in cities with
millions of people. We should not be comparing raisins with pumpkins.
**How to mislead with statistics
There Are 79 Jobs With Six Figure Salaries ----
https://247wallst.com/special-report/2019/08/06/there-are-79-jobs-with-six-figure-salaries-2/9/
Jensen Comment
This is among the most misleading rankings I've ever seen.
Firstly, many of the professionals included in the rankings don't have "jobs"
that pay salaries. They are business owners who rely on profits rather than
salaries. Thinks of surgeons who have their own offices, nurses, physician
assistants, receptionists, accountants, etc. They have many expenses, especially
malpractice insurance policies and claims pay out.
Secondly, many have profit sharing and bonus plans that are almost impossible
to predict above and beyond salaries included in this study.
Thirdly, these are averages with enormous standard deviations and skewed
distributions. For example, college professor salaries and physician assistant
salaries are truncated much lower than salaries of lawyers and brain surgeons.
Fourthly, the jobs vary greatly in terms of benefits. College presidents for
example get free housing, huge expense allowances, cars, etc.
Fifthly, salaries are cover varying parts of the year. Professors, for
example, are included in this study at their nine-month base. Those same
professors get added salaries for summer teaching, research, book royalties,
consulting, patent royalties, etc.
Sixthly, some jobs are conducive to added compensation, particularly outside
consulting, book writing, speeches, musical performances, etc.
The bottom line is that these rankings are mostly garbage and very misleading
for career aspirants.
**How
to Mislead With Statistics
Ranking 46 States by in a Different Kind of Way in Terms of Numbers of
Regulatory Restrictions (enough red tape to reach the moon and back)
https://www.nationalreview.com/2019/10/government-regulation-new-numerical-measure-ranks-states/
Jensen
Comment
This is an innovative attempt to rank states on the complicated topic of
regulation. The problem is that a given regulation can be long and complicated
or short and sweet. Further more a a relatively short regulation (e.g., Thou
shall not kill) can be extremely complicated in terms of legal, religious, and
ethical complications that more complicated regulations (e.g., the Federal Tax
Code) seek to clarify.
The
main take away is that the most populated states have the most regulatory red
tape --- which is hardly surprising. For example, it's not surprising that New
York has very complicated regulations regarding securities transaction. Is it
surprising in a state that contains the New York Stock Exchange? It's not
surprising that those states also have by far the most lawyers, accountants,
police enforcers, and state regulators.
Some
states (think California) have made voting extremely complicated by putting so
many complex regulatory referendums on ballots. Both people who can and cannot
read are led like lemmings by biased media outlets and wealthy lobbyists. Often
regulations are exact opposites of theire written titles.
A friend (now deceased) living in Dallas became relatively
wealthy by veering from an accounting career to a career in regulation
compliance ---
http://www.willyancey.com/
He claimed that this was a better career path for him than accountancy. His
specialty was a niche in stratified sampling.
Compliance Training ---
https://en.wikipedia.org/wiki/Compliance_training
**How to Mislead With Statistics
Ranking of Cities Where Your Car is Most Likely to Be Stolen ---
https://247wallst.com/special-report/2019/10/17/your-car-is-most-likely-to-be-stolen-in-these-cities/2/
Ranking of States Where Your Car is Most Likely to be Stolen ---
https://247wallst.com/autos/2016/11/08/states-where-your-car-is-most-and-least-likely-to-be-stolen/
Jensen Comment
It's not that the rankings of car theft by cities and states are not similar;
It's just that there are some inconsistencies. First is that all states along
the border with Mexico are in the Top 10 states most likely to have your car
stolen, including Texas. And yet none ot the largest cities in Texas (Dallas,
Houston, and San Antonio) even made the ranking of cities high in car thefts.
This is surprising after I lived for 24 years in San Antonio. I know that car
theft is very high in San Antonio and that stolen cars are often in Mexico
before owners even know their cars are missing. Stolen cars often either end up
on Mexico or they pass through Mexico on the way to Belize that has an economy
built on stolen cars.
Why is car theft more likely in Denver, Seattle, Billings, and Wichita than
it is in Dallas, Houston, or San Antonio?
Of course there are some similarities in these rankings of states and cities.
Many California cities are high car theft cities, and California is on the
Mexico border. And the Number 1 car theft city, Albuquerque, is in New Mexico
that's on the border with Mexico.
The rankings also raise unanswered questions. Why is car theft so high in
Utah and Washington State? Is this a statistical quirk that makes theft rate
differences between ranked cities somewhat insignificant.
I do realize that there are many reasons cars stolen, including for temporary
car theft for joy rides and get-away cars connected to crimes. Cars are also
permanently stolen stolen for export (think Mexico) and chop shops (for parts).
I would expect some poverty states (think Mississippi) to rank higher in car
theft rates.
During economic downturns owners sometimes encourage thefts for the insurance
money. During an economic downturn in San Antonio when some high income people
lost their jobs and could no longer make payments on their loans for luxury
cars. Their expensive cars were sometimes parked on the south side of town with
the keys left in the ignition by owners hoping to recover more insurance money
than the balance due on their car loans
**How to Mislead With Statistics
What's the Best State for Teachers?
http://blogs.edweek.org/teachers/teaching_now/2019/09/whats_the_best_state_for_teachers_this_years_answer_might_surprise_you.html?cmp=eml-enl-eu-news2-rm&M=58940204&U=2290378&UUID=b16c6f948f297f77432f990d4411617f
Seeking
a stable teacher salary and a healthy work environment? A new analysis
suggests heading north.
This
year, North Dakota took first place in personal finance site WalletHub's
annual ranking of the best and worst states to be a teacher.
The
other states (after North Dakota) rounding out the top five spots this
year?
·
New Jersey
·
Pennsylvania
·
Wyoming
·
Connecticut
The
ranking is based mostly on what the website calls "opportunity and
competition"—factors including the average salary and starting pay for
teachers, potential for income growth over the course of a career, pension,
tenure protections, and job competition in the state. Scores on these
metrics make up 70 percent of a state's rating.
The
other 30 percent comes from measures of a teacher's work environment and
quality of life. These categories cover things like per-pupil spending and
teacher-student ratio, but also union strength, commute time, and how
supported teachers feel in their jobs.
To
calculate these scores, WalletHub uses census data, federal education data,
and data from the National Education Association, the National Council on
Teacher Quality, the Learning Policy Institute, and The Thomas B. Fordham
Institute, among other sources. A few of the measures are taken from some of
WalletHub's other state ranking lists, like statewide school quality and how
friendly states are to working moms.
Continued in article
The worst
states are New Hampshire at rank 50/51 and and Arizona at rank 51/51.
Jensen Comment
These rankings are misleading for various reasons. First and foremost is cost of
living (think housing costs). When renting or buying homes, teacher salaries
don't go far in very high living cost states of Connecticut and New Jersey. The
ranking in the above study seemingly ignored differences between states in terms
of "affordability" where the Midwest (think Iowa and Ohio) win out ---
https://www.usnews.com/news/best-states/rankings/opportunity/affordability
Anecdotally, we have a teacher who moved to New Hampshire from New Jersey
because she was seeking a higher quality students and better deals in housing
quality for the money.
Secondly, the "Report Card" for for schools
ranks New Hampshire at Rank 8 way above its Rank 50 of being "Best State
for Teachers." This alone should tell us that something is misleading in these
sets of rankings
https://networkforpubliceducation.org/wp-content/uploads/2016/01/NPE-Report-Card-Smaller.pdf
My opinion is that New Hampshire has no trouble attracting relatively very high
quality teachers in the Granite State's K-12 schools. The State is doing
something right to attract school teachers as well as retirees.
Thirdly, the rankings illustrate a problem when there are
too many ranking criteria. For example, one criterion in the "Best State for
Teachers" ranking is "pension" protection. What a joke in those rankings since
teacher pensions are in worse trouble in Connecticut and New Jersey relative to
pension protections in most other states. Connecticut in particular is in deep
trouble with badly under funded pensions ---
https://www.statedatalab.org/news/detail/connecticut-retiree-health-care-severely-underfunded
New Jersey's Finances are the Worst in the USA
---
https://www.truthinaccounting.org/news/detail/new-jerseys-finances-are-the-worst-in-the-us
The problem is that with so many other criteria in the
ranking formula, pension protections have very little impact on the rankings
My main point is that rankings should always be
questioned in terms of what (and how many) variables are included versus what
(and how many) variables are excluded.
**How to Mislead With Statistics
Here's how much money doctors across the US make ---
https://www.businessinsider.com/how-much-money-do-doctors-make-gender-pay-gap-doximity-study-2019-3
Jensen Comment
This article is a great example of how statistical reports can be misleading if
they only focus on mean averages without added information about standard
deviations and skewness and missing variables. For example, consider
neurosurgery. My wife's spine surgeon in Boston is what he calls a "big-back"
surgeon. He performs spinal surgeries that 95+% of the back surgeons in the USA
refuse to perform. He actually broke Erika's spine into three pieces and then
attached four rods from her hips to her neck. Afterwards, however, she can still
pick up a tissue off of the floor when bending her spine. Needless to say his
rates, sometimes exceeding tens of thousands of dollars per surgery, are greater
than the rates of "little-back" surgeons who also work out his office. By the
way, he's not on the faculty of the Harvard Medical School. However, every time
I've spoken with him he was followed by two or three Harvard Medical School
neurosurgery residency physicians who were what I called his "puppies."
By the way, it might be interesting to study details of his malpractice
insurance premiums and lawsuits. He's amazing because he has the guts to be a
"last-chance" neurosurgeon in spite of the circling lawyers. By last chance I
mean when patients can no longer find a neurosurgeon who will operate on their
spines he's their "last chance." Erika had over a dozen spine surgeries before
she at last found this "big-back" surgeon in Boston.
There are also many other troubles with the above article. For example,
malpractice insurance is very high priced in the USA relative to all other
nations. And malpractice insurance costs vary greatly with specialties such as
being very high for obstetrics (lawyers sue for every bad baby) versus
neurosurgery versus psychiatry versus primary care physicians.
Let's consider an example. According to the study the average pay for a
neurosurgeon is $617,000. But that does not account for differences in whether
that salary is net of malpractice insurance premiums. Such netting out is
complicated because many neurosurgeons make this much or much more without
having to pay malpractice insurance premiums. My wife's spine surgeon who
installed her morphine pump is an employee of the Dartmouth Hitchcock
Medical Center that pays malpractice insurance for virtually all employees and
medical school faculty. However, many neurosurgeons who operate in that same
medical center are not employees and must pay their own malpractice insurance.
Similarly, there's a nearby Veterans Hospital where VA neurosurgeons do not have
to pay their own malpractice insurance. But if the VA has to outsource a
particular type of surgery that surgeon's bill to the VA will include
malpractice insurance.
Incomes of many specialists vary when they must pay for their own staff
versus have no expenses for staff. For example, the Dartmouth Hitchcock Medical
Center pays for all staff such as receptionists, nurses, technicians,
accountants, etc. It even pays for lawyers when needed. The
private-practice physicians who may also perform surgeries at this medical
center must pay for their own office space and staff. How do you compare a
salaried employee of that medical center with the profits of a private-practice
physician?
I might point out a political problem related to all of this. There's an old
saying: "Show me a bad doctor, and I'll show you a rich professional." The
point is that even at the lowest end of the income distribution medical doctors
in the USA are well paid.
The Democratic candidates for the 2020 presidential nomination have created a
paradox.
Most, not all, students are drawn to medical school in anticipation of
relatively high after-tax incomes. The
politicians advocating Medicare-for-All want to fund this $30+ trillion cost
with greatly increased taxes (think 70% of a physician's income). At the same
time more than twice as many physicians will be needed to staff
Medicare-for-All. Eventually, the progressives will also legislate free medical
school education. But how many students will flock to medical schools even if
they are free? My guess is very few if you are gong to tax away 70% of their
income when they at long last begin to practice medicine.
The problem with becoming a physician is not just the cost of
medical school. The problem is the ordeal --- those years of education and
training needed to become masters of their crafts. The time needed varies with
specialties, but you don't become a neurosurgeon without years of ordeal in
training before you can bill your first paying patient. And there's a lot of
blood, sweat, and tears in those training years. Even worse is that there's a
lot of weekly tension and risk of burn out in the years of practice that follow.
Tell that to the advocates of Medicare-for-All combined with soaring taxes.!
If you want to double the number of physicians in the USA you not only have
to make medical school free; You have to let them be the highest paid
professionals on average after taxes.
PS
You can read more about Erika's ordeal with pain and surgeries at
http://www.cs.trinity.edu/rjensen/Tidbits/ErikaBob/ErikaPain/Set01/Set01.htm
I might add that the electronic pain stimulator installed eventually proved to
be worthless. The same surgeon who installed it removed it and replaced it with
a morphine pump. The pump is no magic bullet, but its more effective than the
electronic wiring up and down her spine
**How to Mislead With
Statistics
Here's how much surgeons, lawyers, and 20 other top-earning professionals
make per hour
https://www.businessinsider.com/hourly-salaries-surgeons-lawyers-2016-9
Jensen Comment
There many ways such analyses are (and rankings) are misleading. For example,
surgeons are shown (on average) to make less per hour than anesthesiologists.
I'm not sure you can even compare the hourly wages of these two types of
professions unless you factor in the added time surgeons spend in pre-surgery
office visits and post surgery visits both in the hospital and in the surgeon's
office. Then there's the added time surgeons give to studying how they're going
to perform complicated surgeries. And there's the added costs that many surgeons
have for office space, office nurses, receptionists, accountants, etc.
Anesthesiologists are often given free hospital offices and nurses and other
assistants.
Then there's the problem of factoring in investment of time and expense of
becoming physicians relative to other workers like restaurant dishwashers and
taxi drivers.
It's hard to compare lawyer hourly wages with many other professions since
lawyers invest heavily in professional services of others to conduct basic
investigations (think of what Perry Mason invested in his investigators), legal
aids who conduct legal research on cases, travel time where trips may be partly
professional and partly personal. And lawyers are often paid based upon
contingencies such as jury awards that withstand changes in appellate courts.
Many are also paid on profit sharing formulas in their firms.
Probably the most difficult profession to evaluate by hourly wages are
professors who devote so much of their time to become scholars in general and
researchers building and maintaining reputations in addition to teaching and
both internal and external services.
Add to this the usual problems of comparing averages is misleading without
also comparing standard deviations, skewness (the word kurtosis sounds smarter),
impact of outliers, etc.
The bottom line is that when comparing incomes of most all types of
professionals, reducing the comparison metrics to hourly wages is probably more
misleading than helpful.
**How to Mislead With Statistics
The Most Expensive Colleges That Paid Off the Least ---
https://247wallst.com/special-report/2019/08/21/most-expensive-colleges-that-pay-off-the-least/?utm_source=247WallStDailyNewsletter&utm_medium=email&utm_campaign=DailyNewsletter&utm_content=AUG222019a
Jensen Comment
The major deception here is that salary outcomes of graduates are not as
important to many (not all) of the colleges being ranked in this article.
Generally students go to music conservatories and art institutes to become good
at their crafts knowing full well that their crafts are not likely to great
money makers.
There are some colleges on this list where the median earnings criterion is a
somewhat better criterion (think Southern New Hampshire University). However,
medians suffer from the usual limitations unless we have additional information
on standard deviations and skewness. It could be that the medians (like
averages) are being pulled down by low performers in life. This, in turn, begs
the question of why there are so many low performers? One answer might be the
admission of a serious number of students with poor prospects of job
performance. In another study we might list rank those expensive colleges that
paid off the best, and get the Ivy League schools plus Stanford, Chicago, etc.
But the admission standards are so high to those universities that if those same
students would probably do about as well graduating from the University of
Southern New Hampshire.
The University of Southern New Hampshire is not unlike a lot of other
universities and colleges on this list that accept applicants with low
qualifications. The USNH made the list largely because it is also one of the
most expensive schools admitting lower quality students.
**How to mislead with statistics (rankings, definitions)
Worst Companies to Work For ---
https://247wallst.com/special-report/2018/06/07/worst-companies-to-work-for/
Jensen Comment
This is misleading in the sense that types of employees differ in organizations.
For example, a university might be stingy with pay and benefits to adjunct
faculty while doing quite well for tenured faculty. An airline might be highly
rated by its pilots and mechanics but not so hot by its ticket agents. My wife
says in the old days hospitals treated nurses like dirt while laying down red
carpets for physicians, including ill-tempered physicians who were arrogant and
rude to hospital staff. I think that in this era of multi-million dollar
lawsuits hospitals and physicians are now more courteous to staff. Even before
the #MeToo craze, lawsuits took its toll on sexual harassment. Still, lingering
sexual harassment in the work place varies by industry --- temptations are
greater in film making, hospitals, airlines, and colleges relative to oil
drilling and road construction. Affirmative action greatly increased sexual
harassment risks in some industries. When I was on a battleship there were only
2,600 men on board. Being a woman today on a Navy ship expanded employment
opportunities and sexual harassment risks simultaneously. The military does not
have a good record to date in preventing sexual abuse, but risks vary greatly
among assignments.
**How to Mislead With Statistics
32 Worst Cities to Find a Job for Recent Graduates ---
https://247wallst.com/special-report/2019/08/27/32-worst-cities-to-find-a-job-for-recent-graduates/
Jensen Comment
Of course Auburn, AL is going to be flooded with job applications from
recent graduates relative to Asheville, NC.
The best way to mislead is to ignore distortions in sampling populations. It
would seem that communities where jobs are most difficult to find are university
towns flooded with recent graduates every semester. Firstly, recent graduates
are not always ready to leave the towns where they graduate. Exhibit A is
comprised of graduates whose spouses/partners are still enrolled in the
universities. School districts in university towns are usually much higher rates
of teacher applications than average communities, especially when the university
town are relatively small compared to where urban universities are located.
Recent graduates also generally like living in the university communities where
they graduated. The bottom line is that university small and medium sized towns
are not at all typical of small and medium sized towns in general.
Secondly, the largest employers of recent graduates are seldom located in or
even near small and medium sized towns where large universities are located. For
example, recent accounting graduates generally most often are seeking to start
their careers with largest CPA firms in order to get training, experience, and
client exposure. But those largest firms seldom have offices in small and medium
sized university towns. Those small CPA firms that are located in university
towns are usually flooded with applications from new accounting graduates not
wanting to leave town,
**How to mislead with statistics and rankings
The Worst Jobs in America ---
https://247wallst.com/special-report/2019/04/18/the-worst-jobs-in-america/6/
Jensen Comment
This is a perfect example of missing variables, especially focus of pay without
examining benefits. For example, enlisting in the military is ranked as the
fifth worst job in the USA. Granted the job entails danger and stress in combat
zones with low pay. However, only a small proportion of enlisted military end up
in combat zones. What the article fails to mention are the great benefits such
as retirement pay for life after 20-30 years, often with great job skills
because of the free training and experience from pilot training to computer
skills to medical training. Not mentioned is free college education even for
those who only serve four years. Not mentioned is the possible free medical
insurance for yourself and your spouse for an entire lifetime without having to
wait for Medicare.
This is another one of those highly misleading rankings in other respects.
Think about it for a minute. Many 18-year old high school graduates go into the
military and retire with a pension, job skills, and free medical insurance for
life after they retire at the relatively young age of 38. That's not to say
their aren't drawbacks. Although most enlisted personnel do not end up in combat
zones, most end up with lots and travel and job relocations that are tough on
young families.
**How to Mislead With Statistics (rankings)
Yahoo Finance MAP: The most and least tax-friendly states ---
https://finance.yahoo.com/news/map-least-tax-friendly-states-144250362.html
Jensen Comment
It's somewhat misleading compare states by aggregating their taxes. The main
problem is all the variations in tax breaks and exclusions. Sales taxes are not
equal in terms of products that have exemptions and states that have sales tax
holidays. California has the infamous Proposition 13 on property taxes, but
other states have somewhat similar, albeit more limited, exclusions. For
example, Bexar County (think San Antonio) gives seniors a limited property tax
break on school district taxes. New Hampshire has no general income tax but has
a sneaky tax on cash dividends and interest (that are not not part of retirement
plans) after a $5,000 exemption. New York has a 10-year income tax exemption for
executives whose companies partner with universities in research.
**How to Mislead With Statistics
Where you will pay the most in electric bills ---
https://247wallst.com/special-report/2019/07/03/where-youll-pay-the-most-in-electric-bills-4/?utm_source=247WallStDailyNewsletter&utm_medium=email&utm_campaign=DailyNewsletter&utm_content=JUL082019a
Jensen Comment
The statistics themselves aren't so misleading, but what is misleading is power
use variability. For example, here in New Hampshire we heat mainly with fuel
oil, and on July 8, 2019 our furnace is still kicking in nights. We have
electric air conditioning for cooling that we use very little. When we lived for
24 years in Texas our heating bills were very low, but our electric bills were
enormous due to air conditioning. Hence our electric rates are very high in New
Hampshire, but we use much less electricity in New Hampshire. Of course now
there are a number of ways across the nation to save on electric bills (think
solar), but it takes years to overcome the relatively large fixed cost for solar
energy.
Up here in New Hampshire there are various ways to cut back on heating costs,
particularly if you have your own wood lot and split your own firewood for wood
stoves and furnaces (decorative fireplaces are not very efficient). You don't
save much if you have to buy wood that's ready for the fire.
My point is that in places where electricity rates are high (think Alaska and
New Hampshire) there are alternatives for using less electricity. Life is not
quite so cool in the south, but new and better ways of generating electricity
are being advanced every year.
How to Mislead With Statistics
Worst Car Brands of 2019 ---
https://247wallst.com/special-report/2019/07/17/worst-car-brands-of-2019/?utm_source=247WallStDailyNewsletter&utm_medium=email&utm_campaign=DailyNewsletter&utm_content=JUL182019a
01 Land Rover (worst of worst)
02 Jaguar
03 Fiat
04 Volvo
05 Mitsubishi
06 Chrysler
07 Dodge
08 Jeep
09 GMC
10 Cadillac (best of the worst)
Jensen Comment
I leave it up to you to read the criteria for this ranking, which is mainly
associated with "dependability." But "dependability" itself is a multivariate
attribute. For example, up in the snow country Jeep is horribly prone to rust
and deterioration from road salt. This is not a "dependability" concern in
Arizona. However, Jeep has some other flaws that are nationwide such as a high
failure rate in the differential.
Also there is a variation between long-run dependability versus short-run
dependability. In the short run there can be cars that are prone to little
things going wrong when they are new. Then there are those those things (like
built-in obsolescence) that makes you wnat to dump a Jeep or Land Rover every
three years or less but make you sort of like the long-term mileage expectation
of you Volvo.
In any case rankings like this are misleading because they ignore standard
deviations, skewness, variable driving climates (Arizona versus Maine), type of
roads (on a ranch versus on an interstate highway), etc. People don't usually
buy a Jeep or a Land Rover if they expect to use it mainly for interstate
highway driving. People don't buy a Jaguar or Cadillac to haul hay to cows in
the north pasture or get into remote fishing sites in Quebec forests. A sleek
Jaguar may be the best car to park beside a singles bar when compared to a Dodge
van often used to haul your kids to movies on week ends.
My point here is that ranking generally ends up to being analogous to a
many-to-one aggregation that is subject to all sorts of misleading outcomes in
mathematics and statistics.
The real test of a ranking might be to park the most expensive model of each
of the 10 brands listed above in a Laredo parking lot near the bridge to Mexico.
Leave the keys in each car and see which is the first to disappear versus the
last one to disappear. Perform this experiment 30 days in a row. My guess is
that you will get a quite different ranking with Fiat last to go. But then this
experiment is misleading as well since the brands vary so greatly in price. Car
thieves are after resale value, not dependability.
When I buy a car I usually want a dealer to be within a 30 mile distance of
my home. That way I don't have to pay to have it hauled so far when it won't
run. You guessed it. I would never buy a Tesla, because there are no Tesla
dealers.
**How to Mislead With Statistics
RANKED: Every state in the USA by the strength of their public education
system ---
https://www.businessinsider.com/us-states-public-education-system-ranked-us-news-world-report-2019-4
Jensen Comment
When performance is a multivariate phenomenon, virtually all rankings can be
misleading. because of arbitrary weightings of criteria (e.g., graduation rates
versus college admission scores versus education of handicapped students).
Having said this there are some notable outcome among the Top 10 states out
of 50 states in the above study.
Firstly, we might note that three states without income taxes made the Top 10
(Florida, New Hampshire, and Washington). However some states that tax
everything imaginable also made the Top 10 (e.g., Taxachusetts, New Jersey, and
Vermont).
Secondly, we might note that some states in the Top 10 are mostly white with
little diversity (e.g., Vermont and New Hampshire). However, some states in the
Top 10 have a lot of diversity (e.g., Florida, New Jersey, and Massachusetts).
Whitish states like Wyoming, Montana, and North Dakota did not make the Top 10.
Very diverse states like California and New York did not
make the Top 10.
Thirdly, states with the USA's largest cities tended not to make the Top 10.
School performances in Chicago, Atlanta, Los Angeles, Dallas, Houston, .New York
City, Detroit, St. Louis, Phoenix, San Antonio, etc. probably tended to pull
their state averages downward. However, there were exceptions for Boston, Miami,
and Omaha.
Heavily Hispanic states like Texas, New Mexico, Arizona, and California
struggle with graduation rates. However, Florida appears to be an outlier in
this regard.
Poverty hurts as evidenced by performance of West Virginia, Mississippi,
Louisiana, New Mexico, and Alabama.
Teachers Unions probably can't find a whole lot to brag about in this
ranking. Granted the Number 1 state (Massachusetts) is a very pro union without
exception. But not so much in New Hampshire. Heavily unionized states like Rhode
Island, Illinois, California, and Michigan did not
rank highly.
I tend to think that the most important "cause" of high education system
performance has little to do with education systems per se. I think education
performance depends most upon families. High ranking nations like Finland have
low divorce rates and strong family bonds. I did not investigate, but states in
the above study that have relatively low rankings perhaps rank highly in terms
of single-parent homes. There will of course be exceptions.
**How to mislead with statistics
Schools ranked by student/faculty ratio ---
https://oedb.org/rankings/student-faculty-ratio/
This link also suggests why low ratios are expected to help learning.
The first thing to note is that very low student/faculty ratios often are
associated with specialty colleges like seminaries and other specialty college
that have increasingly hard times attracting students.
Secondly, the best (lowest) ratios are in heavily endowed universities (think
Ivy League). But this can be somewhat misleading in terms of exclusion of some
graduate programs from the calculations. For example, Harvard has a low 7/1
ratio overall but certainly not in the MBA or law school programs that are cash
cows with very large classes with high student/faculty ratios.
Thirdly, class sizes are sometimes skewed giving rise to misleading
student/faculty ratios. In flagship universities it's very common to have very,
very large classes for basic core courses in order to have much smaller classes
for majors in junior and senior years. Thus a flagship state university does not
necessarily have very large classes uniformly across the campus. It's extremely
common these days for colleges to have faculty shortages in majors that are the
most popular with students. For example, the many humanities departments may be
rich in faculty numbers relative to the number of majors in humanities such that
senior level seminars may only have three or four students.
But the business school having many more majors may end up
with senior-level courses with 100 or more students because of severe shortage
of faculty in the business school.
Fourthly, it's very difficult to conduct studies on the impact of
student/faculty ratios when comparing universities because there are so many
confounding factors such as admissions standards and grading rigor. Add to this
the impact of varying use of distance education. Distance education is unique in
that students online often have more intense learning relationships with both
teachers and other students. Student/faculty ratios may be less revealing in
online courses.
Fifthly, low student/faculty ratios say nothing about the quality and
dedication of the faculty to teaching. Some colleges and universities have 90%
or higher tenure rates giving rise to job securities that are more independent
of teaching performance than in schools having much lower tenure rates with
faculty being more intensely evaluated as to performance along various criteria,
including teaching.
Sixthly, universities with low student/faculty ratios may be smaller
universities that just do not have many faculty or students. For example, the
Computer Science Department at Cactus Gulch College may only have 12 majors and
two faculty members. Flagship State University may have 800 computer science
majors and 40 faculty in computer science. Where would you like your daughter to
major in computer science? Chances are Flagship State has many more curriculum
options and specialty courses in computer science leading to much better job
prospects relative to Cactus Gulch computer science graduates.
Lastly, low student/faculty ratios are not always best. The Harvard Business
School has very high student/faculty ratios, but most any Harvard MBA graduates
will tell you they learned more from other students than they did from faculty.
This, in part, is due to the Socratic pedagogy of the Harvard Business School
were most courses focus on cases where students rather than faculty solve the
cases in class or in teams of students outside the classroom. Socratic learning
is intended for students to learn more from each other than from faculty who do
not lecture under the Socratic pedagogy --- often faculty who do not even reveal
best answers. Often the cases are so complex there are no "best answers." My
point here is that having higher student/faculty ratios may be better under the
Socratic Pedagogy ---
https://en.wikipedia.org/wiki/Socratic_method
The bottom line here is that the "best" place to go to college is extremely
complicated and multivariate in terms of so many things that student/faculty
ratios can be meaningful in some contexts and extremely misleading in other
contexts. The Harvard Business School and the Wharton Business School
(Pennsylvania) have relatively high student/faculty ratios. But graduates of
those programs end up on uniquely fast tracks to Wall Street employment or
corporate employment that overwhelm almost any other criterion in terms of
students wanting to get on those same employment tracks. At the same time having
a 1/1 student faculty ratio in the classics might be very ideal at Oxford
University if you hope to teach classics at Cambridge University or Harvard
University.
And "size" does matter in many ways, including the non-academic aspect of
college life. The University of Texas at Austin affords many opportunities for
great learning, but when it comes to dormitory living Jester Hall is so enormous
it has two zip codes. Many young people leaving home for the first time do not
want that kind of "bigness." Cactus Gulch may not have all the computer science
opportunities of UT-Austin, but living and learning and extracurricular life at
Cactus Gulch may be better in combination for many students. You don't have to
be NFL material to participate in varsity football at Cactus Gulch. You may
become relatively close to every student living in your Cactus Gulch dorm.
And when you encounter a Cactus Gulch professor while walking on campus that
professor might actually know your name. Don't count on this at UT-Austin.
And you might enjoy the quiet of you Cactus Gulch dorm, a quiet that never
happens at Jester Hall 24/7 with its fast food joints and all the stereos
blaring and residents/non-residents who live by night rather than day amid the
police sirens.
How to Mislead With Statistics
Nobody Could Beat the ‘Jeopardy!’ Champion. Then a University Librarian
Stepped Up ---
https://www.chronicle.com/article/Nobody-Could-Beat-the/246433
Jensen Comment
Both
Boettcher,and Holzhauer have proven themselves to be very good, and some of the
contestants that Holzhauer beat along the way were very, very good. What the
above article fails to realize is the role of chance in each game --- those
(usually) three Daily Double opportunities that Holzhauer used so effectively
with huge bets over the past few weeks.
My point here is that winners on Jeopardy are impossible to rank because of the
chance factor in those daily double occurrences. Holzhauer lost on the night he
failed to get a chance at the two biggest Daily Doubles. That's likely to happen
to any Jeopardy champion playing night-after-night.
Holzhauer was unlike other Jeopardy heroes in terms of the size of his Daily
Double wagers followed by consistently having the correct answers. He lost to
Boettcher largely because she got the two big Daily Doubles (by chance) on the
night she won, and she correctly answered both Daily Doubles. She;s been winning
this week but her Daily Double wagers are not as reckless as those of Holzhauer.
She's like him, however, in her consistency in pulling out correct answers.
How to Mislead With Statistics
States Producing the Most Renewable Energy (as a percentage of total energy
production)
https://247wallst.com/special-report/2019/07/24/states-producing-the-most-renewable-energy-2/
Jensen Comment
The Number 1 winner is Vermont --- supposedly producing virtually 100% of its
electricity needs (2.1 million KWh) with
(mostly old) hydro electric power.
At Rank 26 we have Wyoming producing 11.6% of its electricity needs
(46.7 million KWh) with wind power.
Vermont has 626,000 people whereas Wyoming only has 577,000 people.
The first question is why Wyoming has fewer people but still needs 20 times
more electric power. Partly this is explained by having the population of
Vermont more concentrated, thereby having less transmission line loss of
electricity. But 20 times less when wind power can be generated more where
needed with wind than hydro power that depends more upon geology?
Secondly, Wyoming disserves more credit than Vermont by meeting power needs
with new investments (windmills) whereas Vermont does relatively little new
investing in new renewable power sources since it has very old hydro dams still
meeting power needs.
Actually Vermont sells much of its hydro power to the grid and relies a great
deal more on burning of biomass (wood chips) for cities like Burlington. Vermont
actually discourages investing in wind power as being bad for aesthetics and
tourism.
The second question is why are renewable energy sources are lumped into one
category when they are environmentally different? |
Should you really compare Wyoming (generating 11.6% of its energy needs from
wind power that does not produce carbon) with South Carolina, Rhode Island, and
Virginia (generating most of their renewable energy from biomass wood chip
burning that's second only to coal in terms of producing carbon into the
atmosphere).
What's very misleading, aside from lumping solar, wind, and biomass into one
category, is to ignore state population in the write up of this energy data.
Sure Vermont supposedly generates almost 100% of its electricity needs with
hydro, but when I visit Vermont I see as many fuel oil and propane trucks in
each village as I see in New Hampshire villages. Vermont is burning petroleum
just like New Hampshire, but Vermont is making more selling power from old hydro
dams to states like New York and Massachusetts. Vermonters are not nearly as
environmentally focused as they like to pretend, especially since much of their
newer "renewable" electric power is from burning wood chip smoke into the
atmosphere that's far less environmentally friendly than propane.
In truth we probably should not even be comparing Vermont and Wyoming with
high-populated states like California and New York. There's a denominator effect
where percentages are distorted by very small or very large denominators
relative to numerators of interest.
**How to Mislead With Statistics
16 Prestigious Jobs With Surprisingly Low Pay ---
http://www.businessinsider.com/jobs-with-surprisingly-low-pay-2013-11?op=1
- Head chef
- Post-doctoral fellow
- Dietitians/nutritionists
- Legislators
- Graphic designer
- Zoologists and marine/wildlife biologists
- Professor
- Accountants and auditors
- Psychologist
- Architect
- Credit analysts
- Chemist
- Budget analysts
- Network systems and data communications analysts
- Biomedical engineer
- Optometrist
Jensen Comment
There are so many things wrong with this listing that I don't know where to
begin.
Post-doctoral Fellows are still in the learning stages of there careers and
can hardly be full professionals until they no longer have temporary jobs with
the adjective "post-doctoral" in their job titles.
Next consider the $59,860 (Cultural Studies Professors) compared with $67,953
(English Professors) where Mathematics and Science Professors fall in the
middle at $64,955. How many ways can this be misleading? Firstly, these are only
a few categories of many, many types of professors where the highest paid
disciplines are ignored such as professors of accounting, finance, management
marketing, engineering, education, and law where averages are higher. Secondly,
there's a huge standard deviation around the averages that are reported for each
and every profession listed above. Top universities pay much higher salaries,
and the reported averages for professors are drawn down by the thousands of
colleges that are on the margin financially.
How many colleges do you know that pay English professors on average more
than math and science professors? Lastly the article ignores the supplemental
summer pay, the book royalties, the consulting fees, and the research grants of
professors.
What are chemists? What are psychologists? Do they have doctorate/masters
degrees or do they only have undergraduate degrees? More importantly where to
they work? Are the chemists only working from grant-to-grant or are they in
institutes with more permanent jobs. Are the psychologists working on their own
our of an old Volkswagon van as drug counselors or are they in tower offices of
big hospitals? Once again, what is a "Psychologist?" What is a "Chemist?"
Accountants and auditors vary from partners making a million dollars or more
a year to a time-card clerk living on $12,500 plus food stamps and Medicaid.
There may even be that struggling tax accountant working out an apartment made
$1,865 full time while watching the infant and living on the $250,000 salary of
the spouse of the household.
Is there such a thing as a "Legislator" career? Virtually all legislators had
successful or failed careers prior to being elected to office. Most only hold
office for 4-16 years for which they often get free travel (including hotels and
meals), bribes/kickbacks, free sexual favors, and free medical services and
medications for the rest of their lives even though they only served for four
years before being booted out of office.
What is a budget analyst and how does this differ from being an accountant or
finance professional? Are budget analysts simply lower paid accountants?
There's a world of difference between being "Head Chef" at a Pizza Hut
franchise versus being "Head Chef" at a Hilton Hotel. Also top quality head
chefs are often on profit sharing plans or even own the restaurant such that
incomes vary dramatically with annual profits. And they eat free. Sometimes they
even get free apartments on the premises.
Do most optometrists work for a wage? I doubt it. They probably work on some
type of profit sharing contract until they become established enough to commence
practicing on their own.
My point is that many of these so-called jobs are really transitional posts
where the intent is to move on into much more lucrative careers later on in
life. Many of these so-called averages are distorted by lower-end outliers that
are not reflective of most the professionals that move on in life. For example,
new auditors fresh out of college join large CPA firms for the training and
experience before leaving the CPA firms to move into other firms or government
agencies who give them other job titles in management or FBI Agent or whatever.
The FBI hires more accountants than lawyers --- at least the last time I looked.
Bob Jensen's career helpers (and yes I know education is important for
reasons other than a career) ---
http://www.trinity.edu/rjensen/Bookbob1.htm#careers
**How to mislead with statistics (rankings, missing variables)
The Top Fifty Colleges and Universities in the USA
https://www.businessinsider.com/best-colleges-in-america-ranked-2018-9#1-harvard-university-50
Jensen Comment
Probably the least happy universities are the Ivy League universities that did
not make the Top 10.
It's a lot like comparing apples versus oranges when you compare
narrow-focused and tiny Swarthmore (Rank 31) with a mega university like Ohio
State (not in the top 50).
I won't go into my usual rant about why such rankings are misleading.
Probably the major complaint I have is the "halo" effect of historic reputation
and greatness in some disciplines (think science and literature) spills over
into some not-so-great specialties. For example, both Brown and Princeton have
finance majors, but I would not rank those majors nearly as high as finance
majors in some other universities like Bentley. Jagdish Gangolly will probably
argue that UC San Diego has a better medical school than many of the medical
schools in the Top 40 universities. Texas A&M and Harvey Mudd probably have
better engineering schools than most universities in the Top 50.
BYU, Texas, and Wisconsin have a better schools of accountancy than any of
the schools of accountancy in the Top 50 other than maybe Notre Dame and
Illinois.
Texas can hold its own in computer science against any of the Top 50.
My point here is that some of the Top 50 are ranked
in terms of historic greatness as opposed to current greatness.
Teachers Versus Quarterbacks
**How to mislead with statistics and rankings
NFL Quarterback Rankings ---
http://www.businessinsider.com/nfl-quarterback-power-rankings-week-five-2013-10?op=1
Jensen Comment
When I grew up a popular song was entitled "No Man is an Island" ---
Don Cornell (1955) ---
http://www.youtube.com/watch?v=tXNMPUwyTGM
One has to wonder how quarterbacks can be ranked apart from their protective
linemen and the quality of their receivers. In addition, the running game can
make or break a passing game, at least in terms of statistical performance of
the quarterback. And a weak defense can leave the world's greatest quarterback
sitting on the bench for most of the game while the opposing team chews up the
clock with 3.5 yards at a time.
In a private message regarding RateMyProfessors.com, Joe Hoyle questioned how
the Top 25 college teachers can be ranked apart from statistics like grading
easiness. He made his point, and I might add that Joe gets stellar ratings while
being hammered for grading toughness --- a remarkable accomplishment in my
opinion.
This prompted me to look at the 2013 top ranked teachers on
RateMyProfessors.com ---
http://www.ratemyprofessors.com/toplists/topLists.jsp
- The Number 1 teacher ranks 5.0/5.0 overall and 4.8/5.0 in terms of
easiness
- The Number 5 teacher, an accounting professor, ranks 5.0/5.0 overall and
4.9/5.0 in terms of easiness
So how is the ranking of teachers (sort of islands) like ranking of
quarterbacks (never islands)?
I don't really think teachers are islands. Their performance depends a great
deal upon others, notably the abilities and motivations of the students that
their colleges provide them in the classroom. In this age there is also the
factor of facilities. Do they teach in electronic classrooms? There also is a
factor of resources. Does their college provide them with money for field trips?
There is, however, one key difference between comparing quarterbacks versus
comparing of teachers. The statistics tracked for quarterbacks are well defined.
In comparison the overall ratings of teachers and the easiness of teachers are
not well defined in terms of the subjective response of each and every
respondent.
**How to Mislead With Statistics
Timing is Everything: Evidence from College Major Decisions ---
http://www.econweb.umd.edu/~pope/westpointtiming.pdf
Jensen Comment
Based on my own anecdotal experience across 40 years of being on the faculty of
four universities I'm suspicious about the conclusions of this study on
causality.
Personally, I think that student choices of major in many, certainly not all,
instances is primarily impacted by parents and/or other relatives for very close
family friends. This is not necessarily the case at the start of the first
semester in college where students still tend to leave their options only. But I
think deep in the backs of their minds the wishes of parents and family friends
come to surface.
I admit to being wrong in many instances and this article often rings true.
Our minister has ten very loving and tightly-knit children. What emerged is a
loved leader among the children named Lauren. She graduated from high school
(all were home schooled) and entered nursing school. She's now a popular cardiac
nurse in the Eastern Main Medical Center in Bangor. Lauren influenced her
younger brother Landon's decision to attend the same nursing school. I'm sure he
was partly influenced by all the job opportunities that opened up to his older
sister. But along the way in college Landon was greatly influenced by a required
course in psychology. Landon changed majors and is now a psychology major bent
on becoming a clinical psychologist. Job opportunities are much more limited
(competitively) as a new graduate in psychology. Go figure!
The accounting profession was greatly worried as virtually all the 50 states
commenced requiring 150 credits to sit for the CPA examination, which for most
aspiring CPAs is tantamount to requiring a masters degree. What would this alone
do to the number of undergraduate accounting majors? We'll never know. The
reason is that at the same time CPA firms and business firms offset this new
academic requirement with greatly expanded undergraduate internship programs. It
turns out in accounting and other academic majors it really helps to have
internships available to most students in a discipline and, get this,
internships that lead to job offers before students even enter their masters
programs (with the job offers being contingent upon getting the masters
degrees).
My point student decisions regarding majors are
probably too variable, complicated, and serendipitous to neatly summarize.
Certainly ranking key factors is extremely misleading.
There are too many interacting variables.
**How to Mislead With Rankings (definitions)
(rankings)
Jobs With the Most (and Least) Job Security
https://247wallst.com/special-report/2018/02/02/jobs-with-the-best-and-worst-job-security-2/?utm_source=247WallStDailyNewsletter&utm_medium=email&utm_content=FEB102018A&utm_campaign=DailyNewsletter
Jensen Comment
This is an illustration of selection bias in research. In this case the most
secure jobs in the USA were left out of consideration.
Probably the most secure job in the USA is being a tenured K-12 school teacher
where unions and lawyers often protect pedophiles and scammers. In large urban
cities like New York and LA there are special rooms where former teachers
suspected of pedophilia or other inappropriate behavior go year-in and year-out
and do nothing required for their full-time pay and benefits. They can sleep all
day or write books or just sit and watch porn until it's time to go home. Nobody
much cares how tardy they are when showing up for "work."
The second-most secure job is a civil service job in the Federal government
where it's rare to fire bad employee (say one who only shows up for work 10% of
the time), and then everything is done to hire a fired employee back into the
system. Recently the IRS actually fired over 200 employees for frauds, but then
most of those fired employees were sneakily hired back.
Tenured college faculty members can be fired for moral turpitude, but their
tenure more often than not protects them from being fired for incompetence and
negligence. Those that are forced out of the system usually get such generous
buy-out packages that they leave happy as larks when leaving campus for the last
time.
There also is some question about how to define job "security." You may be
assured of keeping your job but find yourself being reassigned to Panama or
Venezuela. Less dramatically you may be re-assigned just far enough away to make
your life very uncomfortable. At the moment we have two postal workers in a
nearby town of Franconia about two miles down the hill from our cottage. Both
are extremely hard workers. They were re-assigned to the Franconia Post Office
from separate towns over an hour away. They now face the choice of having to
sell their homes and relocate their families or commute on our often wintry
deer/moose filled mountain roads in the dark of morning and the dark of winter
evenings. Both are now still commuting over an hour each way in part because
just after moving to Franconia they might find themselves re-assigned in these
unstable days of working for the Post Office (where post offices are
increasingly being closed down to save money). I don't call this great job
"security."
**A Debate Issue Over Teacher Pay
K-12 Teachers are Underpaid ---
https://qz.com/1741568/early-educators-earn-too-little-and-it-could-hold-kids-back/
K-12 Teachers are Not
Underpaid
---
https://www.nationalaffairs.com/publications/detail/the-truth-about-teacher-pay
Jensen Comment
Of one thing I'm certain.
Comparison of teachers academic-year (9 month) salaries with calendar-year (12
month) salaries is misleading. Teachers can and often do supplement their
academic-year salaries in various ways during the other three months of each
year. Sometimes they teach during the summer terms. Sometimes they work in other
trades.
My daughter was a biology teacher. She supplemented
her income by also working week ends in a hospital laboratory as a medical
technician. She also did this in the summertime, but the rest of her summer days
were devoted to being with her children who were not in school during the summer
months. Becoming a teacher is very attractive to parents who want to be with
their children in the summer months.
I don't doubt that higher pay may help attract
better teachers and help retain those teachers. This is true for almost any
profession, although sometimes the pay issue is complicated. For example, a
career in the USA's military does not pay very well, but there aren't many
careers where after only 20-30 years you can get a lifetime pension, financial
support for college, and lifetime benefits like free medical care, free
medicine, and heavily discounted shopping in base exchange stores. Some
professions allow time independence for supplementing income. College
professors, for example, generally are allowed time to write books and earn
consulting income and speaker fees. Life was good to me as a college professor.
**How to Mislead With Statistics: Create a Denominator
Effect
"W&L, Other Colleges Goose Rankings by Counting
Incomplete Applications to Shrink Acceptance Rate," by Paul Caron,
TaxProf Blog, September 23, 2013 ---
http://taxprof.typepad.com/taxprof_blog/2013/09/wapo-washington-.html
Jensen Comment
I know a Professor X who used to do something similar. Nearly 80% of his
students had an A grade going into the final. On the last day of class he handed
out teaching evaluations --- well in advance of the final examination scheduled
late in final exam week. Then in the final exam he clobbered them with an
exam that made them happy to pass the course with any grade.
Of course, there's a difference between Professor X versus
the colleges that report incomplete applications as full applications in
computing admission acceptance rates. In the case of Professor X it did not take
many semesters for it to become widely known across campus how he was shrinking
the number of top grades in his courses. In the case of W&L and other colleges
shrinking acceptance rates it might never have become known by the media how
these colleges were fudging their acceptance rates.
"Law Deans in Jail," by Morgan Cloud and George B. Shepherd. SSRN,
February 24, 2012 ---
http://papers.ssrn.com/sol3/papers.cfm?abstract_id=1990746
Abstract:
A most unlikely collection of suspects - law schools, their deans, U.S. News
& World Report and its employees - may have committed felonies by publishing
false information as part of U.S. News' ranking of law schools. The possible
federal felonies include mail and wire fraud, conspiracy, racketeering, and
making false statements. Employees of law schools and U.S. News who
committed these crimes can be punished as individuals, and under federal law
the schools and U.S. News would likely be criminally liable for their
agents' crimes.
Some law schools and their deans submitted false
information about the schools' expenditures and their students'
undergraduate grades and LSAT scores. Others submitted information that may
have been literally true but was misleading. Examples include misleading
statistics about recent graduates' employment rates and students'
undergraduate grades and LSAT scores.
U.S. News itself may have committed mail and wire
fraud. It has republished, and sold for profit, data submitted by law
schools without verifying the data's accuracy, despite being aware that at
least some schools were submitting false and misleading data. U.S. News
refused to correct incorrect data and rankings errors and continued to sell
that information even after individual schools confessed that they had
submitted false information. In addition, U.S. News marketed its surveys and
rankings as valid although they were riddled with fundamental methodological
errors.
Bob Jensen's threads on cheating in higher education
are at
http://www.trinity.edu/rjensen/Plagiarism.htm
Bob Jensen's threads on higher education college
ranking controversies ---
http://www.trinity.edu/rjensen/HigherEdControversies.htm#BusinessSchoolRankings
**How to mislead with statistics
A Model for Teaching About Corrections and Criticisms in Lies With Statistics
"Ranking The States From Most To Least Corrupt," by Harry Enten, Nate
Silver's 5:38 Blog, January 23, 2015 ---
http://fivethirtyeight.com/datalab/ranking-the-states-from-most-to-least-corrupt/
Jensen Comment
The article itself is great for pointing out how corruption rankings are
misleading in this ranking that paints Louisiana and Mississippi as the most
corrupt and Oregon and Washington states as the least corrupt.
Bob Jensen's threads on ranking controversies ---
http://www.trinity.edu/rjensen/HigherEdControversies2.htm#BusinessSchoolRankings
Most Outrageous Product Claims of All-Time -
https://247wallst.com/special-report/2019/05/06/43-most-outrageous-product-claims-of-all-time-2/?utm_source=247WallStDailyNewsletter&utm_medium=email&utm_campaign=DailyNewsletter&utm_content=MAY082019a
Fake claims of science are common, but the criteria for ranking are dubiou
**How to mislead with rankings?
"The 20 Best Jobs Of The Future," by Andy Kiersz, Business Insider,
January 24, 2014 ---
http://www.businessinsider.com/best-jobs-of-the-future-2014-1?op=1
Jensen Comment
Bookkeeping, Accounting, and Auditing Clerks come in at Rank 17. Average
salaries are very low because they are averaged over low level bookkeepers and
clerks who did not go to college. Why are college graduate accountants left out
of this ranking?
I don't even know what an "auditing clerk" is after teaching accounting for
40 years.
These rankings are highly misleading.
Why do registered nurses (at rank 1) beat out "specialist physicians and
surgeons (at rank 4)?
Why do elementary school teachers (low paid) beat out college professors (highly
paid)?
Why are military careers ignored (retiring after 20 years with lifetime pensions
and medical care is a good deal)
The best word to describe this ranking is misleading "garbage."
**How to mislead with statistics (aggregation, Definitions)
Scientific American: Web Searches Reveal (in Aggregate) What We’re Really
Thinking ---
https://www.scientificamerican.com/article/web-searches-reveal-in-aggregate-what-were-really-thinking/
Jensen Comment
The "in aggregate" qualifier is important since anecdotal data for particular
individuals can be especially misleading. And even "in aggregate" search
outcomes may also be misleading. For example, what does it really tell us to
learn (hypothetically speaking today) that nearly half the clergy (including
priests) do a huge amount of searching of the Dark Web? This does not in and of
itself tell us what they're "really thinking." Conversely, if we discover that
over half the male bureaucrats versus female bureaucrats on the job spend over
half of every working week at porn sites it may tell us more about that these
addicts are "really thinking."
For my three blogs I spend hours each day searching all over the Web. Since
the thousands of sites visited often are so many and varied I doubt that anybody
can learn what I'm "really thinking" other than that I must be search for a
variety of really interesting links to share with my readers..
An author might spend thousands of hours at literature sites. That author may
be studying the crafts of other authors to help his or her own writing. Then
again that author might simply be looking for passages that can be cleverly
plagiarized.
**How to Mislead With Statistics
"College Majors That Produce the Highest (and Lowest) LSATs and GPAs," by
Paul Caron, TaxProf Blog, April 8, 2014 ---
http://taxprof.typepad.com/taxprof_blog/2014/04/muller-.html
Jensen Comment
Some ways the above ranking can be misleading are the omitted variables. One
omitted variable is the ranking of the university. For example, many of the top
ranking universities such as nearly all Ivy League universities like Harvard,
the very top liberal arts schools like Swarthmore, and other top universities do
not have business schools. Hence, there is zero chance of nonexistent business
majors in these schools that had the top SAT admission scores to have top LSAT
scores. Many of the business majors taking the LSAT examination came from lower
ranked universities that also have the lower ranked SAT students in their
undergraduate programs.
Another way the above ranking can be misleading is that business majors
deciding to try for law school tend to be the ones who did not get great job
offers. For example, the best accounting majors tend to accept jobs with the
large CPA firms. The ones that did not get any of those job offers think about
law school as a consolation prize. I've seen this happen quite often during my
40 years of teaching accounting. This problem is exacerbated since accounting
majors must now go five years in order to take the CPA examination. They are
less inclined to spend the time and money going to law school after completing
five full-time years majoring in accounting.
Consider why classics majors are probably at the top of the list. Even the
very top classics majors probably had zero job offers. Hence, classics majors
taking the LSAT examination are probably the top classics graduates. Top
science, engineering, nursing, and other professional graduates, including
education majors, probably had good job offers or intend to go on to graduate
school in their chosen discipline. Those at the lower end of their graduating
class may be more inclined to consider law school. This is reflected somewhat in
the gpa data shown alongside the LSAT sccores. Classica majors who took the LSAT
had an average gpa of 3.477. For the business majors who took the LSAT the
average gpa was 3.098. These where not the ream of the crop business students
choosing to take the LSAT.
Bob Jensen's threads on careers ---
http://www.trinity.edu/rjensen/Bookbob1.htm#careers
**How to Mislead With Statistics
"Guess Who Doesn’t Care That You Went to Harvard?" by Gretchen Gavett,
Harvard Business Review Blog, February 28, 2014 ---
http://blogs.hbr.org/2014/02/guess-who-doesnt-care-that-you-went-to-harvard/
Jensen Comment
I think this is a misleading article. Business firms may not care whether or not
that you graduated as an undergraduate from Harvard but they a often are deeply
impressed by the fact that you got into Harvard, Yale, MIT, Princeton,
Dartmouth, etc. Also those business firms and graduate schools know that the
highest GRE and GMAT scores are highly correlated with the highest SAT scores
that got students into the Ivy League schools in the first place. Also grade
inflation is virtually highest in the Ivy League among colleges and universities
in higher education (except maybe at Princeton which is making a limited effort
to bring down grades). Naive recruiters might be impressed by high grades from
Harvard without knowing that 80% of the graduates from Harvard graduate cum
laude.
Business firms will more actively recruit undergraduates from Cornell and the
flagship state university business schools because most of the Ivy League
universities like Harvard do not have undergraduate business schools. But this
does not apply to MBA graduates from Ivy League schools that have prestigious
MBA programs.
Gretchen Gavett fails to mention a leading recruiting edge of graduate
business and law programs at Harvard, Yale, MIT, and Dartmouth --- those
fantastically important Ivy League alumni networks. For example, business
executives that greatly adore their alma mater's green blazers actively seek to
hire recent Tuck School graduates from Dartmouth's Tuck Graduate School of
Business. Green-blazed graduates have an edge with successful Tuck alumni
recruiters!
MBA programs at Ivy League schools do not do well when firms are hiring for
certain types of specialties. For example, most Ivy League MBA programs do not
have curricula for passing the CPA examination. Firms do not generally recruit
new auditors and tax accountants and AIS specialists at the Ivy League
universities. Gretchen Gavett is correct in this regard!
**How to Mislead With Statistics (Denominator Effect, Rankings )
American public schools
receive on average about 9% of their revenue from federal sources, 47% from
state sources, and 45% from local sources
School Districts Spending the Most
http://247wallst.com/special-report/2016/09/09/school-districts-with-the-highest-spending/?utm_source=247WallStDailyNewsletter&utm_medium=email&utm_content=SEP092016A&utm_campaign=DailyNewsletter
Jensen Comment
The USA school districts spending the most tend to be up to their necks in oil
and gas revenue in Alaska, but this is changing due to falling oil prices.
High valued property districts in New York rank high, in part, because New
York does not set limits on how much rich districts can spend per pupil.
However, the rankings regarding which districts spend the most is greatly
impacted by a "denominator effect" where they rank high to a great deal because
they have so few students. The joke in Vermont is that some school districts
have more school board members than students. Remember that the entire State of
Vermont only has about a half million people.
The "denominator effect" is illustrated most dramatically by a very small
(among the many small) school districts in Vermont ---
http://247wallst.com/special-report/2016/09/09/school-districts-with-the-highest-spending/2/
8. Rivendell Interstate School District, Vermont
> District spending per pupil: $33,975
> State spending per pupil: $16,988
> Median household income: $58,317
> Enrollment:
277 (all
grades)
Rivendell is the only
school district outside of Alaska and New York to rank among the 10 biggest
per pupil spenders. The district serves students from both Vermont and New
Hampshire and spends nearly $34,000 per pupil each year. However, due to
recently passed legislation designed to make Vermont’s many small and
disparate school districts more efficient, Rivendell will not likely remain
among the top spenders for long. In 2015, the state enacted legislation
known as Act 46, which stipulates that districts with less than 900 students
must merge
administrations
with other similarly small
districts. Though Rivendell is exempt from the law because it is an
interstate district, there are many strong financial incentives for it to
partner up with other districts.
**How to Mislead With Statistics (rankings, definitions)
Here's Where Americans Are Moving To and From
http://www.businessinsider.com/us-county-domestic-migration-map-2018-4
Jensen Comment
This type of analysis is misleading for a number of reasons. Firstly, it's based
on number of residents per 1,000 of a county who moved into or out of between
2016 and 2017. This makes the rankings biased toward smaller population
counties. For example, the "biggest migration into a county" resulted from the
1,979 people who moved into Kendall County, Texas resulting in a 47.2 rate of
migration per 1,000 residents of Kendall County. Many more people moved into
nearby Bexar, County Texas but since Bexar County has nearly 2 million people ti
had a negligible chance of beating the 47.2 rate of inflow per thousand. This
misleading type of ranking is typical result of small sample statistics. As
another example, suppose that 17 students from a small university take the CPA
exam in a given month and 12 pass all four parts of the examination making this
university the highest ranking in the state. A year later 16 take the exam and
four pass making it the lowest ranking in the state. Such ups and downs for a
small program rankings are common and very misleading when compared with larger
universities that have less extreme but more consistent passage rates on the CPA
examination.
There are other limitations when comparing "Where Americans Are Moving Too
and From" in the above analysis. For example, we might conclude that counties
with the highest positive migration rates are affording economic opportunities
to new arrivals. But in the case of Kendall County mentioned above the new
arrivals in Kendall County are probably working in Bexar County. Many of the new
arrivals in Kendall County are simply willing to make longer commutes for more
rural-type of living. The Progressive Farmer magazine ranked Kendall
County as the Fifth Best "Rural Place" to live in the USA.
https://en.wikipedia.org/wiki/The_Progressive_Farmer
But it's a rural county that offers urban (San Antonio) economic opportunity.
It's also far less rural the closer one gets driving south toward San Antonio.
In fairness Business Insider excluded counties having less than 10,000
residents when ranking migration into and out of counties. This eliminated the
extreme outliers, but there are still outliers that remain in the rankings. Of
course if it merely reported numbers of people moving into and out of a county,
small counties would almost never have a chance of being recognized.
Still another problem in the above statistics is that states vary greatly
regarding how a "county" is defined. Massachusetts is of somewhat comparable
size to Iowa, but Massachusetts only has 14 counties. Iowa has 99 counties.
https://en.wikipedia.org/wiki/List_of_United_States_counties_and_county_equivalents
**How to Mislead With Statistics
The 15 College Majors With The Lowest Starting Salaries ---
http://www.businessinsider.com/college-majors-with-the-lowest-starting-salaries-2015-1?op=1
Jensen Comment
This a in some cases a little misleading such as when careers entailing
12-months on the job with two weeks paid vacation are compared with others
entailing 9-months on the job with an added 8+ weeks paid vacation. The latter
careers with five months free are especially popular for parents having or
expecting young children at home.
Starting salaries are not nearly as important as career growth and enjoyment
of the work. For example, some employees will take lower pay to work with
children or to work in biblical studies. Careers that have little variation in
routine over decades can become very boring. I think physical therapy might be
interesting for a time but can become very boring over 40+ years.
Keep in mind that these rankings are based on averages that in some cases
have varying standard deviations. For example, law graduates may have higher
averages but many start out at very low salaries as clerks or lowly-paid
interns.
Bob Jensen's threads on careers are at
http://www.trinity.edu/rjensen/Bookbob1.htm#careers
**How to Mislead With Statistics
This epic chart shows the average wage for almost every job in America
---
http://www.businessinsider.com/the-average-wage-for-almost-every-job-in-america-2015-6#ixzz3d2buLBjq
Jensen Comment
Once again I remind readers of how misleading compensation rankings can be due
to missing variables in deriving the numbers. The biggest source of error
becomes "gross" versus "net" compensation. For example the highest paid
professionals in the USA are anesthesiologists and surgeons. But they may not
lead the pack in terms of net compensation
after deducting for malpractice insurance, business insurance, medical office
space costs, and medical office staff(receptionists, nurses, accountants,
computer technicians, etc.) Those who work for medical centers, including VA
centers, that pay anesthesiologists and surgeons net
of such expenses do not make nearly as much as the gross compensation rankings
in the comparisons in the above citation.
Gross compensation varies considerably with location. For example,
malpractice insurance is much cheaper in Texas due to a constitutional amendment
that caps punitive damages that make lawyers salivate. Office space costs that
must be covered in San Francisco and Silicon Valley is out of sight compared to
what it costs in Bangor, Maine.
Compensation also varies a great deal with perks that are almost impossible
to compare in various professions. For example, large public accounting firms
spend a fortune on training costs relative to what is drug chains spend for
training pharmacists and what doctors spend for training their nurses. For
newly-hired staff accountants this and on-the-job experience is more important
than starting salaries, especially for those accounting graduates who have no
intention of staying in public accounting pressure cookers for more than a few
years before moving on.
Some companies like Starbucks and Blue Cross Anthem will now provide free or
nearly-free general education leading to most any type of undergraduate degrees
(not necessarily job related) even for lowest-paid full-time employees whereas
this perk is not common in most other companies. The USA military branches
provide very generous college stipends for enlisted personnel to use even after
being honorably discharged. Those stipends in many instances cover full tuition,
room and board. We have a granddaughter who intends to join the Navy just
because of this perk.
Retirement benefits vary greatly. For example, in the private sector it's
rare to provide generous retirements to employees who are 40-50 years of age.
It's commonplace among USA military retirees. Several of my cousins retired from
the Air Force before they were 40 years of age and now live comfortably on
marginal farms (think cold northern Minnesota) that do not pay a whole lot
beyond military retirement benefits.
Job security also varies a great deal and is perk for which employees will
take sacrifices in take-home pay. For example, it's virtually impossible to be
fired from the USA Civil Service, which is why many folks try so hard to work
for the Civil Service. One of our sons who works for the largest Caterpillar
dealer in the world had a chance for promotion that would have given him a huge
increase in compensation. However, he would no longer have job security backed
by his union. He turned the promotion down.
College professors frequently turn down higher paying opportunities that do
not have tenure. Some that could nearly double their salaries will not give up
their tenure. For example, sometimes even endowed chairs in the Academy are
offered under conditions where tenure will only be evaluated after a year on the
job. Sometimes professors will not put their current tenure at risk by
relocating where they must be re-evaluated for tenure after a year. Bob Jensen
is Exhibit A, although when I moved from Florida State University to Trinity
University I did have to be re-evalueated for tenure after a year as the Jesse
Jones Professor of Business Administration. I had opportunities to move after
than without immediate tenure, but there's no way I would have done that again.
There's too much stress having to earn tenure more than once!
I have a friend who wanted to leave a university in Ohio so badly that he
gave up his tenure to move elsewhere. He lost three different professorships
after that and is, I think, belatedly sorry he sacrificed his tenured job
security.
Then are all the problems with comparing averages (means or medians) due to
varying standard deviations and that pesky kurtosis.
Bob Jensen's threads on careers are at
http://www.trinity.edu/rjensen/Bookbob1.htm#careers
**How to Mislead With Statistics
The 25 college majors that will lead to the lowest-paying jobs ---
http://www.businessinsider.com/college-majors-that-lead-to-the-lowest-paying-jobs-2015-5#ixzz3ZaIQmfD3
Jensen Comment
Such rankings on "pay" typically are misleading. Firstly, these are medians such
that half the people are earning more in each category and half the people are
learning less in each category. We need to know more about variances and reasons
for those variances --- often the variances are due to variances in living
costs.
Secondly, many of the low paying jobs are in education. But most of those low
paying jobs only entail working eight or less nine per year and can hardly be
compared with jobs that are nearly 12 months per year. Many parents are willing
to sacrifice pay for more opportunity to share time with their own families.
Many others take advantage of opportunities to earn more money in the off season
by writing books, working on organic farms, etc.
Some job categories are too vague to be compared. For example, what does a
job in "music" or "neuroscience" or "drama" entail? Typically music and "drama"
careers are highly variable in terms of time commitment. Performers may average
only a few hours or less per month in actual performance with highly variable
hours in practice and preparation. Music teachers, like other educators, are not
likely to have 12-month job commitments. Drama performers may not be so lucky.
Also majors do not necessarily translate to jobs requiring those majors. For
example about half of the law school graduates are now working in jobs that do
not require law degrees.
Lastly, it does not make much sense to compare "pay" without comparing
benefits. For example, teachers working for school systems typically get fairly
generous benefits in terms of medical insurance for 12 months while working less
than eight months on the job.
**How to Mislead With Statistics (ranking)
Best and Worst Jobs in Terms of Employment Security
https://247wallst.com/special-report/2019/02/27/jobs-with-the-best-and-worst-job-security-5/
Appraisers and assessors of real estate
(most secure)
Veterinary assistants and laboratory animal caretakers
Optometrists
Court, municipal, and license clerks
Computer network architects
Aerospace engineers
Veterinarians
Physicians and surgeons
Psychologists
Precision instrument and equipment repairers
. . .
Brickmasons, blockmasons, and stonemasons
Tour and travel guides
Farming, fishing, and forestry occupations
Counter attendants, cafeteria, food consession and coffee shop,
Miscellaneous agricultural workers
Packers and packagers, hand
Telemarketers
Graders and sorters, agricultural products
Roofers
Dishwashers (least
secure)
Jensen Comment
This article misleads in that it does not even mention conditional impacts of
seniority and tenure. For example, college professors often have trouble
finding tenure-track employment, especially in humanities and science. However,
once having achieved tenure (usually within 7-10 years) college professors
probably have the most job security in the USA. The above study does not
recognize this. Instead it's affected by the number of unemployed professors,
usually those that had trouble landing jobs in the first place rather than those
that have acieved tenure status. The same is true among K-12 teachers where
seniority and/or tenure eventually provides airtight job security.
Also the study fails to distinguish "employees" from "entrepeneurs." Some
professionals like optometrists, physicians, Veterinarians, and dentists are
really entrepreneurs owning their own businesses rather than employees.
**A Debate Issue Over Teacher Pay
K-12 Teachers are Underpaid ---
https://qz.com/1741568/early-educators-earn-too-little-and-it-could-hold-kids-back/
K-12 Teachers are Not
Underpaid
---
https://www.nationalaffairs.com/publications/detail/the-truth-about-teacher-pay
Jensen Comment
Of one thing I'm certain.
Comparison of teachers academic-year (9 month) salaries with calendar-year (12
month) salaries is misleading. Teachers can and often do supplement their
academic-year salaries in various ways during the other three months of each
year. Sometimes they teach during the summer terms. Sometimes they work in other
trades.
My daughter was a biology teacher. She supplemented
her income by also working week ends in a hospital laboratory as a medical
technician. She also did this in the summertime, but the rest of her summer days
were devoted to being with her children who were not in school during the summer
months. Becoming a teacher is very attractive to parents who want to be with
their children in the summer months.
I don't doubt that higher pay may help attract
better teachers and help retain those teachers. This is true for almost any
profession, although sometimes the pay issue is complicated. For example, a
career in the USA's military does not pay very well, but there aren't many
careers where after only 20-30 years you can get a lifetime pension, financial
support for college, and lifetime benefits like free medical care, free
medicine, and heavily discounted shopping in base exchange stores. Some
professions allow time independence for supplementing income. College
professors, for example, generally are allowed time to write books and earn
consulting income and speaker fees. Life was good to me as a college professor.
**How to Mislead With Statistics (definitions, rankings)
Who pays the most tax in Europe?
http://www.euronews.com/2018/04/26/who-pays-the-most-tax-in-europe-
Jensen Comment
You've probably heard me warn repeatedly that when taxes are compared it can be
misleading unless you also compare what those taxes are paying for in family
living. Income tax rates in the USA are relatively low and highly progressive
with nearly half of the taxpayers paying zero income taxes. But this is
misleading since things like health care and public education are paid out of
other taxes and/or personal savings. Even when comparing nations with national
health care plans funded heavily out of income taxes, comparing tax rates can be
misleading. Firstly there are taxes other than income taxes such as VAT taxes
and sales taxes. Secondly, not all national health care programs are equivalent
in terms of how certain coverages are paid for. In Germany, for example, the
public health plan is rather minimal and most Germans that can afford it have
private supplemental medical insurance. My neighbors from England at the moment
are back in the U.K. arranging to sell a parent's home for nursing home care
expenses. Nursing home care in the U.K. is covered in the national health plan
but revenues from home sales must be applied to this care --- so I'm told by my
neigbors.
In Europe taxes supposedly pay for college education and/or job training, but
less than half the young people are admitted to programs funded by tax dollars
---
http://faculty.trinity.edu/rjensen/HigherEdControversies.htm#Tertiary
Other people depend upon companies to fund on-the-job training, and many people
are not allowed into college unless they study in other countries or take
distance education courses such as MOOCs..
**How to Mislead With Statistics (definitions, rankings, correlations)
States Where Teachers Are Paid the Most and Least ---
https://247wallst.com/special-report/2018/05/15/states-paying-teachers-most-and-least/2/
Jensen Comment
Higher pay does not necessarily translate to higher graduation rates. New York
pays the highest salaries and is mired down in down in low graduation rates.
South Dakota has low teacher pay and high graduation rates.
Also note the cost of living ranking reported with each state. This matters a
lot where pay buys a whole lot more (think housing) in South Dakota versus New
York and Connecticut.
**How to mislead
with statistics
The Cost of Living in Nations Around the World ---
http://www.businessinsider.com/the-cost-of-living-worldwide-2015-1
Highest Cost of
Living Nations
-
Switzerland
-
Norway
-
Venezuela
-
Iceland
-
Denmark
-
Australia
-
New
Zealand
-
Singapore
-
Kuwait
-
United
Kingdom
-
Ireland
-
Luxenbourg
-
Finland
-
France
-
Belgium
The lowest cost
of living nations are also ranked in this study, but I would not want to live in
any of those nations.
Jensen Comment
You have to go to Movehub site for details on how the cost of living index is
calculated ---
http://www.movehub.com/blog/living-costs-world-map
Any CPI index is
controversial. It's not clear that it's very comparable between all these
nations.
The low cost of
living nations are poverty nations where most of the people barely stay alive in
spite of a low cost of living.
Some of the high
cost of living nations are rich oil producing nations like Norway, Venezuela,
and Kuwait. Some have very high taxes with benefits redistributions like Denmark
and New Zealand. Note that "free health care" is not really free. Even the lower
income people are taxed somewhat for their national health plans. Most
nations do not have as many poor people on totally free medical and medicine
health plans that the USA provides with Medicaid.
My impression is
that some things we take for granted in the USA are luxuries in the highest cost
of living nations. For example, it's not uncommon for middle class families in
the USA to have homes with over 2,000 square feet. Such large homes are luxuries
in all the 15 nations ranked above. Energy is relatively cheap in the USA in
terms of electricity, heating oil, and gasoline compared to most of the high
cost of living nations ranked above.
Health plans are
difficult to compare between nations. For example, most on national health plans
will provide organ, knee, and hip replacements but the waiting times may stretch
into years. But those national health plans may also provide nursing care for
the elderly that's not covered by Medicare in the USA.
Some of the high
cost of living nations provide free or nearly free college education. But free
college is not universal and may be limited to 25% or fewer of the college-age
prospects. I don't think any nation provides free college education to everybody
such as is now being proposed by President Obama.
My general
impression is that most tourists would tend to agree that the top 15 nations
ranked above are indeed very expensive tourism destinations. But some of
the low cost of living nations are also expensive tourism destinations when
there are high safety and kidnapping risks such as in Pakistan
**How to Mislead With Statistics (definitions, rankings)
Who pays the most tax in Europe?
http://www.euronews.com/2018/04/26/who-pays-the-most-tax-in-europe-
Jensen Comment
You've probably heard me warn repeatedly that when taxes are compared it can be
misleading unless you also compare what those taxes are paying for in family
living. Income tax rates in the USA are relatively low and highly progressive
with nearly half of the taxpayers paying zero income taxes. But this is
misleading since things like health care and public education are paid out of
other taxes and/or personal savings. Even when comparing nations with national
health care plans funded heavily out of income taxes, comparing tax rates can be
misleading. Firstly there are taxes other than income taxes such as VAT taxes
and sales taxes. Secondly, not all national health care programs are equivalent
in terms of how certain coverages are paid for. In Germany, for example, the
public health plan is rather minimal and most Germans that can afford it have
private supplemental medical insurance. My neighbors from England at the moment
are back in the U.K. arranging to sell a parent's home for nursing home care
expenses. Nursing home care in the U.K. is covered in the national health plan
but revenues from home sales must be applied to this care --- so I'm told by my
neigbors.
In Europe taxes supposedly pay for college education and/or job training, but
less than half the young people are admitted to programs funded by tax dollars
---
http://faculty.trinity.edu/rjensen/HigherEdControversies.htm#Tertiary
Other people depend upon companies to fund on-the-job training, and many people
are not allowed into college unless they study in other countries or take
distance education courses such as MOOCs..
**How to Mislead With Statistics (definitions, rankings, correlations)
States Where Teachers Are Paid the Most and Least ---
https://247wallst.com/special-report/2018/05/15/states-paying-teachers-most-and-least/2/
Jensen Comment
Higher pay does not necessarily translate to higher graduation rates. New York
pays the highest salaries and is mired down in down in low graduation rates.
South Dakota has low teacher pay and high graduation rates.
Also note the cost of living ranking reported with each state. This matters a
lot where pay buys a whole lot more (think housing) in South Dakota versus New
York and Connecticut.
*
*How to mislead with statistics
"Fibbing for Rankings," by Scott Jaschik, Inside Higher Ed,
February 2, 2015 ---
https://www.insidehighered.com/news/2015/02/02/audit-finds-u-missouri-kansas-city-business-school-gave-false-information-princeton
The University of Missouri at Kansas City gave the
Princeton Review false information designed to inflate the rankings of its
business school, which was under pressure from its major donor to keep the
ratings up, according to
an outside audit
released Friday.
The audit -- by PricewaterhouseCoopers -- described
the process by which business school officials came up with creative reasons
to provide data that many at the school believed to be false, and that the
audit found to be false. In one case, for example, the university created a
wish list of clubs that it might support to promote entrepreneurial
students. The university then reported that its wish list was reality and
that it had all of those clubs, which in fact did not exist.
Another part of the audit found that an article
published in The Journal of Product Innovation Management -- an
article that ranked the university's business school as the top institution
in the world in the field of innovation management -- did not violate
professional norms. However, the audit also found that the journal was
unaware when accepting the article that it was written by scholars with ties
to the university.
UMKC issued a news release Friday that reads:
"Independent review upholds No. 1 research ranking."
But the audit also confirmed many of the findings
of an August article in
The Kansas City Star that found "a pattern of
exaggerations and misstatements" by the business school. At the time, the
university disputed the Star's report, but Missouri governor Jay
Nixon requested an investigation, and that request led to the report issued
Friday.
'By All Means Necessary'
PricewaterhouseCoopers officials had access to
senior UMKC officials (including some who left positions they had held in
the period covered by the audit) and to relevant e-mail messages. The e-mail
revealed a focus on finding ways to do well in the rankings in order to keep
happy the business school's largest donor (of $32 million), for whom the
school, the Henry W. Bloch School of Management, is named.
An e-mail from then dean to colleagues said,
for example: "Henry Bloch gets very upset when our rankings go down. We must
do everything we can to increase it when we can by all means necessary.”
The audit then describes some of the things UMKC
did to rank high in the Princeton Review's evaluation of business schools'
(undergraduate and graduate) entrepreneurial programs.
For example, in answering a question about how many
students are enrolled in an entrepreneurship program, the university started
counting anyone who was taking a class in entrepreneurship. Not
surprisingly, the numbers jumped. For example, UMKC reported that
undergraduate enrollment in entrepreneurship programs increased in a year
(the year in which the university changed how it was filling out the form)
from 99 to 438. A dean told the auditors that he knew that figure "isn't
right."
Another change UMKC made helped it inflate answers
on another Princeton Review question: about what percentage of students
launch a business while enrolled. The university, the audit found, started
using primarily data from its e-scholar program (a certificate program for
entrepreneurs in which they must develop a business plan). The e-scholar
program students are not degree students or enrolled in the university, but
officials said they believed it was legitimate to use this group for
reporting, even though the Princeton Review ranks degree programs. Since all
of the e-scholar students must create business plans, the proportion of
undergraduates reported as launching a business increased from 44 percent to
100 percent from 2010 to 2011.
And then there was the question on clubs. The
Princeton Review asks: “How many officially recognized clubs/organizations
do you offer that are specifically for entrepreneurship students?”
The answers in 2009 were three each for
undergraduates and graduate students, and in 2010 were four each. In 2011
the figure jumped to 29 for graduate students and 28 for undergraduates.
Here's how the number of clubs "grew," according to
the audit. A business school official asked a colleague to put together a
wish list of clubs that might show an entrepreneurial focus at the
university. A second official "then instructed a UMKC graduate student to
populate these clubs onto the university’s webpage." UMKC "used the clubs'
existence on the university’s webpage as the only proof the club existed."
Officials believe "these additional 20-plus clubs never actually existed at
UMKC." Since the Star article, the number of clubs being reported
is down to five each for graduate students and undergrads.
The PricewaterhouseCoopers report says the
Princeton Review does not review the accuracy of information submitted to it
by colleges and universities and so did not do any independent analysis of
UMKC data. The audit also said it was not clear that any of the false
information would affect the business school's overall ranking.
But on Sunday night, Robert Franek, senior vice
president and publisher of the Princeton Review, said in an email to
Inside Higher Ed that Princeton Review would be removing UMKC from the
lists of best colleges and business schools for entrepreneurial programs.
“At The Princeton Review, for the past 34 years we
have provided accurate and timely information to students and parents to
help them make decisions about colleges and graduate schools. We were
extremely disappointed to learn that the University of Missouri-Kansas City
falsified data about the school per a report from PricewaterhouseCoopers on
January 30. As a result of this new information, we are removing the
University of Missouri-Kansas City from our 2014 ranking lists of the best
college and business school entrepreneurial programs," said a statement
Franek released. "Schools earn a spot on our entrepreneurship ranking
through school-reported data. Every school signs an affidavit to ensure
their information is accurate. We take these affidavits and this news very
seriously.”
Questions on a Journal Article
Another major part of the audit was a look at the
journal article published in The Journal of Product Innovation
Management.
On this question, the audit found that the article
was based on data analysis and that no shortcomings could be found in it.
But the article has been questioned from the time it was published. The
original Star article quoted a professor (anonymously, because he
feared speaking out) as saying that “We all knew that this was bullshit. We
knew that UMKC was not better than MIT and Stanford.”
While the audit didn't question the article's
findings, it did note concerns about it. The authors who asserted that UMKC
was tops in the world in innovative management did not disclose to the
journal that they were both visiting scholars at the university and knew
some of the players. Because the article was based on data (number of
articles written in journals of various influence, etc.), the journal's
editor said that the article's findings still stood. However, he said he
wished he had known about the authors' ties to the institution they praised.
The authors are two scholars from China. They gave
a letter to the auditor in which they said that there was no need to
identify their UMKC connections because the "double-blind" peer review
process -- in which they don't know who reviews their work, and the
reviewers don't know the author -- prevented conflict of interest. The
audit, however, found that at the journal in question "papers are solely
reviewed by the editor and not subject to the typical double-blind review of
other research papers."
Continued in article
Bob Jensen's threads on ranking controversies ---
http://www.trinity.edu/rjensen/HigherEdControversies2.htm#BusinessSchoolRankings
Jensen Comment
Perhaps we should be more precise in using the term "audit" versus the term
"review." The article content uses the word audit whereas the title more
appropriately uses the term review. Then again maybe this was an audit since it
validated the numbers.
Price Waterhouse years ago was willing to lend its name to the possible
limits of the term "review." Over ten years before its merger with Coopers &
Lybrand, PW signed off on a review in 1987 of Days Inn financial statement
forecasts prior to a planned IPO of Days Inn. This was not an audit of the
forecast numbers themselves. But it was a "review" of the forecast procedures of
Days Inn and a review of the "underlying assumptions" in those forecasts.
I still have a prized copy of that 1987 Days Inn annual report in which PW
audited the 1987 financial statements and reviewed the financial statement
forecasts. A real estate appraisal company, Landhauer Associates, signed off on
the estimates of over 300 hotel exit values based on a sampling of the real
estate appraisals. I provide more details at
http://www.trinity.edu/rjensen/Theory02.htm#FairValue
Perform search on the phrase "Days Inn"
Update
Princeton Review Strips U. of Missouri at Kansas City of Its Controversial
Ranking ---
http://chronicle.com/blogs/ticker/jp/princeton-review-strips-missouri-university-of-its-controversial-ranking?cid=at&utm_source=at&utm_medium=en
Small, Large or Otherwise Misleading Samples
(including non-stationarity and misleading statistical inferences for large
samples)
**How
to Mislead With Statistics (misleading inferences)
P-value
---
https://en.wikipedia.org/wiki/P-value
**How to Mislead With Statistics (big deal item, distortions)
P-values can be misleading when hypotheses are
incorrect, samples are too large, samples are too small, etc.
February 6, 2019 Message from Tom Dyckman (now retired from Cornell
University)
Bob:
Here is a new paper you might want to alert your readers too along with
Dave's blog today.
Greenland, S., S. J. Senn, K. R. Rothman, J. B.
Carlin, C. Poole, S. N. Goodman, & D. G. Altman,
2016. Statistical tests, p values, confidence intervals, and power: A guide
to misinterpretations. European Journal of Epidemiology, 31,
337-350.
https://fermatslibrary.com/s/statistical-tests-p-values-confidence-intervals-and-power-a-guide-to-misinterpretations
Abstract
Misinterpretation and abuse of statistical tests, confidence intervals,
and statistical power have been decried for decades, yet remain rampant.
A key problem is that there are no interpretations of these concepts
that are at once simple, intuitive, correct, and foolproof. Instead,
correct use and interpretation of these statistics requires an attention
to detail which seems to tax the patience of working scientists. This
high cognitive demand has led to an epidemic of shortcut definitions and
interpretations that are simply wrong, sometimes disastrously so—and yet
these misinterpretations dominate much of the scientific literature. In
light of this problem, we provide definitions and a discussion of basic
statistics that are more general and critical than typically found in
traditional introductory expositions. Our goal is to provide a resource
for instructors, researchers, and consumers of statistics whose
knowledge of statistical theory and technique may be limited but who
wish to avoid and spot misinterpretations. We emphasize how violation of
often unstated analysis protocols (such as selecting analyses for
presentation based
on the
P values
they produce) can lead to small P values even if the declared test
hypothesis is correct, and can lead to large P values even if that
hypothesis is incorrect. We then provide an explanatory list of 25
misinterpretations of P values, confidence intervals, and power. We
conclude with guidelines for improving statistical interpretation and
reporting.
Continued in article
**How to Mislead With P-Values
How Many Ways Can You Misinterpret p-Values, Confidence Intervals,
Statistical Tests, and Power? 25
https://replicationnetwork.com/2019/02/09/how-many-ways-can-you-misinterpret-p-values-confidence-intervals-statistical-tests-and-power-25/
Jensen Comment
The sad thing is that journal editors of leading accounting research journals
seem to not care --- they're addicted to P-values
**How to Mislead
With Statistics
Epic miscalls
and landslides unforeseen: The exceptional catalog of polling failure ---
https://theconversation.com/epic-miscalls-and-landslides-unforeseen-the-exceptional-catalog-of-polling-failure-146959
**How to Mislead
With Statistics
Stratified Sampling ---
https://en.wikipedia.org/wiki/Stratified_sampling
Mathematician Gary Cornell argues that current testing procedures won't
tell us much about vaccine efficacy for the elderly because sampling was not
stratified ---
https://garycornell.com/2020/10/22/we-are-unlikely-to-have-a-vaccine-that-is-proven-effective-for-seniors-for-a-long-time-unless-dramatic-action-is-taken-now/
**How to Mislead With
Statistics
Are We Witnessing a Major
Shift in the World of Work? ---
https://jborden.com/2021/04/29/are-we-witnessing-a-major-shift-in-the-world-of-work/
Jensen Comment
This article appears to be an example of how to mislead with statistics. The
sampling population was entirely made up of people working from home. Among
other things they apparently thought they worked "successfully" at home. Others
affected by their work may my not be inclined to label that remote work as
successful. Prime examples are teachers working at home who naively think they
are just as successful with remote students as they are with onsite students.
Many students and their parents, on the other hand, may not feel the same way by
the successfulness of remote teaching.
For example, one of the great benefits of having minority teachers teaching
minority students onsite is that the minority students can see and interact
face-to-face with their role models. Remotely, students can't even be sure that
their teachers are really from minority groups.
Another example is the set of auditors who think they are doing good work
remotely. Their employers and their clients possibly have a much different view
of their performance. I'm inclined to think that the physical presence of
auditors sometimes instills a fear factor to prevent fraud. If clients never
have visits from auditors (think of the Purchasing Department at WorldCom that
had not been visited by Andersen's auditors for years) they may have less fear
that their frauds will be detected.
I know you, Jim, are inclined to want work to be what makes employees
happiest. But worker happiness does not always correlate highly from standpoint
of happiness of customers, clients, and employers. Some (most?) workers should
be judged by people intended to benefit from that work.
Are takeout dinners in a restaurant really as good as when they are served
hot in the restaurant?
Worker happiness is only one of many very important work performance
criteria.
I'm inclined to think that most work
cannot be done remotely such that it's misleading to confine research on the
topic only to work that can possibly be done remotely?
**How to Mislead With
Statistics
New York University believes
it is the first private university to top 100,000 applications, with a 20
percent increase this year ---
https://www.insidehighered.com/quicktakes/2021/01/14/nyu-tops-100000-applications-freshmen?utm_source=Inside+Higher+Ed&utm_campaign=75badbc67c-DNU_2021_COPY_02&utm_medium=email&utm_term=0_1fcbc04421-75badbc67c-197565045&mc_cid=75badbc67c&mc_eid=1e78f7c952
Jensen Comment
Application numbers to prestigious universities can be misleading. It takes time
(think admission essay writing) and money (think submission fees) to apply to a
prestigious university, and submissions are often avoided by students who think
there is no hope of being admitted. And being rejected can hit ego quite hard.
An example, is a student who
does not apply to MIT, Harvard, or Stanford who thinks there's more hope of
being admitted to Columbia or NYU. Also some students have geographic
preferences where Columbia and NYU are top schools when you have a NYC
preference.
MIT, Harvard and Stanford are
ranked 1, 2, and 3 by US News for 2020 as being
the most selective USA universities ---
https://www.niche.com/colleges/search/all-colleges/?selectivity=extremelySelective&type=private&type=public
Columbia University in NYC
comes in at Rank 12 among the most selective universities.
New York University in NYC did not make the Top 40 in terms of being difficult
to get into as a first-year college student.
My point here is that
acceptance/rejection rates in college admissions can be misleading since many
very good students do not apply to all top colleges.
Getting into a prestigious
graduate school can be another matter.
I was rejected outright for being accepted to Stanford as a first-year
undergraduate. Five years later I was given a full-ride (tuition, room, and
board) scholarship to Stanford's Ph.D. program. I was even allowed to teach an
accounting course in the Economics Department at Stanford for money on top of my
scholarship. But I never forgot that I was rejected in my quest to be a freshman
at Stanford.
**How to Mislead With Headlines and Four-Letter Filth
Report: "Big 4 Firms Are Cesspools For Sexual Harassment,
Bullying, and Discrimination" ---
https://goingconcern.com/report-big-4-firms-are-cesspools-for-sexual-harassment-bullying-and-discrimination/
Jensen Comment
Although I sometimes find this Website useful, I'm generally repulsed by the
foul language and tabloid-nature of the site. For example, there are over one
million full-time employees of the Big Four firms worldwide. The above article
takes a few isolated, anecdotal, and hearsay examples, ,mostly from other
countries, of "sexual harassment, bullying, and discrimination" and makes a
headline leading us to believe all one million employees of the Big Four
multinational accounting firms are swimming in excrement. This is not
responsible journalism. It's tabloid sensationalism.
You can expect each and every one of over a million employees
in all parts of the world to always behave behave like heavenly angels during
each and every moment of their careers. These are human beings in different
cultures with different lifestyles (think Japan where there are separate train
cars for women who do not want to be pawed over by men in Japan's beehive
culture). Some bad things are going to happen among the million employees of Big
Four firms going to work every day around the world. This does not mean the Big
Four firms in general are "cesspools."
Three of the Big Four firms are among the very top
companies of the world for working moms at Ranks 4/100, 5/100,
8/100
And all four are in the 15-year Hall of Fame for working moms
---
https://www.workingmother.com/working-mother-100-best-companies-winners-2019
The Big Four firms are among the very best companies to work for in
general at Ranks 26/100, 34/100, 36/100, and 44/100
---
https://fortune.com/best-companies/
These are not "Cesspools for Sexual Harassment, Bullying, and
Discrimination."
**How to Mislead With
Statistics
Critics Say a Pair of
California Antibody Studies Contain Critical Statistical Errors That Produced
Implausible Results ---
https://reason.com/2020/04/22/critics-say-a-pair-of-california-antibody-studies-contain-critical-statistical-errors-that-produced-implausible-results/
Too many false positives, nonrandom study
population, and infection fatality rates out of whack with other data,
critics claim.
Two
studies by researchers associated with Stanford University and the
University of Southern California using antibody blood tests have estimated
that many more people have been infected with the novel coronavirus that
causes COVID-19 than confirmed diagnoses would indicate. How many more
people? In the Santa Clara (Silicon Valley) study, the researchers estimated
that coronavirus infections at the beginning of April were 50- to 85-fold
more than the number of confirmed cases at that time. In the Los Angeles
County study, they estimated the infection rate at 28 to 55 times higher
than confirmed cases in that jurisdiction.
If true, these findings
of vastly more widespread rates of infection would suggest that the disease
is much less lethal than the crude case fatality rates suggest. (A point
noted by
me
and other Reason
colleagues
in reporting on these studies.) Not surprisingly, these findings have proved
quite controversial,
particularly drawing the
critical attention
of
statisticians
from other institutions.
Since the
Los Angeles County study
has apparently not yet been published online, let's focus on the chief
objections to the Santa Clara study. Those include arguments that (1) the
prevalence rates among people tested for antibodies to coronavirus published
in the study are mostly, or even entirely, very likely due to false
positives; (2) the results are skewed because it was enriched with
participants who were more likely to have been exposed to the virus than the
general population of the county; and (3) that COVID-19 infections must be
very widespread to produce the excess mortality seen in places like New York
City, e.g, essentially most New Yorkers must already have been infected,
suggesting an unprecedented level of contagiousness.
First,
let's look at the problem of false positives. The researchers' blood test
survey in Santa Clara County found that 1.5 percent (50 out of 3,330 people
tested) were positive for the presence of antibodies to the coronavirus. So
the question is, how many of the 50 positives they found might be false
positives?
Continued in article
**How to Mislead With Statistics
Paradoxes of Probability & Statistical Strangeness
https://scitechdaily.com/paradoxes-of-probability-statistical-strangeness/?fbclid=IwAR3JlsjucUeAQg8LeYTFvSoGJcFWpovSvr3gnB4CM99Ekihr-_FTuXlTQOo
Thank you Jagdish Gangolly for the heads up
Simpson's Paradox
Base Rate Fallacy
Will Rogers Paradox
Berkson's Paradox
Multiple Comparisons Fallacy
**How to Mislead With
Statistics
Post-tenure Law Professors in
the USA ---
http://www.americanbarfoundation.org/uploads/cms/documents/after_tenure_report-_final-_abf_4.1.pdf
MIND THE GAP: GENDER PAY
DISPARITIES IN THE LEGAL ACADEMY
https://privpapers.ssrn.com/sol3/papers.cfm?abstract_id=3699208&download=yes
A
wealth of research has demonstrated that the gender wage gap in the legal
profession is both pervasive and persistent. Our investigation of a rich and
unique dataset of tenured law professors reveals gender stratification in
the legal academy, clearly demonstrated by our finding that tenured women
law professors—and especially women of color—receive lower compensation than
their male colleagues. We find evidence that women law professors are very
likely to earn lower salaries and additional income than men, even when they
both enjoy the same protection of tenure. 126 Moreover, we find that
gendered earnings disparities are experienced more acutely by women of
color. In addition to documenting that gendered earnings disparities exist,
it is important to examine the mechanisms that underly these persistent
forms of gender—and racialized—inequality. 127 Our findings demonstrate the
salience of human capital and social capital in mediating the relationship
between gender and earnings in the legal academy.
Jensen Comment
Firstly, the fact that the American Statistical Association now tends to
discourage rather then encourage p-value analysis of statistical inference data
is never mentioned by the authors as they continue to rely on somewhat dubious
p-values
Time to say goodbye to “statistically significant” and
embrace uncertainty, say statisticians ---
https://retractionwatch.com/2019/03/21/time-to-say-goodbye-to-statistically-significant-and-embrace-uncertainty-say-statisticians/
Three years ago, the American Statistical Association (ASA) expressed
hope that the world would move to a “post-p-value
era.”
The statement in which they made that recommendation has been cited more
than 1,700 times, and apparently, the organization has decided that
era’s time has come. (At least one journal had already banned
p values by 2016.)
In an editorial in
a special
issue of
The American Statistician out today, “Statistical Inference in the 21st
Century: A World Beyond P<0.05,” the executive director of the ASA, Ron
Wasserstein, along with two co-authors, recommends that when it comes to
the term “statistically significant,” “don’t say it and don’t use it.”
(More than 800 researchers signed onto a piece
published in Nature yesterday calling
for the same thing.) We asked Wasserstein’s co-author, Nicole
Lazar of the University of Georgia,
to answer a few questions about the move.
So the ASA
wants to say goodbye to “statistically significant.” Why, and why now?
In the past few
years there has been a growing recognition in the scientific and
statistical communities that the standard ways of performing inference
are not serving us well. This manifests itself in, for instance, the
perceived crisis in science (of reproducibility, of credibility);
increased publicity surrounding bad practices such as
p-hacking (manipulating the data until statistical significance can be
achieved); and perverse incentives especially in the academy that
encourage “sexy” headline-grabbing results that may not have much
substance in the long run. None of this is necessarily new, and indeed
there are conversations in the statistics (and other) literature going
back decades calling to abandon the language of statistical
significance. The tone now is different, perhaps because of the more
pervasive sense that what we’ve always done isn’t working, and so the
time seemed opportune to renew the call.
Much of the
editorial is an impassioned plea to embrace uncertainty. Can you
explain?
The world is
inherently an uncertain place. Our models of how it works — whether
formal or informal, explicit or implicit — are often only crude
approximations of reality. Likewise, our data about the world are
subject to both random and systematic errors, even when collected with
great care. So, our estimates are often highly uncertain; indeed, the
p-value itself is uncertain. The bright-line thinking that is emblematic
of declaring some results “statistically significant” (p<0.05) and
others “not statistically significant” (p>0.05) obscures that
uncertainty, and leads us to believe that our findings are on more solid
ground than they actually are. We think that the time has come to fully
acknowledge these facts and to adjust our statistical thinking
accordingly.
Continued in article
Secondly, in a survey sample of
1,210 tenured law professors, 378 are people of color. Among those 378, roughly
100 are Women of Color that includes African Americans, Asians, Hispanics, etc.
In comparison there are 278 Males of Color.
Keeping in mind that there are
over 4,500 tenured law professors in the USA, most any inferences from a
non-random sample of 1,210 respondents must be suspect. For example, are
disgruntled respondents more apt to have completed this survey? There's
some evidence of a higher response rate among Women of Color than among White
Men ---
http://www.americanbarfoundation.org/uploads/cms/documents/after_tenure_report-_final-_abf_4.1.pdf
The reason may be that Women of Color are more disgruntled among tenured law
faculty.
Table 14 is a key table
featured in the conclusions of this study. The focus is mainly on the average
salary differences between Women of Color and the other average salary groupings
in the study. The study does not devote much attention to the outcome where Men
of Color have very nearly the same average salary as White Men. This should be
more praiseworthy than is given by the authors in the study. Instead the focus
of this study is on how Women of Color and White Women have a lower average
salary differences than both Men of Color and White Men. This finding supports
other studies in law schools showing women faculty are paid less on average.
This has been the basis of a number of lawsuits against lawsuits, some of which
have been successful for the women who sued.
The authors in the study do not
focus on the implications that average salary standard error measures for both
Women of Color and Men of Color are much higher than for White Men and White
Women? What do these larger standard errors imply?
For me, higher standard errors suggest that outliers may be having more impact
on both Women and Men of Color.
This is one of those studies
where I tend to agree with the conclusions even though those conclusions are
supported by some rather doubtful statistical inference mumbo jumbo.
What is more disturbing to me
is that women are less likely to reach the top in our largest and most
prestigious law firms.
"Why Do So Few Women Reach the Top of Big Law
Firms?" by Timothy L. O'Brien, The New York
Times, March 19, 2006 --- http://www.nytimes.com/2006/03/19/business/yourmoney/19law.html
Although the nation's law
schools for years have been graduating classes that are almost evenly split
between men and women, and although firms are absorbing new associates in
numbers that largely reflect that balance, something unusual happens to most
women after they begin to climb into the upper tiers of law firms. They
disappear.
According to the National
Association for Law Placement, a trade group that provides career counseling
to lawyers and law students, only about 17 percent of the partners at major
law firms nationwide were women in 2005, a figure that has risen only
slightly since 1995, when about 13 percent of partners were women.
Even those who have made
it to the top of their profession say that the data shows that women's legal
careers involve distinct, often insurmountable hurdles and that those
hurdles remain misunderstood or underexamined.
"You have a given
population of people who were significantly motivated to go through law
school with a certain career goal in mind," says Ms. Plevan, who notes that
Proskauer has always provided her with a welcoming professional home. "What
de-motivates them to want to continue working in the law?"
FOR years, one pat
response to that question was that once law school graduation rates
substantially equalized between men and women, that pipeline would fuel firm
diversity and cause partnerships to equalize as well. Yet the pipeline has
been gushing for about two decades and partnership disparity remains.
Although women certainly
leave firms to become more actively involved in child-rearing, recent
detailed studies indicate that female lawyers often feel pushed into that
choice and would prefer to maintain their careers and a family if a
structure existed that allowed them to do so. Some analysts and many women
who practice law say that having children isn't the primary reason most
women leave law firms anyhow; most, they say, depart for other careers or
for different ways to practice law.
"Firms want women to
stay. Men at the firms want women to stay, and women want to stay. So why
aren't they?" asks Karen M. Lockwood, a partner at Howrey in Washington.
"Law firms are way beyond discrimination — this is about advancement and
retention. Problems
with advancement and retention are grounded in biases, not discrimination."
With law firms courting
major corporations that demand diversity within the ranks of those advising
them, and with women increasingly dominating the top tiers of law school
graduates, veteran lawyers say that promoting women's legal careers is not
just a matter of goodwill or high-mindedness. It's also a winning business
strategy.
. . .
Research conducted by the
Project for Attorney Retention, a program sponsored by the University of
California's Hastings College of the Law, has also identified an inflexible,
billable-hours regime as an obstacle to job satisfaction for both sexes, a
trend that is more pronounced among the most recent crop of law school
graduates. Some veteran lawyers witness this dissatisfaction firsthand and
say that it tugs more powerfully at women than men because of social
expectations about household roles and child-rearing.
We are very accommodating
with leaves and flexible schedules, and even with that we still lose women,"
says Edith R. Matthai, who founded a Los Angeles law firm, Robie & Matthai,
with her husband in 1987. "I think the pressures on women from spouses,
family, peers, schools and others is huge.
"I think the real
solution is a reassessment of the role that women play in the family," adds
Ms. Matthai, who is president of the Los Angeles County Bar Association.
"One thing we need is a sense of shared responsibilities for the household
and, most importantly, shared responsibilities for taking care of the kids."
Ms. Matthai said that
conditions for women had improved a good deal over the last 30 years, but
added: "We have a long way to go. It's my dream that more women will stick
it out in the law until they get to the fun part, and it just breaks my
heart to see them giving up the dream."
Research conducted by the
New York City Bar Association and other groups indicate that women who
temporarely give up their professional dreams to pursue child-rearing or
other personal goals have a difficult, if not impossible, time finding
easily available on-ramps when they choose to re-enter the legal world.
Continued in article
**How to Mislead With
Statistics
Here are the average
retirement savings by age: Is it enough? ---
https://www.marketwatch.com/story/here-are-the-average-retirement-savings-by-age-is-it-enough-2020-11-16?mod=home-page
Jensen Comment
The first thing to do is have your students explain the wide disparity of means
and medians in this data.
Next have students how outliers
can distort statistical inference.
Black Swans ---
https://en.wikipedia.org/wiki/The_Black_Swan:_The_Impact_of_the_Highly_Improbable
**How to Mislead With
Statistics
What you need to know about
hydroxychloroquine, Trump’s new favorite treatment for Covid-19 ---
https://www.vox.com/2020/3/20/21188433/coronavirus-hydroxychloroquine-chloroquine-covid-19-treatment
Jensen Comment
I have numerous illustrations of misleading articles based upon anecdotal
evidence and exceedingly small samples ---
http://faculty.trinity.edu/rjensen/MisleadWithStatistics.htm
Scientists are rarely, if ever, satisfied with anecdotal evidence. However, they
often find such evidence extremely important.
In
the case of hydroxychloroquine and Covid-19 early evidence there are now more
scientific studies taking place. Also the early positive evidence led to Bayer's
donation of over one million units to hospitals around the world for more
experimentation.
But always beware of false hopes from anecdotal evidence. I'm reminded of the
well-known actor Steve McQueen's reaction when he was pronounced to be
terminally ill with cancer. He quickly went down to Mexico for treatments of an
entirely unproven regimen that supposedly might save his life. As is so often
the case, his hope was a false hope.
Let's hope that the tentative hope for hydroxychloroquine is not a false
hope. And let's hope there is continued effort to find even more effective
alternatives.
**How to Mislead With Statistics
Do Most Academics Fib on Their Resumes?
https://www.chronicle.com/article/Do-Most-Academics-Fib-on-Their/247376?utm_source=at&utm_medium=en&cid=at&source=ams&sourceId=296279
Maybe it’s a tiny embellishment — say, turning yourself into a first author
rather than the second. You might list an article that hasn’t yet been
accepted by a journal as “in press.” Or maybe it’s a bigger lie, like
inventing a paper that doesn’t exist.
A
recent study
of 180
academic curricula vitae found that 56 percent that claimed to have at least
one publication contained at least one unverifiable or inaccurate
publication, and it suggests that CV falsification could be much more common
than scholars committed to professional integrity might hope. The study is
small — the 56 percent reflects only 79 CVs, of 141 that claimed to have at
least one publication. The researchers behind the study make no presumption
as to whether the errors were intentional.
While it has popped up in a few high-profile cases, CV falsification is an
instance of academic misconduct that might not make as many headlines as
fudging data or plagiarism. But the difficulty of detecting it could make it
all the more insidious.
The findings “are concerning enough that they would warrant a larger, more
comprehensive look at what’s going on,” said Trisha Phillips, a co-author of
a paper describing the study and an associate professor of political science
at West Virginia University who studies research ethics. She and her
colleagues write in the paper that in the “increasingly social world of
science, researchers need to trust their collaborators,” but if what they’ve
found is any indication, “this trust might not be well placed.”
‘Inaccurate in a Self-Promoting Way’
One
high-profile case of CV falsification occurred at Phillips’s home
institution in 2014. West Virginia University
had been poised to promote
Anoop Shankar, a rising star in epidemiology, to department chair when
officials found that Shankar had crafted more than a few of his credentials.
Turns out he didn’t have a Ph.D., nor was he the author of many of the
papers listed on his CV. After the Shankar incident, and a few of their own
encounters with CV falsification, Phillips and her co-authors — R. Kyle
Saunders, Jeralynn Cossman, and Elizabeth Heitman — were spurred to explore
the prevalence of such misrepresentation.
A literature review turned up plenty of findings on falsification in health
sciences, including that an average of 22 percent of applicants to medical
residency and fellowship programs had falsified research citations. There
didn’t seem to be any research in other areas of academe, so Phillips’s team
decided to run their pilot study.
With permission from the institution in question — an unnamed land-grant
doctoral university — they collected 1,837 unsuccessful applicants’ CVs from
the 2015-16 academic year and reviewed a randomly selected 180. Of those,
141 claimed to have published at least one work — a journal article, book,
or book chapter — and 79 of those were deemed “unverifiable or inaccurate in
a self-promoting way.”
Continued in article
Jensen Comment
I don't disagree that a relatively high proportion of academics cheat on their
resumes. But sample size of 180 means that many disciplines had two or less test
cases. This is important, because I think cheating varies somewhat by
discipline. For example, in disciplines like medical science where outside
research funds are readily available, there's "gold in them thar hills." We need
a much larger sample possibly with stratified sampling.
It's much more common for academics to cheat in other ways. One of the most
common ways these days is for a given publication with multiple authors to have
highly variable academic contribution to that particular article. Much more
common is for these authors to write multiple articles where the academic
contributions vary between articles to more evenly spread workloads while
increasing the odds that at least one of the papers will get published and to
lengthen the publication record for all authors if more than one of the papers
gets published. Sometimes a senior author wanting to help a non-tenured
colleague get tenure will tack that colleagues name to a paper where the
colleague contributed very little other than proof reading.
It's also common for one or more joint authors to contribute to a paper in a
questionable academic way. One of the joint authors may have provided funding
and little else to the academic contents of a particular paper. One of the joint
authors may have a stellar reputation that helps a paper get published when that
author actually contributed little else to the paper. One of the joint authors
may have had access to the data or statistical testing/programming while
contributing little else to the paper.
Suitcase Paper
And there are ways of cheating other than publishing. An extreme case is to have
authored a pretty good paper with no intent of publishing the paper. Instead it
is a suitcase paper. Then that paper can be presented at multiple conferences
over time, especially conferences in popular tourist sites in Europe, Canada,
New Zealand, Australia, etc. I know one professor who had a suitcase paper that
he dusted off every time he wanted to buy a new Mercedes. He would then get his
university to pay for his participation in an obscure European conference where
he bought a new car, tooled around Europe for a bit, and then had the car
shipped back to the USA when he could save money relative to what a new Mercedes
costs in the USA.
Bob Jensen's threads on academic cheating are at
http://faculty.trinity.edu/rjensen/Plagiarism.htm
**How to Mislead With Statistics
Here are the top 3 colleges in America for a return on your investment —
and not one is in the Ivy League ---
https://www.marketwatch.com/story/the-top-3-colleges-in-america-with-returns-on-investment-of-over-2-million-and-none-are-ivy-league-institutions-2019-11-14
See
the full table at
ttps://cew.georgetown.edu/cew-reports/CollegeROI/
The survey names these colleges as
giving the biggest return on investment after four decades: Albany College
of Pharmacy and Health Sciences, St. Louis College of Pharmacy,
Massachusetts College of Pharmacy and Health Sciences, Massachusetts
Institute of Technology, Stanford University, Maine Maritime Academy,
Harvard University, United States Merchant Marine Academy, Babson College
and Georgetown University.
Of the
10 colleges with the best long-term net economic gain after 40 years, all
are four-year institutions, and eight are private nonprofit institutions,
the report said. The colleges that predominantly offer certificates or
associate’s degrees have the highest return on investment 10 years after
enrollment.
Two public four-year institutions, Maine Maritime Academy and the U.S.
Merchant Marine Academy, rank in the top 10 colleges with the best long-term
returns, while two four-year private colleges, St. Louis College of Pharmacy
and Albany College of Pharmacy and Health Sciences, made the top 10 for
short-term and long-term returns.
The report ranks 4,526 colleges and universities by return on investment.
Institutions with the highest returns after 10 years yield $1 million, and
sometimes $2 million, after 40 years, exceeding the median 40-year returns
of private institutions.
The survey names these colleges as giving the biggest return on investment
after four decades: Albany College of Pharmacy and Health Sciences, St.
Louis College of Pharmacy, Massachusetts College of Pharmacy and Health
Sciences, Massachusetts Institute of Technology, Stanford University, Maine
Maritime Academy, Harvard University, United States Merchant Marine Academy,
Babson College and Georgetown University.
Overall, returns on investment from bachelor’s degrees eventually overtake
returns from most two-year credentials, it added. Case in point: Babson
College, a private institution in Wellesley, Mass., ranks 304th in net
present value at the 10-year mark, but it rises to seventh after 40 years.
“Everyone is asking, ‘Is college worth it?,’” said Anthony Carnevale, the
lead author and director of Georgetown’s Center on Education and the
Workforce. “This kind of information on the costs and benefits of higher
education holds institutions more accountable.”
Return on Students' Investments (in college degrees) Varies Over Time
(think 10 versus 40 years out) ---
https://www.insidehighered.com/news/2019/11/14/differences-college-roi-vary-institution-type-and-time-frame-measured-report-says?utm_source=Inside+Higher+Ed&utm_campaign=e500c9d4ce-DNU_2019_COPY_02&utm_medium=email&utm_term=0_1fcbc04421-e500c9d4ce-197565045&mc_cid=e500c9d4ce&mc_eid=1e78f7c952
Jensen Comment
One of the most misleading types of conclusions in statistical analysis is
treating samples from non-homogenous populations as if they are homogeneous. You
cannot in most ways compare specialized pharmacy colleges or maritime academies
with general universities like Harvard University and Dartmouth College. You
cannot compare Ivy League graduates from high income families with graduates
from a state university who could not afford college without the GI bill or
other forms of financial aid. Ted Kennedy had a tough time an college and
cheated at Harvard, but with his trust fund he was always going to be wealthy
even when on a relatively low-paying government payroll ---
http://content.time.com/time/politics/article/0,8599,1919041,00.html
Actually ROI in a college education varies over a mind=boggling number of
things. In fairness Inside Higher Education article points out some of the limitations of its ROI calculations
in this article.
Let's consider some other ways to be mislead.
Firstly, there's a problem regarding which degree? A student who majors in
history as an undergraduate is likely to have a different ROI if an investment
is also made in a law degree or a MBA. Majoring in biology alone is not the same
as also becoming a MD later on.
Secondly, when dealing with means there's a huge problem with impact of
distribution skewness and outliers. Also I think that For example, college
graduates are more likely to have outliers on the high end of salary than
workers who did not go to college. These outliers pull up the mean beyond what
can be expected for the truly "average" college graduates. The distributions are
also impacted by parents who drop out of the job market to raise children.
Thirdly, and most importantly, perhaps college graduates "on average" are
more likely to make higher incomes in life. First their parents who helped fund
their college might have been otherwise able to fund them in businesses. Second
if they're motivated to succeed in college and have the mental skills to do so
they're more apt to make more money than students who did not go to college.
My point is that it's misleading to read the conclusions of this study and
conclude that college graduation causes higher higher incomes in life. Although
in some cases that's obvious for some types of graduates such as doctors and
lawyers that must graduate from college to become licensed professionals, it's
also not obvious in most instances when there are so many other interactive
factors affecting lifetime incomes.
**How to Mislead With Statistics
32 Worst Cities to Find a Job for Recent Graduates ---
https://247wallst.com/special-report/2019/08/27/32-worst-cities-to-find-a-job-for-recent-graduates/
Jensen Comment
Of course Auburn, AL is going to be flooded with job applications from
recent graduates relative to Asheville, NC.
The best way to mislead is to ignore distortions in sampling populations. It
would seem that communities where jobs are most difficult to find are university
towns flooded with recent graduates every semester. Firstly, recent graduates
are not always ready to leave the towns where they graduate. Exhibit A is
comprised of graduates whose spouses/partners are still enrolled in the
universities. School districts in university towns are usually much higher rates
of teacher applications than average communities, especially when the university
town are relatively small compared to where urban universities are located.
Recent graduates also generally like living in the university communities where
they graduated. The bottom line is that university small and medium sized towns
are not at all typical of small and medium sized towns in general.
Secondly, the largest employers of recent graduates are seldom located in or
even near small and medium sized towns where large universities are located. For
example, recent accounting graduates generally most often are seeking to start
their careers with largest CPA firms in order to get training, experience, and
client exposure. But those largest firms seldom have offices in small and medium
sized university towns. Those small CPA firms that are located in university
towns are usually flooded with applications from new accounting graduates not
wanting to leave town,
**How to Mislead With Statistics
The countries where economists
exhibit the highest (economics) ideological bias are Ireland, Japan, Australia,
and Scandinavia, where for Austria, Brazil, and Italy the ideological bias is
smallest. South Africa, France, and Italy are most conformist to mainstream
opinion ---
https://marginalrevolution.com/marginalrevolution/2019/09/ideological-bias-and-argument-from-authority-among-economists.html
Jensen
Comment
The first thing I would examine in terms limitations of the survey is that small
samples within each nation may lead to misleading outcomes, especially since
economists are so widely different even within a given nation. Keep in mind that
economists are often educated outside their own nations such as when Japanese
economists do their graduate studies in the USA and South Africans study in the
United Kingdom. Keep in mind that Scandinavian countries are proudly capitalist
while French academics are often socialist. My point is that the "ideologies"
are often misconstrued by nation.
**How to mislead with statistics
Measuring Learning Outcomes from Getting an Economics Degree ---
https://blog.supplysideliberal.com/post/2019/9/26/measuring-learning-outcomes-from-an-economics-degree
Jensen Comment
Disciplines with licensure examinations (think law, medicine, accountancy,
nursing, pharmacy, engineering, etc.) can look at licensing examination
performance of recent graduates. However, such outcomes can be misleading when
graduates invest in coaching courses after graduation. Coaching courses mixed
with college courses confound the licensing examination outcomes.
There's also possible bias. For example, accountancy masters programs at
flagship universities often have the be best CPA examination passage rates.
However, there are two sources of bias. One is that there is so much demand to
major in accountancy at a flagship university that that university sometimes
puts of barriers to entry along the way such as having to have a 3.5 gpa to
major in accounting or to get into a masters program. The bias here is that we
expect top students to have better licensing examination success even if their
alma maters did a rather poor job preparing them to take the licensing
examinations.
There's also possible bias in that flagship university students are often
preferred by recruiters of the largest multinational CPA firms, and those firms
often invest more in getting their newly-hired employees licensed. The firms may
pay for the best coaching courses and even conduct some of their own coaching
courses. Once again a flagship school may do a lousy job preparing students for
the licensing examination, but the employers of their graduates make up for lost
time.
There can also be sample size issues. For 24 years I taught in the
accountancy program at Trinity University. Our masters of accounting program was
very small (sometimes less than 20 students), and on some CPA exam dates we had
less than ten students taking the exam.. Sometimes our CPA examination
performance average was at or near the top forTexas. Other times is was below
average. The reason is that our licensing exam performance standard deviation
was was much greater due to sample size relative to the large mills like the
University of Texas at Austin and Texas A&M.
Lastly, I might add that the success of a college program lies in more than
examination performance and grades. In higher education we pride ourselves in
making students eager for more learning. Some of the best academic programs
should be judged on the basis of what graduates learned after graduation rather
than what they learned before graduation. Sometimes we have to wait to hear what
post-graduate award winners have to say about why they think they won those
awards.
**How to mislead with statistics (small and unreliable samples)
This Year’s 2019 CDC Gun Injury Data Is Even Less Reliable Than Last Year’s ---
https://fivethirtyeight.com/features/this-years-cdc-gun-injury-data-is-even-less-reliable-than-last-years/
. . .
But that number is suspect, in part because the agency
sources its data from a small number of hospitals: just 60 in 2017,
according to data obtained in a public records request by The Trace and
FiveThirtyEight. Drawing data from such a small pool means that a single
hospital that treats a disproportionate number of gun injuries has the
potential to drastically skew the entire estimate. In contrast, the
Healthcare Cost and Utilization Project
(HCUP), another database under the Department of Health and Human Services,
uses data from more than 950 hospitals to create its own gun injury
estimate, which contains much less uncertainty than the CDC’s. HCUP’s
website also prevents users from accessing any estimate with a coefficient
of variation greater than 30 percent.
Despite the issues with the CDC’s data, many academics
have cited it in their work. Our
previous reporting
identified at least 50 research papers that have cited the CDC’s gun injury
numbers since 2010.
“I
would not cite these estimates,” Guohua Li, editor-in-chief of the medical
journal Injury Epidemiology and director of Columbia University’s Center for
Injury Epidemiology and Prevention, told The Trace and FiveThirtyEight. “As
an editor, I would not publish any manuscript that is based on these
estimates.”
Li
says that the CDC could correct the uncertainty of its estimates by
incorporating data from a much larger and more reliable source like HCUP.
“If they want to fix it, I think it is definitely doable,” Li said.
Lenard,
the CDC spokesperson, said that HCUP’s data sets have their own limitations
and that making any changes to the database that underlies the CDC’s
estimates would depend on congressional funding.
Li
doesn’t believe that the limitations of HCUP’s data are significant enough
to keep the CDC from using it.
“The
data quality has become more important than ever, so they should really pay
immediate attention to this issue and get it improved,” Li said.
My new Web site on illustrations of misleading
statistics ---
http://faculty.trinity.edu/rjensen/MisleadWithStatistics.htm
**How to Lie With Statistics and Mislead Readers
"Missing the (Grade) Point," by Scott Jaschik, Inside Higher Ed,
May 20, 2013 ---
http://www.insidehighered.com/news/2013/05/20/study-challenges-data-and-ideas-behind-grade-inflation-higher-education
. . .
Stuart Rojstaczer, a retired professor at Duke
University who has written extensively about grade inflation (arguing
that it is a real problem), said his data and
other studies show a different story. The period in which the authors argue
for grade deflation was one in which "every published paper" has found grade
inflation, Rojstaczer said. He said that he doesn't "know where the error
is," but believes there is a "huge error" in the data. Rojstaczer said via
e-mail that he believes the new paper has "no value."
Continued in article
Jensen Comment
The first way to lie with statistics is to cherry pick the data to be sampled.
Excluding two-year colleges and all colleges and universities that have at least
one masters or doctoral program pretty much excludes the world of higher
education.
Secondly, many students who leave a college before completing ten credits do
so because they are failing or received very low grades in the first course or
two. Including, for example, a student who failed three courses and withdrew
from a college skews the mean way down due to the F grades.
Indeed this research paper has negative value because it is so misleading.
It's like the authors completely ignored the research demonstrating grade
inflation in higher education ---
http://www.trinity.edu/rjensen/HigherEdControversies.htm#GradeInflation
**How to Mislead With Statistics
Many of Obamacare's 'Eight Million Enrollments' are Duplicates ---
https://townhall.com/tipsheet/guybenson/2014/05/07/confirmed-many-of-obamacares-8-million-enrollees-are-duplicates-n1834786
**How to Mislead With Statistics (Small Sample, Missing Variables)
When you are dealing with a giant investment conglomerate to reveal all the
details might take over a million pages in an annual repor6t.
The following article is a little like writing about the performance of
superstar LaBron James for this season by focusing on two or three of his games
---
http://en.wikipedia.org/wiki/LeBron_James
Two or three games do not make a season's performance.
**How to Mislead With Cherry
Picking
Debunking the Capitalist Cowboy ---
http://bostonreview.net/class-inequality/nan-enstad-debunking-capitalist-cowboy
Jensen Comment
This article is an example of politically-motivated cherry picking.
The article focuses on the long-ago past of robber barons. It totally ignores
such "cowboys" as Bill Gates, Steve Jobs, Elon Musk, and the other billionaires
who rose to great wealth more ethically.
The article totally ignores the
rags to riches stories of the many billionaire capitalists in modern China.
While a
move is underway to destroy the American Dream of rags to riches (by taxing away
the riches) the Chinese dream is on the rise.
The Chinese Dream
How a Chinese billionaire went from making $16 a month in a factory to being one
of the world's richest self-made women with an $8.3 billion real-estate empire
---
https://www.businessinsider.com/worlds-richest-self-made-woman-wu-yajun-net-worth-2019-2
Top 50 Billionaires in China ---
https://en.wikipedia.org/wiki/List_of_Chinese_by_net_worth
Jensen
Comment
The question for students to critically debate is why a
supposed communist country allows so many billionaires to rise up from poverty.
That's supposed to happen in the USA where a child growing up in deep
poverty (think Oprah Winfrey or Howard Shultz) became a multi-billionaires.
But is it also supposed to happen under communism? If
so, why?
**How to Mislead With Statistics
Tell The New York Times that Black Friday sales were not down 11% ---
http://www.ritholtz.com/blog/2014/12/no-black-friday-sales-were-not-down-11/
**How to Mislead With Statistics
Children’s average allowance in 2019: $120 a month ---
https://www.journalofaccountancy.com/news/2019/oct/average-child-allowance-2019-201922088.html?utm_source=mnl:cpald&utm_medium=email&utm_campaign=01Oct2019
Jensen Comment
How could this conclusion possibly be misleading? Firstly, it's an average based
upon an unknown distribution that may must have a huge standard deviation,
outliers (think of all the families that do not pay a cash allowance), and
variations over time (there are weeks where a given child gets less allowance or
more allowance. And there are variations in what students must buy with their
allowances and duties they must perform for their allowances. Some have to buy
their own ski lifet tickets, equipment, and clothing, including tennis shies,
whereas others get many things like clothing extra. Some are required to save
portions of allowances.
The bottom line is that "allowances" are not fungible items in sampling
distributions.
*
*How to Possibly Mislead With Statistics
(misleading statistical inferences for large samples) ---
“And 1” More Piece of Evidence of Discrimination Against Black Basketball
Players ---
https://www.tandfonline.com/doi/full/10.1080/10646175.2018.1491434
Jensen Comment
I did not study the methodology of this study in enough detail to conclude that
the conclusions are misleading or at least somewhat misleading.
However, some of the things I would look for in a more detailed analysis
include the following:
Apart from controversies of z-score normalization, I wonder if the
"statistical significances" are substantially significant given the sample
sizes.
Assuming that half the games are home games for the black schools I
wonder what proportion of the referees in those schools were black referees?
This suggests the possibility that most fouling differences were real rather
than prejudicial for half the games. .
The article does not reference the new challenges to statistical
inference testing in science ---
http://faculty.trinity.edu/rjensen/theory01.htm#WhatWentWrong
Based upon my cursory scanning of this article I cannot conclude that the
article is misleading. The references to the article suggest that there are a
variety of prejudices to black players that are very real phenomena. There is a
possibility that this study does not really show what it intends to show.
**How to Mislead With Headlines
The Going Concern Website asserted that this is: "Yet another sign that
most MBAs are worthless. ."
http://goingconcern.com/post/footnotes-why-are-auditors-different-pwc-acquires-humanr-life-deloitte-sometimes-includes-book
This is misleading, because the scandal concerns a diploma mill where degrees
are purchased and not earned.
"Dog Earns MBA---But Can He Deduct It On His Taxes?" Forbes,
October 23, 2013 ---
http://www.forbes.com/sites/robertwood/2013/10/23/dog-earns-mba-but-can-he-deduct-it-on-his-taxes/
Jensen Comment
Diploma mill degrees are indeed worthless unless employers are too dumb to know
the difference between a purchased college degree from on that is earned with
lots of time and sweat.
Bob Jensen's threads on diploma mills ---
http://www.trinity.edu/rjensen/FraudReporting.htm#DiplomaMill
**How to Mislead With Statistics
"Why Economists Can’t Always Trust Data," Fiscal Times, June 3,
2014 ---
http://www.thefiscaltimes.com/Columns/2014/06/03/Why-Economists-Can-t-Always-Trust-Data
To make progress in economics, it is essential that
theoretical models be subjected to empirical tests that determine how well
they can explain actual data. The tests that are used must be able to draw a
sharp distinction between competing theoretical models, and one of the most
important factors is the quality of the data used in the tests.
Unfortunately, the quality of the data that economists employ is less than
ideal, and this gets in the way of the ability of economists to improve the
models they use. There are several reasons for the poor quality of economic
data:
Non-Experimental Data: Economists do not have the
ability to perform experiments, except in a very limited way. Instead, they
must rely upon historical data. This makes tests of theoretical models much
more difficult to conduct.
A chemist can, for example, go the lab and perform
experiments again and again and this has several advantages. To see the
advantages, suppose there are two chemicals that combine imperfectly, and
the investigator would like to know the temperature that produces the most
complete chemical reaction.
The first advantage is that in a laboratory, the
air pressure, amount of oxygen in the air, the temperature, and so on can be
controlled as the chemicals are combined.
When using historical, real-world data this is not
possible. All of the factors will vary –– they cannot be held constant
unless the researcher is lucky enough to encounter a “natural experiment”
where “all else equal” holds and that is rare –– and the inability to hold
“all else equal” confounds the tests. It is still possible to add controls
that try to capture the other factors that might influence the outcome, but
one can never be sure that this has been done sufficiently well to allow
clean statistical tests.
The second advantage is that the experiment can be
repeated many, many times so that any randomness in the outcome of
individual experiments can be averaged out. In the experiment above, for
example, the chemicals could be combined 1,000 times at each temperature,
and then the outcomes averaged to smooth out the noise in individual
experiments.
In economics there
is simply no way to, for example, run an experiment where the Great
Recession occurs thousands of times and various policy interventions are
implemented to see what type perform the best. Economists are stuck with a
single historical realization, and can never be sure the extent to which the
outcome is due to randomness or inadequate controls.
Surveys, Revisions, and
Real-Time Data:
Economic data is usually based upon surveys rather than a full tabulation of
the variable of interest. Unemployment data, for example, is based upon
a monthly sample of approximately 60,000 households.
In some cases, as with GDP, the data arrive with a substantial time lag
leading to revisions as new data clarifies the picture. For GDP, there is an
advance estimate based upon data that is available one month after the end
of a quarter, followed by second and third estimates released after two and
three months later. There is also a first annual estimate released in the
summer incorporating further new data, and there are subsequent annual and
five-year revisions.
In economics there is simply no way to, for example,
run an experiment where the Great Recession occurs thousands of times
and various policy interventions are implemented to see what type
perform the best. Economists are stuck with a single historical
realization, and can never be sure the extent to which the outcome is
due to randomness or inadequate controls.
Surveys, Revisions, and Real-Time Data: Economic data is usually
based upon surveys rather than a full tabulation of the variable of
interest. Unemployment data, for example, is based upon
a monthly sample of
approximately 60,000 households. In some cases, as with GDP, the
data arrive with a substantial time lag leading to revisions as new data
clarifies the picture. For GDP, there is an advance estimate based upon
data that is available one month after the end of a quarter, followed by
second and third estimates released after two and three months later.
There is also a first annual estimate released in the summer
incorporating further new data, and there are subsequent annual and
five-year revisions.
- See more at: http://www.thefiscaltimes.com/Columns/2014/06/03/Why-Economists-Can-t-Always-Trust-Data#sthash.XKizjNmC.dpuf
See more at:
http://www.thefiscaltimes.com/Columns/2014/06/03/Why-Economists-Can-t-Always-Trust-Data#sthash.SDS9IFGX.dpuf
Jensen Comment
Much of the problem in the social sciences, and economics and investing in
particular, is that if models predict those affected by the predictions may
change their behavior. Social science research is sometimes very unstable.
Another problem is that there are so many missing variables that are incorrectly
assumed to be insignificant. And there's a huge problem of interdependency among
model variables is often ignored by researchers desperate to imply findings of
causality.
**How to Mislead With Statistics (distortion, misuse of the
word "proof")
"The Proof Liberal Arts Colleges Need?" by Scott Jaschik, Inside
Higher Ed, January 22, 2016 ---
https://www.insidehighered.com/news/2016/01/22/study-traces-characteristics-undergraduate-education-key-measures-success-life?utm_source=Inside+Higher+Ed&utm_campaign=2bec496f31-DNU20160122&utm_medium=email&utm_term=0_1fcbc04421-2bec496f31-197565045
January 23, 2016 reply from Bob Jensen
The study throws around the words "proof" or "proves" when
in fact the study is sloppy in terms of any scientific standards. Firstly,
the study ignores such issues as nepotism. For example, children of business
owners have the luxury of majoring in art history because a job to the top
is waiting for them after graduation in any major. And business owners can
afford the high tuition of prestigious liberal arts colleges.
Secondly, being active in social media often means you
have the time rather than having to spend 80 hours a week on the job with
almost no time for the social media, such as being a very successful
physician. For example, most physicians have less time to be active in the
social media and civic affairs than their stay-at-home spouses who majored
in art history at Swarthmore. And experiences in undergraduate education are
greatly confounded by what are often more meaningful experiences in graduate
education such as MBA school, law school, and medical school. And the study
would be terribly misleading if it focused only on undergraduates who did
not have any graduate education.
Thirdly there's an enormous problem in scientific studies
where humans self-report their behavior. No attempt was made to follow up
studies on the comparability of the self reports.
Fourthly, any type of "success study" is faces the
enormous problem of defining "success." I am reminded of a psychology
professor, Tom Harrell, that I had years ago at Stanford University. He had
a long-term contract from the U.S. Navy to study Stanford students when they
entered the MBA program and then follow them through their careers. The
overall purpose was to define predictors of success that could be used for
admission to the Stanford GSB (and extended to tests for admission into
careers, etc.) Dr, Harrell's research became hung up on "The Criterion
Problem (i.e., the problem of defining and measuring "success.") You will
have the same trouble whenever you try to assess graduates of any education
program whether it is onsite or online. What is success? What is the role
any predictor apart from a myriad of confounded variables?
You might take a look at the following reference:
Harrell, T.W. (1992). "Some history of the army general classifications
test," Journal of Applied Psychology, 77, 875-878.
Success may lie in advancement in the workforce into
leadership roles, but promotion and opportunity are subject to widely
varying and often-changing barriers and opportunities. A program's best
graduate may end up on a dead end track, and its worst graduate may be a
maggot who fell in a manure pile. For example, it used to be virtually
impossible for a woman to become a partner in a large public accounting
firm. Now the way is paved with all sorts of incentives for women to hang
in there and attain partnership. Success also entails being at the right
place at the right time, and this is often a matter of luck and opportunity
as well as ability.
Bob Jensen
**How to Mislead With Statistics
Here Are The USA States and Canadian Provinces That Everyone Using Atlas
Van Lines Moved Into And Out Of In 2013 ---
http://www.businessinsider.com/atlas-2013-moving-map-2014-1
Caution
The data are based upon only household moves of Atlas Van Lines. It probably is
misleading to extrapolate the outcomes to total migration data. That means,
among other things, that California is not really in steady-state yet. And
Florida may be drowning in retirees who sold all their possessions up north and
simply bought new condos, flip flops, and shorts after landing in Florida
airports.
Compare the historical patterns here ---
http://www.atlasvanlines.com/migration-patterns/archives/
Jensen Comment
There are some surprises here, notably the household moves from nearly all of
Canada into the USA. Reasons could be climate, economic opportunity. lower
taxes, and a desire for Affordable Care Act. Yeah Right! The provinces having
the highest percentages of outbounders are Saskatchewan, Ontario, and Quebec.
But the flows across the USA's northern border are nothing like the flood tides
on its southern border. Most of the moves across the southern border did not use
van lines of any type.
Another surprise is that California is not hemorrhaging with population net
loss due to having high and ever increasing taxes. The states with the highest
percentages of outbound population were Connecticut, New York, and Indiana.
Connecticut and New York outbounders were probably driven by high and
ever-increasing taxes. But Indiana's outbounders confuse me. The highest
inbounder states are largely due to low taxes and oil and gas opportunities ---
except for North Carolina. What's in North Carolina?
Florida is a bit of a surprise. I would have guessed it was flooding in new
tax dodgers and sun-seeking retirees. The same goes for Arizona, although
Arizona has fewer tax incentives.
Nevada is also a bit of a surprise because of the tremendous tax incentives.
But Nevada is the worst of the 50 USA states in terms of job opportunities.
New Hampshire is one of the states with a high proportion if inbounders. I
will vote for a 10-foot double fence surrounding the entire state. Come on
folks. There's no oil and gas or jobs in New Hampshire. Must be the lure of low
taxes.
The bottom line is that this is mostly an exercise for students seeking to
learn how to mislead with statistics and graphs.
Chuck Pier forwarded more a more accurate migration graphic for the USA ---
http://vizynary.com/2013/11/18/restless-america-state-to-state-migration-in-2012/
California and New York seem to be losing it. Wonder why?
**How to Mislead
With Statistics
The state of the world's seas is often painted as verging on catastrophe. But
although some challenges are very real, others have been vastly overstated,
researchers claim in a review paper. The team writes that scientists, journals
and the media have fallen into a mode of groupthink that can damage the
credibility of the ocean sciences. The controversial study exposes fault lines
in the marine-science community.
Daniel Cressey, Nature, January 18, 2015 ---
http://www.nature.com/news/ocean-calamities-oversold-say-researchers-1.16714
How to Mislead
With Statistics: 2014 Was Not the Hottest Year on Record
"2014 Hottest Year on Record, Says NOAA: Climate Models Still Wrong on Trend,"
by Ronald Bailey, Reason Magazine, January 16, 2015 ---
http://reason.com/blog/2015/01/16/2014-hottest-year-on-record-says-noaa-cl
. . .
So global average temperature is not increasing at
the rate of about 0.3 degree Celsius (0.54 degree Fahrenheit) per decade
that is the average of the climate models relied upon by the
Intergovernmental Panel on Climate Change (IPCC). Regarding the 17 year
slow-down in global temperature increases, the IPCC's
Synthesis Report just released in November
notes:
The observed reduction in surface warming trend
over the period 1998 to 2012 as compared to the period 1951 to 2012, is
due in roughly equal measure to a reduced trend in radiative forcing and
a cooling contribution from natural internal variability, which includes
a possible redistribution of heat within the ocean (medium confidence).
The rate of warming of the observed global mean surface temperature over
the period from 1998 to 2012 is estimated to be around one-third to
one-half of the trend over the period from 1951 to 2012. …
For the period from 1998 to 2012, 111 of the
114 available climate-model simulations show a surface warming trend
larger than the observations…. The difference between models and
observations may also contain contributions from inadequacies in the
solar, volcanic, and aerosol forcings used by the models and, in some
models, from an overestimate of the response to increasing greenhouse
gas and other anthropogenic forcing (the latter dominated by the effects
of aerosols).
Shorter: The climate models could be wrong for all
sorts of reasons.
Last week, I reported that the satellite data shows
that
2014 was the third warmest year in that record.
University of Alabama in Huntsville climatologist John Christy noted:
2014 was the third warmest year in the 36-year
global satellite temperature record, but by such a small margin (0.01 C)
as to be statistically similar to other recent years, according to Dr.
John Christy, a professor of atmospheric science and director of the
Earth System Science Center at The University of Alabama in Huntsville.
“2014 was warm, but not special. The 0.01 C difference between 2014 and
2005, or the 0.02 difference with 2013 are not statistically different
from zero. That might not be a very satisfying conclusion, but it is at
least accurate.”
The 2014 average temperature anomaly also is in
keeping with temperatures since late 2001, when the global average
temperature rose to a level that is generally warmer than the 30-year
baseline average. The most recent 13 complete calendar years, from 2002
through 2014, have averaged 0.18 C (about 0.33 degrees Fahrenheit)
warmer than the 30-year baseline average, while the global temperature
trend during that span was a warming trend at the rate of +0.05 C per
decade — which is also statistically insignificant.
In other words, as hot as 2014 is, there is still
no sign of a speed up in the rate of global average temperature increase.
**How to mislead with statistics (sampling error)
An MBA is Eventually Worth $22,000 More (6-8 years out) if You're White or
Asian: Is this really the case? ---
http://www.bloomberg.com/news/articles/2016-01-07/business-school-is-worth-22-000-more-if-you-re-white-or-asian?cmpid=BBWGP011316_BIZ
For most people, going to business school leads to
bigger and bigger paychecks. But you are likely to get the most out of the
degree if you are a white or Asian man, Bloomberg data show.
Black, Hispanic, and American Indian MBAs who got
their degree six to eight years ago earned exactly as much as their white
and Asian peers right after leaving school, according to a Bloomberg survey
of 12,700 alumni at more than 100 business schools. In the survey, conducted
as part of our annual ranking of full-time MBA programs, both groups said
they made a median $105,000 when they graduated.
But by 2015, MBAs who were underrepresented
minorities—meaning black, Hispanic, or American Indian—earned $150,000,
while white and Asian MBAs made $172,000. Whites and Asians accounted for
about 89 percent of alumni in the survey. Underrepresented groups made up 11
percent.
Female MBAs made less money than the men they
graduated business school with, but women of color were at a particularly
stark disadvantage. Six to eight years after leaving business school, black,
Hispanic, and American India women earned a median $132,250. White and Asian
men earned $181,000—a pay gap of nearly $49,000. Men from underrepresented
minorities earned $163,500—less than white and Asian men but more than white
women, who took home $150,000.
Jensen Comment
A good exercise for your students would be to find underlying factors where the
difference in average incomes are possibly explained by things other than race
and ethnicity per se. For example, .both means and medians are affected by
outliers when the outliers for income are zero or nearly zero.
For example, it is well known that women tend to drop out of the
job market more than men when they have babies. The lower averages for women can
possibly be explained for the mommy zero-imcome phenomenon rather than race per
se. This is complicated when the proportions of gender differences differ by
race such as when more female African Americans have MBA degrees compare to
their male counterparts.
There are so few American Indian MBA alumni I tend to distrust
any outcomes for this subset of the sampling population.
There can also be geographic confounding variables. For example,
the Asian population in the USA is more in big cities and in western cities.
Hispanics are more concentrated in the south. To what extent do geographic
differences in salaries earnings complicate the racist conclusions of this
study?
Gallup ---
http://en.wikipedia.org/wiki/Gallup_%28company%29
Jim Clifton ---
http://en.wikipedia.org/wiki/Jim_Clifton *
**How to Mislead With Statistics
"The Big Lie: 5.6% Unemployment," by Former Gallup CEO Jim Clifton,
LinkedIn, February 3, 2015 ---
https://www.linkedin.com/pulse/big-lie-56-unemployment-jim-clifton?trk=pulse-det-nav_art
Here’s something that many Americans -- including
some of the smartest and most educated among us -- don’t know: The official
unemployment rate, as reported by the U.S. Department of Labor, is extremely
misleading.
Right now, we’re hearing much celebrating from the
media, the White House and Wall Street about how unemployment is “down” to
5.6%. The cheerleading for this number is deafening. The media loves a
comeback story, the White House wants to score political points and Wall
Street would like you to stay in the market.
None of them will tell you this: If you, a family
member or anyone is unemployed and has subsequently given up on finding a
job -- if you are so hopelessly out of work that you’ve stopped looking over
the past four weeks -- the Department of Labor doesn’t count you as
unemployed. That’s right. While you are as unemployed as one can possibly
be, and tragically may never find work again, you are not counted in the
figure we see relentlessly in the news -- currently 5.6%. Right now, as many
as 30 million Americans are either out of work or severely underemployed.
Trust me, the vast majority of them aren’t throwing parties to toast
“falling” unemployment.
There’s another reason why the official rate is
misleading. Say you’re an out-of-work engineer or healthcare worker or
construction worker or retail manager: If you perform a minimum of one hour
of work in a week and are paid at least $20 -- maybe someone pays you to mow
their lawn -- you’re not officially counted as unemployed in the
much-reported 5.6%. Few Americans know this.
Yet another figure of importance that doesn’t get
much press: those working part time but wanting full-time work. If you have
a degree in chemistry or math and are working 10 hours part time because it
is all you can find -- in other words, you are severely underemployed -- the
government doesn’t count you in the 5.6%. Few Americans know this.
There’s no other way to say this. The official
unemployment rate, which cruelly overlooks the suffering of the long-term
and often permanently unemployed as well as the depressingly underemployed,
amounts to a Big Lie.
And it’s a lie that has consequences, because the
great American dream is to have a good job, and in recent years, America has
failed to deliver that dream more than it has at any time in recent memory.
A good job is an individual’s primary identity, their very self-worth, their
dignity -- it establishes the relationship they have with their friends,
community and country. When we fail to deliver a good job that fits a
citizen’s talents, training and experience, we are failing the great
American dream.
Gallup defines a good job as 30+ hours per week for
an organization that provides a regular paycheck. Right now, the U.S. is
delivering at a staggeringly low rate of 44%, which is the number of
full-time jobs as a percent of the adult population, 18 years and older. We
need that to be 50% and a bare minimum of 10 million new, good jobs to
replenish America’s middle class.
I hear all the time that “unemployment is greatly
reduced, but the people aren’t feeling it.” When the media, talking heads,
the White House and Wall Street start reporting the truth -- the percent of
Americans in good jobs; jobs that are full time and real -- then we will
quit wondering why Americans aren’t “feeling” something that doesn’t
remotely reflect the reality in their lives. And we will also quit wondering
what hollowed out the middle class.
Jim Clifton is Chairman and CEO of Gallup. He is author of The
Coming Jobs War (Gallup Press, 2011).
Jensen Comment
Part-time jobs, especially those without benefits, should be excluded from the
calculation of the main unemployment rate --- especially since so many of the
"new jobs created" are part-time jobs.
**How to Mislead With Statistics
Nate Silver thinks the polls weren't all that bad --- Yeah Right
https://fivethirtyeight.com/features/politics-podcast-why-polls-were-off-in-2020-and-why-they-werent-that-bad/
NY Times: A Black Eye’: Why Political Polling Missed the Mark. Again
---
https://www.nytimes.com/2020/11/12/us/politics/election-polls-trump-biden.html
Senator Susan Collins did
not lead in a single publicly
released poll during the final four months of her re-election campaign in
Maine. But Ms. Collins, a Republican, won the election comfortably.
Senator Thom Tillis, a North Carolina Republican, trailed in
almost every poll conducted in his race.
He won, too.
And most polls underestimated President Trump’s
strength, in Iowa, Florida, Michigan, Texas, Wisconsin and elsewhere. Instead of
winning a landslide, as the polls suggested, Joseph R. Biden Jr. beat Mr. Trump
by less than two percentage points in the states that decided the election.
For the second straight presidential election, the
polling industry missed the mark. The miss was not as blatant as in 2016,
when polls suggested Mr. Trump would lose, nor was the miss as large as it
appeared it might be on election night. Once all the votes are counted, the
polls will have correctly pointed to
the winner of the presidential campaign in 48
states — all but Florida and North
Carolina — and correctly signaled that Mr. Biden would win.
But this year’s problems are still alarming,
both to people inside the industry and to the millions of Americans who
follow presidential polls with a passion once reserved for stock prices,
sports scores and lottery numbers. The misses are especially vexing because
pollsters spent much of the last four years trying to fix the central
problem of 2016 — the underestimation of the Republican vote in multiple
states — and they failed.
Continued in article
Nate Silver Has Egg on His Face (again)
Nate Silver ---
http://en.wikipedia.org/wiki/Nate_Silver
**How to Mislead With Statistics
Nate Silver fared terribly in Thursday's UK election:
In his pre-election forecast, he gave 278 seats to Conservatives and 267 to
Labour. Shortly after midnight, he was forecasting 272 seats for Conservatives
and 271 for Labour. But when the sun rose in London on Friday, Conservatives had
an expected 329 seats, against Labour's 233.
http://www.politico.com/blogs/media/2015/05/nate-silver-polls-are-failing-us-206799.html
GIGO ---
http://en.wikipedia.org/wiki/Garbage_in,_garbage_out
What We Got Wrong In Our 2015 U.K. General Election Model ---
http://fivethirtyeight.com/datalab/what-we-got-wrong-in-our-2015-uk-general-election-model/
No calculations are necessary to see that we missed
badly in our forecast of the U.K. election.
Our final forecast was for the Conservatives to win
an expected 278 seats (or somewhere in the range of 252-305 seats), Labour
to win 267 (240-293), the Scottish National Party 53 (47-57), and the
Liberal Democrats 27 (21-33). The actual final results are 330 seats for the
Conservatives, 232 for Labour, 56 for the SNP and just eight for the Lib
Dems. Even though we took (or at least tried to take) into account the scale
of historical poll misses in the U.K., our prediction intervals fell short
of including the result for all of these parties except the SNP.
The only thing we can say on our behalf is that in
comparative terms, our forecast was middle of the pack, as no one had a good
pre-election forecast. Of course
the national exit poll, while not as close to the
target as in 2010, was far better than any pre-election forecast.
Continued in article
Jensen Comment
Although the Nate Silver team this time mostly blames bad polling data, in
previous election failures (such as when Scott Brown soared in late voting
decisions of the public when winning the Senate seat vacated by Ted Kennedy) to
nonstationarity of voting preferences as the election gets under way.
Accountics scientists similarly assume stationarity in questionable
circumstances. This point was recently driven home very forcefully by former AAA
Presidents Tom Dyckman and Steve Zeff ---
http://www.cs.trinity.edu/~rjensen/temp/AccounticsScienceStatisticalMistakes.htm
**How to mislead with statistics
Israel election: why were the exit polls wrong? ---
http://www.theguardian.com/world/datablog/2015/mar/18/israel-election-why-were-the-exit-polls-wrong
*
*How to Mislead With
Statistics (Sample Size)
Your state's taxes could determine whether your NFL team makes it to playoffs
---
https://www.businessinsider.com/nfl-teams-low-tax-states-more-likely-make-playoffs-2018-9
Jensen Comment
Among other things there's a sample size problem in this analysis. Also teams
are not fungible sampling items --- there's a huge difference in terms of having
key players and team harmony. A few rotten apples can spoil a basket.. There are
also lots of long-term deals that differ in terms of annual cash flows.
**How to Mislead With Statistics? (non-statrionarity)
Blast From the Past: How Statistical Forecasts Can Be Very, Very Misleading
"Dukakis Lead Widens, According to New Poll," New York Times, July
26, 1988
---
http://www.nytimes.com/1988/07/26/us/dukakis-lead-widens-according-to-new-poll.html
In the aftermath of the Democratic National
Convention, the party's nominee, Michael S. Dukakis, has expanded his lead
among registered voters over Vice President Bush, the probable Republican
nominee, according to a Gallup Poll.
This was among the findings of a national public
opinion poll of 948 registered voters conducted late last week for Newsweek
magazine by the Gallup Organization. The telephone interviews took place on
July 21, which was the last night of the convention, and on the night after
that.
Fifty-five percent of the 948 registered voters
interviewed in the poll said they preferred to see Mr. Dukakis win the 1988
Presidential election, while 38 percent said they preferred to see Mr. Bush
win. The poll had a margin of sampling error of plus or minus four
percentage points.
Nominees usually enjoy a lift in the polls after the nomination. Ed
Slaughter, project director at Gallup, pointed out that in 1984, Walter
Mondale's standing rose 12 points after the Democratic convention that year.
But the improved standing dissipated within ten days,
Mr. Slaughter said.
Another poll, conducted in Texas, also showed Mr.
Dukakis gaining ground from the convention. The survey of 504 registered
voters likely to cast ballots, conducted on Friday and Saturday by Peter
Hart, a Democratic poll taker, showed Mr. Dukakis leading Mr. Bush by 50
percent to 40 percent. A survey of that size has a sampling error of plus or
minus four percentage points. A Hart survey of 265 such voters for The
Chicago Tribune from July 5 to 9 had shown the race even in Texas - 46
percent for Mr. Dukakis, 46 percent for Mr. Bush, with a sampling error of
plus or minus six percentage points.
DON'T BITE!!!
Continued in article
Jensen Questi
What did the NYT mean by the wording at the end "DON'T
BITE!!!"?
Jensen Comment
Sometimes poll results are more for influencing voters than to make forecasts
that the pollsters really believe. The assumption is that voters will back what
looks like a winner in the polls! Closer to election time Dukakis basked in a 17
point lead in the polls.
In
November 1988 George H.W. Bush crushed Dukakis by winning in 40 states.
**How to Mislead With Statistics
These 9 US colleges are more selective than some Ivy League schools ---
http://www.businessinsider.com/these-9-us-colleges-are-more-selective-than-some-ivy-league-schools-2015-3
Jensen Comment
There are various ways in which rejection rates can be misleading. The first
question to as is what proportion of the students who were accepted by these
nine US colleges would be rejected by Ivy League schools. My opinion is that
most would be rejected except for students admitted to exceedingly prestigious
universities like MIT and Stanford.
The College of the Ozarks is a unique institution where students work to pay
their tuition. Most students in the Ivy League schools can either afford those
schools or have significant financial aid. Rejection rates are high because
millions of students would like to get a free college education.
Except for some of those selective 9 colleges like Stanford and MIT, the
admission rates themselves are not comparable with Ivy League colleges and
universities. Most top graduates do not even bother (and pay) to apply to the
most prestigious universities like Harvard, Yale, Stanford, and MIT because they
conclude ahead of time that probabilities of being rejected are so high that
it's not worth the time, money, and stress to apply in the first place,
particularly graduates who do not have very unique resumes in addition to nearly
perfect SAT scores. White males and females who have not also done something
remarkable other than ace the SAT examination generally know what it takes to be
admitted to an Ivy League university.
An example of something unique might be to have gone to Haiti after a huge
hurricane and helped to teach children of victims in tent camps. Ot it might
help to have given piano lessons or math for three entire summers to children of
mothers incarcerated in prison.
What it takes to be admitted to a very prestigious university ---
https://alumni.stanford.edu/get/page/magazine/article/?article_id=66225
Also see
What does it really take to get into the Ivy League? Part I: Grades
What does it really take to get into the Ivy League? Part II: PSAT, SAT, and ACT
What does it really take to get into the Ivy League? Part III: AP, IB, and SAT
II Exams
What does it really take to get into the Ivy League? Part IV: Extracurriculars
What does it really take to get into the Ivy League? Part V: Essays
What does it really take to get into the Ivy League? Part VI: Recommendations
What does it really take to get into the Ivy League? Part VII: Application
Strategy
What does it really take to get into the Ivy League? Part VIII: Interviews
What does it really take to get into the Ivy League? Part IX: Checklist
What does it really take to get into the Ivy League? Part X: Epilogue
**How to Mislead With Statistics
Output Per Hour Worked in the USA
From the CFO Journal's Morning Ledger on July 17, 2015
For a decade, economic output per hour worked has
barely budged, and over the past two quarters it has fallen. That is, if you
consult the federal government’s formula for calculating productivity,
something that contrarian economists at Google Inc. and
Stanford recommend against, the
WSJ’s Timothy Aeppel reports. Google chief
economist Hal Varian says sluggish U.S. productivity doesn’t reflect a
high-tech wave of innovations that save people time and money. “There’s a
lack of appreciation for what’s happening in Silicon Valley,” he says,
“because we don’t have a good way to measure it.”
One measurement problem is that a lot of what
originates in America’s technology hub is free or nearly free. But the only
way goods and services move the official U.S. productivity needle is when
consumers and businesses pay for them. Anything free, no matter how much it
improves everyday life, isn’t included. Many in Silicon Valley say it is
just a matter of time before new innovations surface in salable products and
goose the official productivity tally. First, though, businesses must
harness the innovations to the products they sell. Driverless-car
technology, for example, won’t hit city streets for a while.
**How to Mislead With Statistics (definitions, non-stationarity)
Women ranked a favorable
social status for their partner more highly in 2008 than in 1939. Interestingly,
men rated a woman’s desire for home and children and good cooking and
housekeeping more highly over time — perhaps because these qualities were no
longer taken for granted in a wife.
"What men and women wanted in a spouse in 1939 —
and how different it is today," by Ana Swanson,
The Washington Post, April 19, 2016 ---
https://www.washingtonpost.com/news/wonk/wp/2016/04/19/what-men-and-women-wanted-in-a-spouse-in-1939-and-how-different-it-is-today/
Jensen Comment
This falls into my "How to Mislead With Statistics" Department. The reason is
that marriage in 1939 is not the same as marriage in 2008 --- largely due to the
important impact birth control had upon living relationships between males and
females. For example, it's now common for "significant other relationships" to
lead to marriage relationships only when the couple elects to start having
children. Thus, it's really not surprising that a woman's "desire for home and
children" increased in importance as a marriage condition in 2008 relative to
1939. In other words a couple in a long-term unmarried relationship has less
incentive for marriage in 2008 until they plan to have children.
My point is that comparing a "marriage" in 2008 with a
"marriage" in 1939 is a lot like comparing apples and lemons. They are not the
same
**How to Mislead With Statistics (definitions, non-stationarity)
This is the best research we've seen on how
many Americans are really struggling financially, and it is heartbreaking
---
http://www.businessinsider.com/just-capital-research-on-living-wage-2016-12/#a-staggering-number-of-americans-arent-making-a-living-wage-1
Jensen Comment
The article does not stress what seems to me to be obvious in the graphic ---
raising the minimum wage may be dysfunctional. For example, California, Oregon,
and Washington that have raised minimum rages have some of the worst problems
with counties struggling financially. Firstly, there's a problem with cost of
living. A minimums wage of $25 per hour might not be enough in those states
counties where living costs are relatively high. For example, in San Francisco
nearly all low-wage workers have to be homeless or cummute long distances from
outside the city. This is not the case in San Antonio, Texas.
Secondly, there's a problem of how businesses and local governments deal
with minimum wages. One problem is outsourcing such as when a university or
courthouse outsourcers its janitorial services. A related problem is to cut back
on working hours as wage rates increase. Another problem, especially in
California and Oregon is discouraging new business ventures due to taxation and
regulations. For example, the Town of Portland, Oregon just imposed a surtax on
some companies (like Wal-Mart) to raise money to help the homeless. This may
help the homeless at the expense of low-wage workers who will actually see their
incomes decline due to working less hours and losing opportunities for jobs in
companies that now shirk moving into Portland.
Will the Minimum Wage Debate Ever Be Settled?
---
https://www.theatlantic.com/business/archive/2016/12/minimum-wage-debate/510383/
Jensen Comment
About the only thing we can conclude is that minimum wages have differing
impacts in differing circumstances such as local employment markets, worker
ages, living costs, and fringe benefits such as the value of
training/apprenticeships. In a really free market economy some workers might
benefit greatly from working for nothing if the training is extremely valuable.
And we have to consider the prospects of workers on minimum wages. Wal-Mart has
low wages but in most instances those wages are above minimum wage. But Wal-Mart
also offers solid promotion tracks for quality workers, and the promotions in
almost all instances are relatively attractive even if the work itself can be
boring and stressful at the same time.
Minimum wage impact data from Seattle may be highly misleading when compared
to similar studies in San Antonio.
Minimum wage impact data may be quite different when comparing Burger King in
San Antonio with construction workers in San Antonio. This is because Burger
King resists hiring undocumented workers nationwide whereas in San Antonio there
are probably more undocumented construction workers in the underground
(cash-only) market than those who work for reported wages and fringe benefits.
In my opinion raising the minimum wage in San Antonio will only strengthen the
underground market job supply. Authorities are hesitant to shut down the
underground labor supply since doing so will badly hurt thousands and thousands
of families of undocumented workers.
Comparing minimum wages in Europe with the USA is also misleading. In spite
of the current media coverage of immigration issues in Europe, those issues are
relatively small compared to immigration issues for people easily getting into
the USA from Latin and South America.
**How to Mislead With Statistics (sampling iissues, non-stationarity issues)
Your state's taxes could determine whether your NFL team makes it to playoffs
---
https://www.businessinsider.com/nfl-teams-low-tax-states-more-likely-make-playoffs-2018-9
Jensen Comment
Among other things there's a sample size problem in this analysis. Also teams
are not fungible sampling items --- there's a huge difference in terms of having
key players and team harmony. A few rotten apples can spoil a basket.. There are
also lots of long-term deals that differ in terms of annual cash flows.
**How to Mislead With an Article Title
"The 1% are more likely to vote than the poor or the middle class, and it
matters — a lot," by Sean McElwee, Vox, October 24, 2014 ---
http://www.vox.com/2014/10/24/7055091/class-and-turnout
Jensen Comment
It turns out that this is an article that is really an appeal for more poor and
middle class voters to show up at the polls. That's fine, but the title of the
article is totally misleading. Firstly, the 1% really are only the 1%. Secondly,
the number of nationwide 1% in most voting districts is closer to zero percent.
The 1% are clustered in various parts of the USA like NYC. But with all the
millions of voters in NYC, even the 1% is not likely to change the election
outcomes if they do or do not show up to vote.
Sure the 1% can influence election outcomes throughout the USA with their
money. But this article is about showing up at the polls and not about
influencing election outcomes with money.
**How to Mislead With Opinion Surveys (sampling issues)
How to Mislead With Statistics
Nate Silver thinks the polls weren't all that bad --- Yeah Right
https://fivethirtyeight.com/features/politics-podcast-why-polls-were-off-in-2020-and-why-they-werent-that-bad/
NY Times: A Black Eye’: Why Political Polling Missed the Mark. Again
---
https://www.nytimes.com/2020/11/12/us/politics/election-polls-trump-biden.html
Senator Susan Collins did
not lead in a single publicly
released poll during the final four months of her re-election campaign in
Maine. But Ms. Collins, a Republican, won the election comfortably.
Senator Thom Tillis, a North Carolina Republican, trailed in
almost every poll conducted in his race.
He won, too.
And most polls underestimated President Trump’s
strength, in Iowa, Florida, Michigan, Texas, Wisconsin and elsewhere. Instead of
winning a landslide, as the polls suggested, Joseph R. Biden Jr. beat Mr. Trump
by less than two percentage points in the states that decided the election.
For the second straight presidential election, the
polling industry missed the mark. The miss was not as blatant as in 2016,
when polls suggested Mr. Trump would lose, nor was the miss as large as it
appeared it might be on election night. Once all the votes are counted, the
polls will have correctly pointed to
the winner of the presidential campaign in 48
states — all but Florida and North
Carolina — and correctly signaled that Mr. Biden would win.
But this year’s problems are still alarming,
both to people inside the industry and to the millions of Americans who
follow presidential polls with a passion once reserved for stock prices,
sports scores and lottery numbers. The misses are especially vexing because
pollsters spent much of the last four years trying to fix the central
problem of 2016 — the underestimation of the Republican vote in multiple
states — and they failed.
Continued in article
**How to Mislead With Statistics (sample selection and non-stationarity)
The terrifying uncertainty at the heart of FiveThirtyEight’s election
forecasts ---
https://www.vox.com/2018/10/24/18009356/fivethirtyeight-nate-silver-election-2018-forecast-analysis
Jensen Comment
One thing about political polls is that they can change so suddenly as election
day grows closer and closer. Nate Silver learned a hard lesson in 2010 when
Scott Brown won the election to fill Ted Kennedy's senate seat. Nate Silver
predicted that Scott Brown would lose and was embarrassed professionally the
day after the election. The very late changes in voter
preferences were totally unexpected.
One thing the liberal media does not like to focus on much at the moment is
the timing of the 7,000+ migrant caravan headed this way on foot through Mexico
in October 2018. This particular caravan appears to be bad for Democratic
candidates who are largely avoiding making comments about the tide (more than
just the biggest mass headed this way in one caravan) headed this way just
before 2018 election ---
https://townhall.com/columnists/johnandandyschlafly/2018/10/24/dems-tonguetied-on-caravan-issue-n2531281?utm_source=thdaily&utm_medium=email&utm_campaign=nl&newsletterad=&bcid=b16c6f948f297f77432f990d4411617f&recip=17935167
The GOP is capitalizing on fears knowing that an overwhelming majority of USA
voters are frightened by these caravans and probably future tides of people
headed for the southern border of the USA even though there is great sympathy
about marchers' bleak futures in their gang-infested home nations, especially in
Latin America.
The Canadian Army was sent to the Quebec border not long ago to stem the tide
of Haitians trying to enter Canada.
NY Times ---
https://www.google.com/search?as_q=Canada+Army+Quebec+Border&as_epq=Haitian&as_oq=&as_eq=&as_nlo=&as_nhi=&lr=&cr=&as_qdr=all&as_sitesearch=&as_occt=any&safe=images&as_filetype=&as_rights=
Something similar happens statistically with temporal data in capital markets
research conducted by economics, finance, and accounting professors.
Market data is volatile and impacted greatly by transitory (daily) happenings in
the world.
From Two Former Presidents of the AAA
"Some Methodological Deficiencies in Empirical Research Articles in
Accounting." by Thomas R. Dyckman and Stephen A. Zeff , Accounting
Horizons: September 2014, Vol. 28, No. 3, pp. 695-712 ---
http://aaajournals.org/doi/full/10.2308/acch-50818 (not free)
This paper uses a sample of the regression and
behavioral papers published in The Accounting Review and the Journal of
Accounting Research from September 2012 through May 2013. We argue first
that the current research results reported in empirical regression papers
fail adequately to justify the time period adopted for the study.
Second, we maintain that the statistical analyses used in these papers as
well as in the behavioral papers have produced flawed results. We further
maintain that their tests of statistical significance are not appropriate
and, more importantly, that these studies do not�and cannot�properly address
the economic significance of the work. In other words, significance tests
are not tests of the economic meaningfulness of the results. We suggest ways
to avoid some but not all of these problems. We also argue that replication
studies, which have been essentially abandoned by accounting researchers,
can contribute to our search for truth, but few will be forthcoming unless
the academic reward system is modified.
The free SSRN version of this paper is at
http://papers.ssrn.com/sol3/papers.cfm?abstract_id=2324266
This Dyckman and Zeff paper is indirectly related to the following technical
econometrics research:
"The Econometrics of Temporal Aggregation - IV - Cointegration," by
David Giles, Econometrics Blog, September 13, 2014 ---
http://davegiles.blogspot.com/2014/09/the-econometrics-of-temporal.html
**How to Mislead With Statistics
PBS Nova: How did the polls get it so wrong?
http://www.pbs.org/wgbh/nova/next/body/why-did-the-polls-get-it-wrong/
Forbes: The Science Of Error: How Polling Botched The
2016 Election ---
https://www.forbes.com/sites/startswithabang/2016/11/09/the-science-of-error-how-polling-botched-the-2016-election/#6deb3b337959
Scientific American: Where Are the Real Errors in
Political Polls?
https://blogs.scientificamerican.com/guest-blog/where-are-the-real-errors-in-political-polls/
Examples of misleading statistics and polls ---
https://www.datapine.com/blog/misleading-statistics-and-data/
NYT: Affirmative Action Is an Example of How Polls Can
Mislead
https://www.nytimes.com/2017/08/04/upshot/affirmative-action-and-why-polls-on-issues-are-often-misleading.html
Misleading Charts
---
https://qz.com/580859/the-most-misleading-charts-of-2015-fixed/
The Top 10 Ways to Get Misleading Poll Results (many times these are
intentional mistakes for political purposes) ---
http://www.charneyresearch.com/resources/the-top-10-ways-to-get-misleading-poll-results/
Fake Polls are the Real Problem ---
https://fivethirtyeight.com/features/fake-polls-are-a-real-problem/
**How to Mislead With Statistics
Bogus Straw Stats Popped Up in October 7, 2018 Shark Tank ---
http://reason.com/blog/2018/10/08/bogus-straw-stats-pop-up-in-last-nights
**How to Mislead With Statistics (distortions, missing variables, samples)
"The 11 most expensive countries for a university education," by
Lianna Brinded, Business Insider, December 28, 2015 ---
http://www.businessinsider.com/expert-market-11-countries-where-parents-spend-the-most-money-on-university-tuition-fees-2015-10
Jensen Comment
This has to be one of the most misleading articles that I have ever read. It's
not at all clear how the data is collected and aggregated, but it overlooks how
complicated it is to compute "tuition cost," especially in the USA. Firstly,
virtually all of the top state supported universities in all 50 states have
excellent academic reputations such as UC Berkeley, University of Washington,
University of Wisconsin, University of Illinois, University of Texas, Texas A&M,
University of Michigan, etc. Tuition costs vary greatly between what in-state
students are charged versus out-of-state students. In-state students get a
relatively good deal for both onsite and online degrees.
Secondly, the study seems to ignore the high proportion of need-based
financial support from both the top-ranked state-supported and private
universities. Education is virtually free for top students coming from
households having less than $35,000 in annual income plus social benefits like
Food Stamps and free Medicaid.
Thirdly, for students of lesser ability wanting to go to college the USA has
a fantastic network of state-supported universitiess, community colleges, and
branch campuses that are relatively low cost and not anywhere close to the
median tuition costs reported in the above article. Online degree alternatives
have exploded from these institutions which enables many students (especially
young parents) to live at home and not have to pay room and board costs on a
campus.
In the U.K., open university has hundreds of thousands of students who pay
less than £5,000, over 60,000 of them pay almost nothing. There are many other
universities in the U.K. that are similarly low cost.
I have only one comment left about the above article --- HOGWASH!
The problem is not the cost of higher education in the USA.
The problem is that the diplomas mean less and less due to grade inflation.
They are not a good deal due to the high cost of tuition. They are becoming a
worse and worse deal because of grade inflation that renders the education more
and more meaningless.
December 28, 2015 reply from Robin Alexander
I agree with Bob on this one. The article didn’t
give a hint on how it derived its numbers, and in Hungary’s case, they
didn’t seem to take the "free tuition if stay in country 10 years" into
account when making it #1 in percent of income eaten by tuition. Totally
undependable. But it gives rise to several points:
1. I do think that gross tuition (not taking into account loans, grants,
scholarships, etc.) is rising faster than median income as are crucial
services such as health care. This can cause problems for some qualified and
motivated students.
2. I agree that grade inflation is a huge problem. I graduated with
around a 2.8 (I was a late bloomer) that was considered good but not great
in my day. Towards the end of my teaching career, anybody with less than a
3.5 was barely considered hirable! I think the trend to grade inflation
really took off when “student evaluations” began to be used unscientifically
for raises and promotion at universities. Whatever the cause, at my
university there was tremendous pressure from deans on up to pass more
students and not give the grade they had earned. One of my colleagues
stuck to her guns and gave grades that the students deserved and for this
she was hounded out of the U.
3. I believe one of the worst things one can do to a young person is to
encourage an unable and unmotivated student to go to college. They will gain
little of benefit from the experience and will drag down the experience of
those who really want to be there.
There’s more, but this will do for now.
Robin Alexander
**How to Mislead With Statistics (non-stationarity)
However, due to a statistical quirk, the prediction models were unable to
recognize the dropping support for Hillary Clinton just prior to the 2016
election ---
https://theconversation.com/how-the-polls-could-have-caught-surprise-victories-like-trumps-103823
. . .
Remember, poll aggregators must average several
polls to make a good prediction. Due to sparse state-level polling,
predictions were “stuck” on values from about two weeks prior to the
election, when support for Clinton had been higher. Note that this sparse
polling scenario indicates that polling methods are generally sound,
although more frequent polling of swing states would be helpful.
Continued in article
Jensen Comment
This non-stationarity problem is somewhat similar to
the "methodological deficiencies" in accountics research discussed by Dyckman
and Zeff and the "temporal aggregation cointegration" problem discussed by David
Giles.
From Two Former Presidents of the AAA
"Some Methodological Deficiencies in Empirical Research Articles in
Accounting." by Thomas R. Dyckman and Stephen A. Zeff , Accounting
Horizons: September 2014, Vol. 28, No. 3, pp. 695-712 ---
http://aaajournals.org/doi/full/10.2308/acch-50818 (not free)
This paper uses a sample of the regression and
behavioral papers published in The Accounting Review and the Journal of
Accounting Research from September 2012 through May 2013. We argue first
that the current research results reported in empirical regression papers
fail adequately to justify the time period adopted for the study. Second, we
maintain that the statistical analyses used in these papers as well as in
the behavioral papers have produced flawed results. We further maintain that
their tests of statistical significance are not appropriate and, more
importantly, that these studies do not�and cannot�properly address the
economic significance of the work. In other words, significance tests are
not tests of the economic meaningfulness of the results. We suggest ways to
avoid some but not all of these problems. We also argue that replication
studies, which have been essentially abandoned by accounting researchers,
can contribute to our search for truth, but few will be forthcoming unless
the academic reward system is modified.
The free SSRN version of this paper was once available at
http://papers.ssrn.com/sol3/papers.cfm?abstract_id=2324266
This Dyckman and Zeff paper is indirectly related to the following technical
econometrics research:
"The Econometrics of Temporal Aggregation - IV - Cointegration," by
David Giles, Econometrics Blog, September 13, 2014 ---
http://davegiles.blogspot.com/2014/09/the-econometrics-of-temporal.html
Nature
Five ways to fix statistics
https://www.nature.com/articles/d41586-017-07522-z
JEFF LEEK: Adjust
for human cognition
. . .
BLAKELEY B.
MCSHANE & ANDREW GELMAN:
Abandon
statistical significance
In many fields, decisions about whether to publish an empirical finding,
pursue a line of research or enact a policy are considered only when
results are ‘statistically significant’, defined as having a
P value (or similar metric) that
falls below some pre-specified threshold. This approach is called null
hypothesis significance testing (NHST). It encourages researchers to
investigate so many paths in their analyses that whatever appears in
papers is an unrepresentative selection of the data.
Worse, NHST is often taken to mean that any data can be used to decide
between two inverse claims: either ‘an effect’ that posits a
relationship between, say, a treatment and an outcome (typically the
favoured hypothesis) or ‘no effect’ (defined as the null hypothesis).
In practice, this often amounts to uncertainty laundering. Any study, no
matter how poorly designed and conducted, can lead to statistical
significance and thus a declaration of truth or falsity. NHST was
supposed to protect researchers from over-interpreting noisy data. Now
it has the opposite effect.
This year has seen a
debate about whether tightening the threshold for statistical
significance would improve science. More than 150 researchers have
weighed in4,5.
We think improvements will come not from tighter thresholds, but from
dropping them altogether. We have no desire to ban
P values. Instead, we wish them to be
considered as just one piece of evidence among many, along with prior
knowledge, plausibility of mechanism, study design and data quality,
real-world costs and benefits, and other factors. For more, see our
article with David Gal at the University of Illinois at Chicago,
Christian Robert at the University of Paris-Dauphine and Jennifer
Tackett at Northwestern University6.
For example, consider
a claim, published in a leading psychology journal in 2011, that a
single exposure to the US flag shifts support towards the Republican
Party for up to eight months7.
In our view, this finding has no backing from political-science theory
or polling data; the reported effect is implausibly large and
long-lasting; the sample sizes were small and nonrepresentative; and the
measurements (for example, those of voting and political ideology) were
noisy. Although the authors stand by their findings, we argue that their
P values provide very little
information.
Statistical-significance thresholds are perhaps useful under certain
conditions: when effects are large and vary little under the conditions
being studied, and when variables can be measured accurately. This may
well describe the experiments for which NHST and canonical statistical
methods were developed, such as agricultural trials in the 1920s and
1930s examining how various fertilizers affected crop yields. Nowadays,
however, in areas ranging from policy analysis to biomedicine, changes
tend to be small, situation-dependent and difficult to measure. For
example, in nutrition studies, it can be a challenge to get accurate
reporting of dietary choices and health outcomes.
Open-science practices can benefit science by making it more difficult
for researchers to make overly strong claims from noisy data, but cannot
by themselves compensate for poor experiments. Real advances will
require researchers to make predictions more capable of probing their
theories and invest in more precise measurements featuring, in many
cases, within-person comparisons.
A crucial step is to move beyond the alchemy of binary statements about
‘an effect’ or ‘no effect’ with only a P
value dividing them. Instead, researchers must accept uncertainty and
embrace variation under different circumstances.
DAVID COLQUHOUN:
State false-positive risk, too
. . .
MICHÈLE B.
NUIJTEN: Share analysis plans and results
. . .
STEVEN N.
GOODMAN: Change norms from within
Bob Jensen's threads on what went wrong with accountics
science ---
http://faculty.trinity.edu/rjensen/theory01.htm#WhatWentWrong
**How to Celebrate With Statistics
23 charts and maps that show the world is getting much, much better
https://www.vox.com/2014/11/24/7272929/global-poverty-health-crime-literacy-good-news
Jensen Comment
Since Vox leans to the left this article surprised me. The selected charts
provide positive trends of very important criteria (e.g., global poverty) in
society. It's pretty easy to quibble with international comparisons data. But I
decided to refrain from that this morning. Why not celebrate some good news for
a change? I'll drink to that later in the day. I'll also drink later in the day
because there's already snow on the ground on October 18, 2018
What's misleading here is the cherry picking of good news and overlooking the
bad news.
**How to Mislead With Statistics (sample selection) ---
Homeschooling Produces Better-Educated, More-Tolerant Kids. Politicians Hate
That ---
http://reason.com/archives/2019/01/22/homeschooling-produces-better-students
Jensen Comment
There are other factors involved, especially selection bias. The homeschooled
kids are highly likely to also be among the best students in schools. Has
anybody ever shown how kids doing poorly in schools dramatically improved with
homeschooling? Chances are that they come from home environments not conducive
to good homeschooling.
**How to mislead with false samples
Iowa State University Political Science:
Academic Integrity That Wasn't ---
https://www.insidehighered.com/news/2016/12/20/frequent-source-comments-politics-admits-no-formal-focus-group-informed-his-insights?utm_source=Inside+Higher+Ed&utm_campaign=de6a599079-DNU20161220&utm_medium=email&utm_term=0_1fcbc04421-de6a599079-197565045&goal=0_1fcbc04421-de6a599079-197565045&mc_cid=de6a599079&mc_eid=1e78f7c952
AP reveals political
science professor who cited a focus group as key source for his many
interviews and essays never had one.
Iowa State University will
not take any action involving a professor who has made misleading references
to a focus group in frequent commentaries on U.S. politics.
Steffen Schmidt, a
political science professor at the university, is an oft-quoted source in
local and state media outlets for his insight about issues related to the
presidential election and politics more widely. In his comments to the media
and opinion pieces, he has frequently referenced a focus group that informs
his public comments.
An Associated Press
report found
that the term “focus group” in Schmidt's statements and writings refers not
to a carefully designed academic study or a set of trusted expert sources
but to anyone Schmidt might speak with about an issue he comments on.
The AP began looking into
the focus group in November after Schmidt cited its findings in
a critique of
Hillary Clinton’s outreach to African-American, women and LGBTQ voters.
After the AP filed an open records request for communications about the
focus group, he acknowledged that there was no set panel.
Schmidt said in an email
that he was not aware the term would be confusing and plans to stop using it
in the future.
“My thought is that I
don’t need to use any term in future, since the columns are my views,” he
added.
Iowa State’s leadership
drew a distinction between use of the term in formal research in scholarly
venues and in opinions offered to the media or in news columns.
“His use of the term
‘focus group’ has been to provide context or support for opinion pieces he
has shared with media,” said Wolfgang Kliemann, the university’s associate
vice president for research and research integrity officer. “At no point has
he presented this as formal research, nor does it meet the definition of
research in a federal or academic sense. We have been clear about Dr.
Schmidt’s intent.”
Marybeth Gasman is a
University of Pennsylvania higher education professor and the editor of
Academics Going Public: How to Write and Speak Beyond Academe.
She said that argument put forth by Iowa State doesn’t hold water. The term
“focus group” is not a confusing one, and it does not take on a different
meaning depending on the context, she said.
“He knows exactly what it
means,” Gasman said. “He also knows it lends an enormous amount of weight to
his argument if he uses that term.”
A focus group usually involves a random collection of people -- not a group
of an academic’s friends or colleagues and students he encounters, as
Schmidt told the AP he saw the term. A professor's focus group research may
also require the approval of a university institutional review board, a
committee set up to approve and monitor research involving human subjects
Bob Jensen's threads on when professors
cheated ---
http://www.trinity.edu/rjensen/Plagiarism.htm#ProfessorsWhoPlagiarize
**How to Mislead With Statistics (samples)
Question
Where are 2,214 (a non-random sample) of MLA languages (including English)
graduates analyzed who earned Ph.D.s from 1996-2011?
https://www.insidehighered.com/news/2015/02/18/new-mla-analysis-sheds-light-much-discussed-humanities-job-market
Answer
Those 2,214 analyzed found jobs in many places, but nearly half report that they
are now tenured or still in tenure tracks in the Academy. The 2,214 respondents
comprise a "sample" that, according to MLA, "isn’t big
enough to be representative, but that it’s at least suggestive of where Ph.D.s
are working." This begs the question of how misleading the "sample" is in
terms of conclusions regarding employment. No mention is made regarding how many
Ph.D. degrees were awarded in languages (including English) in the 1996-2011
years. All we're told is that the "sample" of 2,214 is too small to be
representative. Presumably it is also not a random sample for reasons that I
suggest below.
The study does reveal that a miniscule proportion of respondents analyzed are
unemployed but are actively seeking employment. But by going way back to
prosperous 1996-2006 decade for universities the population is biased toward
graduates having employment, especially tenure-track employment. The world
economy collapsed in 2007. The job outlook picture may be quite different for
the 2007-2011 graduates still seeking employment relative to the 1996-2006
graduates who lucked out to graduate in relatively good times for tenure track
jobs.
The study seemingly excludes graduates who voluntarily dropped completely out
of the job market, e.g., to become a full-time mom or a full-time dad. It's not
clear but it would appear that those voluntarily "unemployed" graduates are
completely outside the population that was sampled or were excluded from the set
of 2,214 responses analyzed.
The study also does not reveal non-response rates. Presumably the 2,214
subjects are only those that responded appropriately and perhaps were at a
minimum employed or seeking employment. The study also did not reveal anything
about respondents working totally outside their fields such as those now running
day care centers or working as flight attendants, salespersons, hotel
concierges, etc.
I'm also dubious of those who declare themselves as self-employed.
For example, suppose a newly-minted Ph.D. is 100% financially supported by a
partner or parents while trying to produce an incomplete novel over the past
five years. Is that writer "self-employed" having not yet sold a single
manuscript? Is an artist "self-employed" who has never sold more than $10,000 in
artwork over the past five years?
The study study fails to distinguish full-time employment versus part-time
employment.
What proportion of the non-tenure track jobs are part-time?
What proportion of the "self-employed" really only work part time?
The bottom line is that this study is probably misleading in terms of
painting a rosier picture of the language Ph.D. job market that is actually the
case.
For example, at a new job searching service of the Chronicle of Higher
Education there are only 18 jobs posted today for "Faculty&Research" under
the category "Modern Languages" posted in the last 30 days. For "Accounting"
there are 256 postings ---
https://chroniclevitae.com/job_search/new?cid=VTECHNJOBSL1
**How to Mislead With Statistics
The Net Worth Of The American Presidents: Washington To Obama ---
Click Here
http://247wallst.com/banking-finance/2010/05/17/the-net-worth-of-the-american-presidents-washington-to-obama/?utm_source=247WallStDailyNewsletter&utm_medium=email&utm_content=FEB132015A&utm_campaign=DailyNewsletter
Jensen Comment
I don't see how comparisons across over 300 years of vastly different economies
are anything but misleading even if an attempt is made to adjust for changes in
the purchasing power of the dollar. Inflation adjustments entail defining a
market basket of goods and services, but there is no way to compare market
baskets over such a long period of time. For example, For example, our earliest
presidents bought and used slaves in their baskets. Modern day presidents have
many goods and services in their baskets that did not exist 300+ years ago.
There's also a question of timing since wealth varies so much before, during,
and after the presidency. For example, read the Bill Clinton module. Then read
the George W. Bush module. The summary makes Bill Clinton look much more wealthy
than Bush, but before and during their presidencies this was most certainly not
the case. Clinton became very wealthy after the presidency.
There's also the question of how to compare the rather generous lifetime
pensions of later-year presidents like with William Henry Harrison who "died
penniless" versus Barack Obama who will have a generous pension for as long as
he lives.
There's a question of whether a president's net worth can be separated from
that of his spouse. William McKinley is a good example in terms of inherited
wealth. If you combine what Bill Clinton earned after his terms in office with
that of his wife Hillary you perhaps more than double the wealth shown for Bill
Clinton in this study.
There's much mystery surrounding how some presidents became wealthy. For
example, LBJ died having nearly $100 million after being born dirt poor and
having only drawn a paycheck from taxpayers his entire life.
The study does attempt to distinguish presidents that were born wealthy are
were part of family dynasties of great wealth such as the family of JFK versus
Bill Clinton who started with no rich daddy.
Perhaps comparisons can be made across shorter intervals of time such as
comparing the wealth of George Washington with John Adams or comparing the
wealth of Barack Obama with Bill Clinton. But I would not try to compare the
wealth of John Adams versus Barack Obama.
In conclusion the study does allow for very broad comparisons such as
comparing the lifetime wealth of Woodrow Wilson (relatively poor) to the
lifetime wealth of Teddy Roosevelt (quite wealthy). But when it comes to finer
comparisons such as comparing the wealth of Jimmy Carter with William Henry
Harrison forget it --- you are comparing peanuts with land values that are very
hard to estimate in terms of 21st Century land valuations.
**How to Mislead With Statistics
How many of your state's taxes leave the state (and don't come back)?
https://www.businessinsider.com/states-pay-federal-government-lose-gain-2019-1
Jensen Comment
The biggest problem with this study is virtually impossible to define what taxes
leave the state and what taxes come back. The closest I could come to the
definition used in this study is the referenced item at
https://www.osc.state.ny.us/reports/budget/2018/federal-budget-fiscal-year-2017.pdf
For example, consider the amount for "corporate taxes leaving the state." The
definition appears to be whether the corporation is chartered in state. But this
has almost nothing to do with what that corporation does for the state. For
legal reasons many USA corporations are chartered in Delaware most of whom have
no presence whatsoever in Delaware. A St Louis corporation may do 95% of its
business in Minnesota while filing its Federal tax return as a chartered
Missouri corporation.
There's a tremendous lag factor not accounted for in this study. For example the
"social taxes and contributions" (think Social Security and Medicare deductions)
sent out of New York to the IRS for a worker over 40 years may later be returned
to Florida after that worker retires in Miami. Florida later benefits for income
sacrificed earlier in New York and confounds the error in calculating the net
tax benefits or costs each year for New York versus Florida.
Definitions of Federal Spending in states begins on Page 9 of
https://www.osc.state.ny.us/reports/budget/2018/federal-budget-fiscal-year-2017.pdf
These definitions are heavily based on "Direct Payments" (especially Social
Security and Medicare) to each state. It also includes Federal spending for
"Procurements" such as when the Air Force buys supplies in Vermont for a pilot
training base. But if the USAF pays $5 million for supplies from Vermont
businesses the net benefit to Vermont is not $5 million . Vermont businesses
maybe paid $4+ million to other states for those supplies later sold to the Air
Force base in Vermont.
Then there's the tremendous difference between capital expenditures versus
annual expenses. When NASA built the Cape Canaveral launching site in Florida
much of the huge expenditure was a one-time investment. Florida got a huge
influx of cash for a short period of time like three years needed to build the
site. This great influx of taxpayer money into Florida is not reflective of the
annual influx of operating revenues thereafter.
I'm totally befuddled by the rankings of states according to net tax
benefits/losses at
https://www.businessinsider.com/states-pay-federal-government-lose-gain-2019-1
For example, I'm completely confused why Missouri is at Rank 19 with a
per-capita +$3,472 benefit in comparison to why Minnesota is at Rank 45 with a
negative -$1,078 per-capita deficit.
I think this study is more than nonsense. It's absolutely misleading based upon
lousy definitions.
**How to Mislead With Statistics
NYT: What Straight-A Students Get Wrong ---
https://www.nytimes.com/2018/12/08/opinion/college-gpa-career-success.html
Jensen Comment
What this article fails to mention is that the University of Georgia or Ohio
State University might well trounce any of the Top 4 college playoff teams if
only Georgia or Ohio State had made it to the 2018 college playoffs ---
https://www.foxnews.com/sports/college-football-playoff-alabama-clemson-notre-dame-and-oklahoma-chosen-as-final-four-teams
My point here is that in Google, Apple, Microsoft, Goldman
Sachs, or Deloitte the fact that 4.0 gpa students don't on average have higher
performance ratings that 3.7 gpa employees fails to overlook the fact that most
graduates hired by are rarely anything but high gpa students relative to other
graduates in their colleges' programs. There may be some adjustment such as when
employers may except a slightly lower gpa applicant from a prestigious
university that has the highest admission standards in the worlld.
My point is that to be a high
performance winner you have to get in the game, and only the highest
gpa students are likely to get in the game unless there is some mitigating
circumstance such as having a perfect GRE score or being a 2.85 gpa biology
major admitted to medical school because of a perfect MCAT score.
The problem for employers and
graduate school admissions officers these days is grade inflation across the USA
where nearly all applicants have close to a 4.0 gpa. This is why
employers and recruiting officers look to other criteria such as excelling in
extra-curricular activities and volunteer work such as teaching English or math
in Africa for a couple of years.
Having said this I concede that in terms of job
performance there are many criteria (and don't rule out luck) that frequently
override gpa or test scores. There's anecdotal evidence that CPA Exam gold medal
winners sometimes bomb out on the job (especially those with zero
personalities). There anecdotal evidence that incoming applicants with perfect
GMAT scores do worse that low GMAT performers with high grade averages.
The above NYT article makes some good points,
but it fails if some students become less concerned with
grades because they took the article to heart.
Luck, courage, and motivation may beat out grades and
skill --- but only if you are in the game to have a chance at high performance.
Think of those glum Georgia and Ohio State varsity
football players watching the 2018 college playoffs on television.
**How to Mislead With Statistics (non-stationarity)
Why are women better than men at the free throw line? ---
https://phys.org/news/2019-01-women-men-free-line.html
. . .
But, in a
longitudinal
study
that I and engineer
Chau Tran
published in December, we examined men and women free-throw percentages in
NCAA
basketball
over a 30-year period. We found that women shoot at 3 percent higher
consistency than men. Men and women are very close, but the women edge out
the men.
History of the free
throw
Even though free
throw shooting percentages vary from player to player, the average free
throw shooting percentage in the NCAA has hovered at around 68 percent for
both
men
and
women
for more than 30 years.
The top NBA player,
Steve Nash, shot at about 90 percent, and the top WNBA player, Delle Donne,
shoots at about 93 percent. But these superstars follow
best practices,
which is the great exception, and their shooting percentages don't
significantly affect the averages. The average free throw shooting
percentages in NCAA don't typically vary by more than 1 percent from year to
year.
So, if the shooting
percentages for men and women have been so close, then what about the
physical differences? On the one hand, the
man's basketball
is larger than the
woman's,
making the free throw more difficult for men. On the other hand, the woman's
ball is more bouncy and women are on average shorter than men, making the
free throw
more difficult for women.
Read more at:
https://phys.org/news/2019-01-women-men-free-line.html#jCp
Jensen Comment
I admit that I'm a bit over my head here, but I'm always suspicious of
differences between averages when sample sizes are enormous ---
The Cult of Statistical Significance: How Standard Error Costs Us Jobs,
Justice, and Lives ---
http://www.cs.trinity.edu/~rjensen/temp/DeirdreMcCloskey/StatisticalSignificance01.htm
Where I'm over my head is in the study of the physics of a free throw and the
cited simulation study.
I'll leave it up to readers to judge if this study is misleading. What I think
is suspect is that some free throws are under normal circumstances say in the
first three quarters of the game when score is relatively close versus the
fourth quarter when many more pressures come to bear on players, especially as
the game approaches a thrilling ending. Pressures on players become much more
severe, and humans react differently under severe pressure.
My point here is there is what I call non-stationarity in the study of free
throws. The distributions of free throwing for most of the game may be quite
unlike the distributions for individual players in times of stress. Hence,
aggregating normal and stress periods in the data may distort the outcomes, and
such distortions are being ignored, especially when the distortions differ for
individual players.
Can we really compare NFL's Tom Brady's passing percentage outcomes most
quarters with those smaller number of quarters where he played under severe
stress to win the game. I might add that Tom is particularly known for his
comeback win performances.
Can we get meaningful results when aggregating Tom's passing percentages across
all quarters of play or aggregating his percentages with other quarterbacks
across years of play?
**How to Mislead With Statistics (sampling error, non-stationarity)
From a MIT newsletter on October 23, 2018
Video doorbell firm Ring was
bought by Amazon earlier this year for a reported $1 billion, partly thanks
to claims its devices help cut crime. Evidence for that looks flimsy,
however, in light of
a new
analysis conducted by MIT Technology Review.
Crime-fighting claims:
Ring’s motion-sensing doorbells have been a hit since they were launched in
2013. An accompanying app means homeowners don’t need to be home to see and
respond to visitors. When Amazon acquired the company, it claimed a study in
Los Angeles had found that Ring’s doorbells had reduced burglaries “by as
much as 55%.”
City deals: Ring went on to
assert that a drop in burglaries occurred after doorbells were installed on
just 10% of homes. This helped convince over a dozen small US cities to
subsidize discount programs so local residents would buy more doorbells.
The evidence:
It’s
shaky, at best. The only study carried out independently of Ring found, for
example,
that
neighborhoods without Ring doorbells were actually
less likely to suffer break-ins than those with them.
Read the full story
here.
Jensen
Comment
Homes are not fungible sampling items across greatly differing neighborhoods.
Similar lessons have been learned by pollsters after repeated evidence of
misleading polls. Neighborhoods can also change over time. When I was at the
University of Maine years ago crime like car stealing and building break-ins
were virtually unheard of before the part of a University's adjacent forest was
donated for low-income housing. Then the crime commenced. My old reliable
Oldsmobile was stolen on campus and later torched after the transmission gave
out from wild joy riding. The teens who did this were late caught while burning
down a camp (unoccupied at the time) for handicapped children. The teens who did
this were all from the new single-parent homes in the UMO Forest.
**How to mislead with statistics (missing values)
Physics and Math Predict Supreme Court Votes
http://www.physicscentral.com/explore/plus/supreme-court.cfm
Opinions of the Supreme Court
https://www.supremecourt.gov/opinions/slipopinion/18
Jensen Comment
I'm not taking issue with the records of the supreme court or models used to
predict judicial decision outcomes. What I do take issue with is how incomplete
these records are in judging the partisanship power of the Court or individual
members of the court based upon voting records. The power
of the Supreme Court is vast due to it's power to intimidate.
It's a lot like the trouble analysts have in trying to place fraud prevention
values on IRS tax audits or financial statement audits. We can examine
the records of actual audits in detecting fraud until the cows come home, but
we can never analyze frauds that never happened
because of fear of being detected in audits. The
same thing happens when trying to judge the Supreme Court and its members on the
basis of their voting records. What we cannot analyze is the vast set of all
cases or possible cases that never came to the court out of fear of what the
Court would decide.
I would contend that the more the Supreme Court is viewed as partisan the
larger the set of cases or potential cases that never will reach the court. For
example, after his decision on Obamacare and some other cases the current
Justice John Roberts is not viewed as horrifically conservative as many
progressives once feared. Justice Elena Kagan is not viewed as liberal as many
conservatives once feared. But these opinions are based
upon a relatively few number of cases that reached the Supreme Court.
The Supreme Court can be far more biased in selection of cases than in
deciding cases.
Furthermore, fear of a politicized court may prevent business firms, colleges,
states, etc. from even filing lawsuits initially out of fear of what might
happen on what is viewed as a "politicized" supreme court. For example,
California's new law favoring net neutrality is being challenged by the Federal
government. If California loses in a lower court decision will California be
afraid to carry the fight up to the current (post-Kavanaugh) Supreme Court?
Personally I think California might be foolish to appeal to the present USA
Supreme Court. California should fear that the Supreme Court's decision might
forever make it more difficult to fight for net neutrality --- net neutrality is
something I want badly. It may be better to wait until liberals have more power
to reinstate net neutrality in Congress and the White House.
My point here is that voting records per se are potentially misleading in
judging our Supreme Court or its individual members.
There is some evidence of Supreme Court bias on other grounds,
particularly the Harvard/Yale bias ---
http://articles.latimes.com/2010/may/12/opinion/la-oe-turley-supreme-court-20100512
I don't dispute this argument, although it is somewhat ironic that both
Justices Thomas and Sotomayor graduated from the Yale law school. I suspect that
these days the Yale Law School would like to disbar Justice Thomas even if he is
African American.
*
*How to mislead with statistics
"Fibbing for Rankings," by Scott Jaschik, Inside Higher Ed,
February 2, 2015 ---
https://www.insidehighered.com/news/2015/02/02/audit-finds-u-missouri-kansas-city-business-school-gave-false-information-princeton
The University of Missouri at Kansas City gave the
Princeton Review false information designed to inflate the rankings of its
business school, which was under pressure from its major donor to keep the
ratings up, according to
an outside audit
released Friday.
The audit -- by PricewaterhouseCoopers -- described
the process by which business school officials came up with creative reasons
to provide data that many at the school believed to be false, and that the
audit found to be false. In one case, for example, the university created a
wish list of clubs that it might support to promote entrepreneurial
students. The university then reported that its wish list was reality and
that it had all of those clubs, which in fact did not exist.
Another part of the audit found that an article
published in The Journal of Product Innovation Management -- an
article that ranked the university's business school as the top institution
in the world in the field of innovation management -- did not violate
professional norms. However, the audit also found that the journal was
unaware when accepting the article that it was written by scholars with ties
to the university.
UMKC issued a news release Friday that reads:
"Independent review upholds No. 1 research ranking."
But the audit also confirmed many of the findings
of an August article in
The Kansas City Star that found "a pattern of
exaggerations and misstatements" by the business school. At the time, the
university disputed the Star's report, but Missouri governor Jay
Nixon requested an investigation, and that request led to the report issued
Friday.
'By All Means Necessary'
PricewaterhouseCoopers officials had access to
senior UMKC officials (including some who left positions they had held in
the period covered by the audit) and to relevant e-mail messages. The e-mail
revealed a focus on finding ways to do well in the rankings in order to keep
happy the business school's largest donor (of $32 million), for whom the
school, the Henry W. Bloch School of Management, is named.
An e-mail from then dean to colleagues said,
for example: "Henry Bloch gets very upset when our rankings go down. We must
do everything we can to increase it when we can by all means necessary.”
The audit then describes some of the things UMKC
did to rank high in the Princeton Review's evaluation of business schools'
(undergraduate and graduate) entrepreneurial programs.
For example, in answering a question about how many
students are enrolled in an entrepreneurship program, the university started
counting anyone who was taking a class in entrepreneurship. Not
surprisingly, the numbers jumped. For example, UMKC reported that
undergraduate enrollment in entrepreneurship programs increased in a year
(the year in which the university changed how it was filling out the form)
from 99 to 438. A dean told the auditors that he knew that figure "isn't
right."
Another change UMKC made helped it inflate answers
on another Princeton Review question: about what percentage of students
launch a business while enrolled. The university, the audit found, started
using primarily data from its e-scholar program (a certificate program for
entrepreneurs in which they must develop a business plan). The e-scholar
program students are not degree students or enrolled in the university, but
officials said they believed it was legitimate to use this group for
reporting, even though the Princeton Review ranks degree programs. Since all
of the e-scholar students must create business plans, the proportion of
undergraduates reported as launching a business increased from 44 percent to
100 percent from 2010 to 2011.
And then there was the question on clubs. The
Princeton Review asks: “How many officially recognized clubs/organizations
do you offer that are specifically for entrepreneurship students?”
The answers in 2009 were three each for
undergraduates and graduate students, and in 2010 were four each. In 2011
the figure jumped to 29 for graduate students and 28 for undergraduates.
Here's how the number of clubs "grew," according to
the audit. A business school official asked a colleague to put together a
wish list of clubs that might show an entrepreneurial focus at the
university. A second official "then instructed a UMKC graduate student to
populate these clubs onto the university’s webpage." UMKC "used the clubs'
existence on the university’s webpage as the only proof the club existed."
Officials believe "these additional 20-plus clubs never actually existed at
UMKC." Since the Star article, the number of clubs being reported
is down to five each for graduate students and undergrads.
The PricewaterhouseCoopers report says the
Princeton Review does not review the accuracy of information submitted to it
by colleges and universities and so did not do any independent analysis of
UMKC data. The audit also said it was not clear that any of the false
information would affect the business school's overall ranking.
But on Sunday night, Robert Franek, senior vice
president and publisher of the Princeton Review, said in an email to
Inside Higher Ed that Princeton Review would be removing UMKC from the
lists of best colleges and business schools for entrepreneurial programs.
“At The Princeton Review, for the past 34 years we
have provided accurate and timely information to students and parents to
help them make decisions about colleges and graduate schools. We were
extremely disappointed to learn that the University of Missouri-Kansas City
falsified data about the school per a report from PricewaterhouseCoopers on
January 30. As a result of this new information, we are removing the
University of Missouri-Kansas City from our 2014 ranking lists of the best
college and business school entrepreneurial programs," said a statement
Franek released. "Schools earn a spot on our entrepreneurship ranking
through school-reported data. Every school signs an affidavit to ensure
their information is accurate. We take these affidavits and this news very
seriously.”
Questions on a Journal Article
Another major part of the audit was a look at the
journal article published in The Journal of Product Innovation
Management.
On this question, the audit found that the article
was based on data analysis and that no shortcomings could be found in it.
But the article has been questioned from the time it was published. The
original Star article quoted a professor (anonymously, because he
feared speaking out) as saying that “We all knew that this was bullshit. We
knew that UMKC was not better than MIT and Stanford.”
While the audit didn't question the article's
findings, it did note concerns about it. The authors who asserted that UMKC
was tops in the world in innovative management did not disclose to the
journal that they were both visiting scholars at the university and knew
some of the players. Because the article was based on data (number of
articles written in journals of various influence, etc.), the journal's
editor said that the article's findings still stood. However, he said he
wished he had known about the authors' ties to the institution they praised.
The authors are two scholars from China. They gave
a letter to the auditor in which they said that there was no need to
identify their UMKC connections because the "double-blind" peer review
process -- in which they don't know who reviews their work, and the
reviewers don't know the author -- prevented conflict of interest. The
audit, however, found that at the journal in question "papers are solely
reviewed by the editor and not subject to the typical double-blind review of
other research papers."
Continued in article
Bob Jensen's threads on ranking controversies ---
http://www.trinity.edu/rjensen/HigherEdControversies2.htm#BusinessSchoolRankings
Jensen Comment
Perhaps we should be more precise in using the term "audit" versus the term
"review." The article content uses the word audit whereas the title more
appropriately uses the term review. Then again maybe this was an audit since it
validated the numbers.
Price Waterhouse years ago was willing to lend its name to the possible
limits of the term "review." Over ten years before its merger with Coopers &
Lybrand, PW signed off on a review in 1987 of Days Inn financial statement
forecasts prior to a planned IPO of Days Inn. This was not an audit of the
forecast numbers themselves. But it was a "review" of the forecast procedures of
Days Inn and a review of the "underlying assumptions" in those forecasts.
I still have a prized copy of that 1987 Days Inn annual report in which PW
audited the 1987 financial statements and reviewed the financial statement
forecasts. A real estate appraisal company, Landhauer Associates, signed off on
the estimates of over 300 hotel exit values based on a sampling of the real
estate appraisals. I provide more details at
http://www.trinity.edu/rjensen/Theory02.htm#FairValue
Perform search on the phrase "Days Inn"
Update
Princeton Review Strips U. of Missouri at Kansas City of Its Controversial
Ranking ---
http://chronicle.com/blogs/ticker/jp/princeton-review-strips-missouri-university-of-its-controversial-ranking?cid=at&utm_source=at&utm_medium=en
**How to Mislead With Statistics
Does having more police lead to a lower crime rate? ---
https://www.data-z.org/news/detail/does-having-more-police-lead-to-a-lower-crime-rate
Dr. Fauci: ‘You Can’t Rely On The Models,’ Too Many Variables ---
https://www.dailywire.com/news/fauci-you-cant-rely-on-the-models-too-many-variables
Jensen Comment
Missing variables are often overlooked problems by social science, finance, and
accounting researchers. Not only are there too many missing variables, but some
of those variables are ignored because they can't be reliably quantified and/or
are not in purchased databases that "lazy" researchers prefer to use rather than
gather their own data. Models don't deal well with qualitative variables. In
accountancy these variables are called intangibles and are often ignored by
model builders.
An even bigger problem is the assumption of stationary that does not apply to
a non-stationary world. This is especially a problem in a pandemic.
Academic researchers keep using defective models if they can get them tenure
and promotions with the help of journal referees who belong to the same clubs.
Hi Jagdish,
**How to Mislead With Statistics
Part of the problem in analyzing poverty in the USA arises from how we
measure it.
According to The
Heritage Foundation, the federal poverty line also
excludes income other than cash income, especially welfare benefits. Thus,
if food
stamps and public
housing were successfully raising
the standard of living for poverty stricken individuals, then the poverty
line figures would not shift, since
they do not consider the income equivalents of such entitlements.[57]\\
Steven Pinker,
writing in an op-ed for The
Wall Street Journal, claims
that the poverty rate, as measured by consumption, has fallen from 11% in
1988 to 3% in 2018.[58] Burkhauser
et al. find that accounting for cash income, taxes, and major in-kind
transfers and updating poverty thresholds for inflation show that a
Full-income Poverty Rate based on President Johnson's standards fell from
19.5 percent to 2.3 percent over the 1963–2017 period.[59]
Think for example of what Medicaid has done for health care and long-term
nursing services that is excluded from the poverty statistics. Millions of
middle class Americans are trying to make their parents poor enough to qualify
for free Medicaid long term Care.
One of the huge exclusions is income in the underground economy that is never
reported and analyzed in poverty statistics. A USA article once estimated this
unreported and untaxed income to be over $2 trillion. In San Antonio we saw a
lot of this where house cleaners often earned over $30 per hour in the
underground economy while collecting aid to dependent children and Medicaid
benefits while bringing home $30 per hour in unreported income.
Why do housecleaners earn over $30 per hour? Partly its quality of service,
but the major share of that high wage is an established reputation for
reliability and honesty. Word spreads very quickly when a reliable and honest
maid is discovered.
Bob
**How to Mislead With Statistics (by avoiding key variables)
Are Home Prices in Black Neighborhoods Underpriced? ---
https://www.thestreet.com/mishtalk/economics/are-home-prices-in-black-neighborhoods-underpriced
Jensen Comment
Read the article for examples of how the statistics are misleading in this
study. However, the article misses several main points. Firstly, it does not
mention crime statistics for black neighborhoods. Secondly, it does not mention
that many black neighborhoods like those in Chicago are centers for dangerous
gangs and gang warfare. Thirdly, I don't know how an analyst makes adjustments
for public education troubles and "walkability" troubles for whites in most
black neighborhoods.
And there are some seemingly little things that are not so little in terms of
real estate value. Because many prosecutors are not discouraging shoplifting
crime in low income neighborhoods (think of Los Angeles that no longer
prosecutes teenage misdemeanors) retail businesses like supermarkets and big box
stores are avoiding low income neighborhoods. This in turn, affects real estate
values, since shopping is no longer convenient in those neighborhoods. There are
other inconveniences such as having worse taxi pickup services in high crime
neighborhoods.
**How to mislead with statistics
This is the best versus worst states to retire: An illustration of the
most absurd rankings yet -
https://www.blacktowerus.com/the-best-us-states-for-retirees/#section02
What's misleading about this ranking?
First let's consider a few clues.
The popular retirement state of Florida is a Rank 1 while another popular
retirement state Arizona is at Rank at Rank 27 and popular Nevada is at Rank 47?
High tax state Illinois is at Rank 9 while equally high tax state California is
at Rank 19 and New York is at Rank 17?
What makes Illinois so great relative to Arizona and Nevada? Or is Illinois even
a popular retirement state for persons not having lived in Illinois for most of
their lives?
We know for certain that Arizona and
Nevada are popular retirement states for people who have not lived in those
states for most of their lives.
Freezing Minnesota with its high taxes comes in comes in at Rank 2 as a
better retirement state than 48 other states.
Is Minnesota really a popular retirement state for people who did not live in
Minnesota most of their lives?
What's going on here?
The first thing that's wrong is that within most any state outliers distort
the numeric criteria used in the above rankings. For example, in New York State
the high real estate average price is distorted greatly by the millions homes in
the largest cities of New York and its closest suburbs. But persons seeking
retirement in up state New York can make much better deals by distancing
themselves from NYC.
Secondly, real estate price averages are distorted by prices of large family
homes with four bedrooms or more. Millions of people retiring however are
scaling down into smaller retirement town houses. condos, mobile homes, or
apartments that provide much cheaper alternatives such as those found in popular
retirement communities. My point is that real estate average prices for an
entire state like Arizona or Nevada are not relevant to average prices for
smaller alternatives being sought out by the majority of retirees.
Thirdly, the main drivers of housing costs in most parts of any state are
quality of public schools and commuting times to jobs. It's most likely that
retirees are seeking to escape from high property taxes that accompany public
school quality since retirees are no longer concerned with schools for their
children. And retirees no longer concern themselves with commuting times for
work.
The above ranking also relies upon a state's average life expectancy. This is
an absurd criterion for retirees seeking to move out of state for retirement.
Life expectancy is more apt to be influenced by where people grew up and spent
90% of their younger years rather than the influence of the last 10% of their
lives. By the time they retire their
doctors have already taken away booze, fatty foods, sugar, and high caloric
goodies. And retirees still suffer from the former stresses of their work and
commuting hours.
Now let's consider the crime variable used in this study. There can be a huge
denominator impact here where state population impacts crime risk
unrealistically. Alaska's crime average is relatively high because the state's
population denominator is so small. The same is true for Nevada, New Mexico,
etc. Crime variables can also be badly distorted by outliers like high
population NYC, Los Angeles, Dallas, Houston, New Orleans, Atlanta, Chicago,
etc. And high crime cities are not usually where out-of-state retirees are
headed within a state. What person from Iowa wants to retire in Chicago or
Detroit? Give Iowa retirees Iowa, Arizona, Arkansas, or Texas.
The same problem exists with using percent of older people within a state.
The first thing to note is that there is not a whole lot of variation in this
variable. Yeah, Alaska has a lower senior citizen rate, but the neighborhood
variable is not relevant to most older Alaskans. Most retirees are not leaving
Alaska because there are not enough older people in the neighborhood. Most
retirees are leaving Alaska because there are so few daylight hours much of the
year, it's cold most of the year, and the children no longer live in Alaska
because there were no job opportunities. Many retirees leave Alaska to be closer
to their children rather than live closer to old farts like themselves.
The bottom line is that this is a quant study that did not include the main
variable --- where people really are retiring. It looked that five variables
that badly generated misleading conclusions.
Minnesota is not the Number 2 sought after retirement location in the USA
even if the fishing is pretty good.
Illinois is not the Number 9 sought after retirement location in the USA even
if ????? (I can't think of a retirement attraction for Illinois).
Texas is a relatively popular retirement state because it's quite likely one
or more of the children found work in Texas --- a factor not taken into
consideration in this ranking of states. Retirees often like to be closer to
their children and grandchildren.
**How to Mislead With
Statistics
Critique of an Article on
Machine Learning in the Detection of Accounting Fraud ---
https://econjwatch.org/articles/critique-of-an-article-on-machine-learning-in-the-detection-of-accounting-fraud
This
critique examines the results of an article that applies machine learning to
the detection of accounting fraud, published in Journal of Accounting
Research. Their key finding is that machine learning improved fraud
detection by 70 percent above a previously published logistic regression.
The authors make their data and Matlab code available at Github. Using their
files, I replicate their study. Upon closer inspection, we see that some
fraudulent firms were contained in both the training and test samples, which
improves the results of their model, but contradicts what was described in
the published paper. I asked the authors about this issue and gratefully
received a response. The response is quoted in the present critique. Getting
a proper assessment of the potential of machine learning is important, as
such techniques and models are relied upon by industry practitioners and
regulators, including the Securities and Exchange Commission
Jensen Comment
Their key finding is that "machine learning improved fraud detection by 70
percent above a previously published logistic regression." What is unsaid is how
good logistic rejection is in detecting fraud. The answer is that it's not all
that great relative to the most important techniques for detecting fraud such as
whistle blowing incentives and internal controls. In fairness, logistic
regression has gotten somewhat better ---
https://ieeexplore.ieee.org/abstract/document/5946108
However, accounting fraud is heavily dependent upon weaknesses in internal
controls combined with whistle blowing incentives to report fraud.
**How to Mislead With Statistics: Failure to Recognize Externalities
Externality ---
https://en.wikipedia.org/wiki/Externality
Boston schools wanted to stagger start times to save on transportation
costs and improve student health. Here's why parents were against it — and what
it can teach us about pandemic planning ---
https://www.businessinsider.com/why-some-boston-parents-were-against-staggered-school-start-times-2020-10
Jensen Comment
The school districts primarily considered parties most directly involved in
start-time decisions --- students, teachers, and taxpayers who pay the
transportation costs. Parents are more indirectly and variably involved. For
example, stay-at-home parents and parents now working remotely in a majority of
homes may be less concerned than working parentshaving to physically commute to
work on tight schedules. Those parents with less scheduling flexibility
became powerful voices in this illustration.
**How to Mislead With Statistics:
'Big 4' salaries, revealed: How much Deloitte, KPMG, EY, and PwC
accountants and consultants make, from entry level to executive roles ---
https://www.businessinsider.com/salary-of-consultants-accountants-big-4-deloitte-kpmg-ey-pwc-2020-7?nr_email_referer=1&utm_source=Sailthru&utm_medium=email&utm_content=Business_Insider_select&pt=385758&ct=Sailthru_BI_Newsletters&mt=8&utm_campaign=Insider%20Select%202021-01-06&utm_term=INSIDER%20SELECT%20-%20ENGAGED%2C%20ACTIVE%2C%20PASSIVE%2C%20DISENGAGED%2C%20NEW
-
In 2019, the so called
"Big Four" accounting firms — PricewaterhouseCoopers (PwC), KPMG,
Ernst & Young (EY), and Deloitte — employed well
over a million people.
-
These firms are known
for paying employees six-figure salaries right out of business
school.
-
To figure out how much
accountants and consultants make at these firms, Business Insider
analyzed the US
Office of Foreign Labor Certification's 2020 disclosure data for
permanent and temporary foreign workers.
-
For example, some
analysts and auditors made more than $120,000 at Ernst & Young (EY),
principals were given up to $950,000 in compensation at KPMG, and
managers at PwC made $123,019 or more.
The so called "Big
Four" accounting firms — PricewaterhouseCoopers (PwC), KPMG, Ernst & Young (EY),
and Deloitte — are known for paying their staff high salaries.
In 2019, the four firms combined employed well
over a million people worldwide. New
hires typically earn six-figure salaries from the get-go. An entry-level
consultant who just graduated from business school can make more
than $200,000 a year at the four firms when
you include base salary, bonuses, and relocation expenses.
The Big Four firms are planning to hire in 2021. A
spokeswoman at PwC previously told Insider that the firm typically brings in
13,000 entry-level and experienced employees on a yearly basis, and its
hiring volume for interns and full-time workers will be similar this year.
Deloitte and EY are both planning to expand
their workforces in India.
Insider analyzed the US
Office of Foreign Labor Certification's 2020 disclosure data for
permanent and temporary foreign workers to find out what PwC, KPMG, EY, and
Deloitte paid employees for jobs ranging from entry-level to executive
roles. The salary data analyzed were based across the US.
We looked through entries specifically for
roles related to management consulting and accounting. Performance bonuses,
signing bonuses, and compensation other than base salaries are not reflected
in this data.
Here's how much PwC, KPMG, EY, and Deloitte
paid their hires last year.
Deloitte is organized
into three main service areas that offer
different salaries. These areas include the human capital division, the
strategy and operations division, and the technology division. Deloitte had
the greatest
number of employees, topping
312,028 in 2019, according
to research platform Statista.
It also applied for the greatest number of
visas compared to other leading consultancies. The company applied for 7,444
visas in the last half of 2019 and the first half of 2020. Deloitte did not
immediately respond to a request for comment on the salary data.
Deloitte delayed many of its full-time hires' start
dates, shortened internship programs for students, and laid off 5,000
US workers and 200
people in Canada in response to the
coronavirus pandemic.
Here are the salary ranges for consulting and
accounting roles:
-
Analyst: $58,261
to $116,500 (includes analysts specialized in business, human capital,
project delivery, and solutions)
-
Consultant:
$91,000 to $122,100
-
Senior consultant: $81,167
to $118,384
-
Manager: $107,640
to $160,480
-
Senior manager: $187,253
-
Consulting managing
director: $191,300
-
Audit and assurance
assistant: $58,822
-
Tax consultant: $47,570
to $55,195
-
Tax senior
manager: $124,909
Continued in article
Jensen Comment
Averages almost always are misleading without knowing standard deviations and
skewness. The most misleading part of this is differences in cost of
living. A $125,000 salary does not go far in San Francisco, London, or anywhere
in Switzerland. It goes quite a ways in Des Moines, San Antonio, and
Tallahassee.
My advice to my graduate students about to go to work full time was to almost
ignore starting salaries and look at the more important aspects of the first
job, including training, type of experiences, direct contact with clients, etc.
Especially important was and still is the type of training and experience. One
of my best graduating students in the specialty of accounting for financial
derivatives and hedging activities went with the Big Four that promised to let
him work mostly for a client in Houston having billions or dollars in derivative
contracts. In short time that student became a genuine expert on FAS 133 and
IFRS 39 to a point that in about six years he took on a new job as a financial
executive with Microsoft. Guess why Microsoft needed him?
One of my students who spoke Russian went with a firm that would send him to
Moscow. By doing so he was offered a partnership in a Big Four firm in what I
consider to almost be record time relative to his classmates that went with the
Big Four in the USA.
Sometimes my students complained that auditing and tax graduates are offered
less from the large accounting firms relative new graduates in engineering. I
consoled them by saying that accounting can often be a faster track to the
executive suite, especially the executive suite in finance and accounting.
Corporations often hire very few, if any, new (entry-level) graduates in
accounting. But they make very good deals with accountants who have become
specialized (think derivatives accounting, insurance accounting, lease
accounting, SEC accounting, etc.) after a few years of working for large
accounting firms.
There's also another aspect of high paying jobs to consider. Consultants in
the Big Four often start at higher salaries, but they are constantly living
under pressures to obtain new clients. Audit and tax clients, on the other hand,
tend to be the same clients year after year. For example, KPMG audited GE for
over 100 years before finally losing GE as an audit client. In comparison, KPMG
consultants had to keep competing for new consulting contracts year after year.
It can be very tedious writing consulting proposals year after year after year.
Another thing to contemplate when offered what seems like a huge starting
salary. The thing to ask is how much of that salary is based upon commissions
that create a lot of tensions on the job, especially when there is stiff
competition coming from other consulting firms writing proposals.
**How to
Mislead With Statistics
Coronavirus Update:
Australia and Norway share nearly the same number of COVID-19 infections, around
5,800, despite Norway being more than four times smaller in population ---
https://gisanddata.maps.arcgis.com/apps/opsdashboard/index.html?utm_term=OZY&utm_source=Sailthru&utm_medium=email&utm_campaign=PDB%20%282020-04-06%2011:07:40%29#/85320e2ea5424dfaaa75ae62e5c06e61
The link is to the database, but in a newsletter from OZY on April 6, 2020 ---
Actually it's a very good newsletter that I read daily
Is there any nation on earth
that can social distance better than Australia?
Norway has slightly under 150,000 square miles
Australia has 7.6 million square miles.
Politically Incorrect Paper of the Day: The
Persistence of Pay Inequality ---
https://marginalrevolution.com/marginalrevolution/2020/10/politically-incorrect-paper-of-the-day-the-persistence-of-pay-inequality.html
**Missing Variables
How to Mislead With Statistics (Missing Variables)
The White-Collar Job Apocalypse That Didn’t Happen ---
https://www.nytimes.com/2019/09/27/business/economy/jobs-offshoring.html?action=click&module=Top
Stories&pgtype=Homepage
. . .
Economists once warned that office
jobs in the United States would soon follow factory jobs in moving overseas.
New research suggests that jobs may be moving to other parts of the country
instead.
A widely covered
2007 study
by Alan
S. Blinder, a Princeton economist and former Clinton administration
official, estimated that a quarter or more of jobs were vulnerable within
the next decade. But many companies discovered that labor savings were
offset by other factors: time differences, language barriers, legal hurdles
and the simple challenge of coordinating work half a world away. In some
cases, companies decided they were better off moving jobs to less expensive
parts of the United States rather than out of the country.
“Where in retrospect I
missed the boat is in thinking that the gigantic gap in labor costs between
here and India would push it to India rather than to South Dakota,” Mr.
Blinder said in a recent interview. “There were other aspects of the costs
to moving the activities that we weren’t thinking about very much back then
when people were worrying about offshoring.”
In his 2007 paper, Mr.
Blinder scored occupations on a 1-to-100 scale based on how easily they
could be sent offshore. Bus drivers and electricians scored near the bottom.
There is pretty much no way to do that work from afar. On the other end of
the spectrum were computer programmers and telemarketers — jobs that in many
cases were already being sent overseas.
In a
follow-up paper released Friday,
another economist, Adam Ozimek, revisited Mr. Blinder’s analysis to see what
had happened over the past decade. Some job categories that Mr. Blinder
identified as vulnerable, like data-entry workers, have seen a decline in
United States employment. But the ranks of others, like actuaries, have
continued to grow.
Over all, of the 26 occupations that Mr. Blinder
identified as “highly offshorable” and for which Mr. Ozimek had data, 15
have added jobs over the past decade and 11 have cut them. Altogether, those
occupations have eliminated fewer than 200,000 jobs over 10 years, hardly
the millions that many feared. A second tier of jobs — which Mr. Blinder
labeled “offshorable” — has actually added more than 1.5 million jobs.
Continued in article
**
How to Mislead With
Statistics
Estimating the COVID-19
Infection Rate: Anatomy of an Inference Problem ---
https://marginalrevolution.com/marginalrevolution/2020/04/estimating-the-covid-19-infection-rate-anatomy-of-an-inference-problem.html
How to Mislead With Statistics
The Hard Truth Of Poker —
And Life: You’re Never ‘Due’ For Good Cards ---
https://fivethirtyeight.com/features/the-hard-truth-of-poker-and-life-youre-never-due-for-good-cards/
Jensen Comment
Never Say Never
Much depends upon whether you're talking about the next play (flip, hand, roll,
game) in a succession of plays. Consider the flipping of a fair coin in which
you always bet on "heads." You're never due for a head on any given flip. The
probability head is always 50% as long as the coin is fair. However, probability
of not getting a single head in a million flips is virtually (asymptotically)
zero. This is why casinos will never allow you to keep doubling your bet with
each successive play for an unlimited number of plays of any casino game. In
other words casino owners are well aware of the St. Petersburg Paradox.
St. Pertersburg Paradox ---
https://en.wikipedia.org/wiki/St._Petersburg_paradox#The_paradox
Thus the odds of not getting a
head on the first coin flip is 1/2. But the odds of not getting a head in the
first two flips is 1/4=(1/2)(1/2). The odds of not getting a head in the first
three flips is 1/8 etc.
Thus to claim you are "not due"
for a head on any single flip is correct. But to say your are "not due" for the
first head in a succession of flips is not mathematically correct. The
probability of getting the first head in a succession of flips keeps increasing
toward a 100% probability.
Of course with poker this
becomes more complicated since there are so many more outcomes or each hand that
is dealt and strategy comes into play. In penny ante poker that strategy does
not usually entail bluffing. But in high stakes poker bluffing also becomes a
major part of the play and messes up mathematical probabilities a great deal.
This is why most poker games
have constraints.
One constraint is a betting limit for each hand played.
Another constraint is usually a preset quitting time, especially in penny ante
poker.
In penny ante poker who wins the most in a night usually depends greatly upon
that preset quitting time when betting limits are in place and bluffing is a
hopeless strategy.
And if your strategy is to
frequently call bluffs of a given player in the game of higher stakes poker you
are increasingly due to win a hand since the probability of a bluffer always
having the winning hand become successively very low as the night goes on. That
of course does not mean that you are more likely to be a winner for the night.
**How to Mislead With
Statistics
How a Physics Department
Became One of the Country’s Largest Producers of Majors ---
https://www.chronicle.com/article/How-a-Physics-Department/248121?utm_source=at&utm_medium=en&utm_source=Iterable&utm_medium=email&utm_campaign=campaign_1054225&cid=at&source=ams&sourceId=296279
The article does not discuss job availability.
Jensen Comment
If true this is popularity among majors is exceptional since physics is not even
included in the US News rankings of the Top 100 Best Jobs ---
https://money.usnews.com/careers/best-jobs/rankings/the-100-best-jobs
Jensen Comment
It seems to me that somewhere "Physics" jobs would be included in the
above rankings if physics is now becoming an extremely popular major in the USA.
Be aware that there are many
limitations in the above rankings of "Best Jobs." The first clue is that the
rankings rate physical therapists above some types of physicians. Say what? What
physician would rather be a physical therapist? The second clue is that all
lawyers are lumped together as one occupation. Lawyers in reality vary
enormously in terms of compensation and job types (think patent attorney versus
personal injury lawyer versus FBI agent) that I doubt that any one ranking
of "Lawyers" means much. The same is true of "Accountants" (thank CFOs versus
FBI agents versus payroll clerks) and many of the other "Jobs" ranked above.
The adjective "Best" is really
a multivariate thing when it comes to careers. For example, in the following
ranking of STEM specialties, "Atomic or Molecular Physics" comes out at Rank 2.
However, among the subcategories of "job availability" these physicists end up
at Rank 65 ---
https://www.worldwidelearn.com/education-rankings/25-best-stem-majors.html
**How to Mislead With Opinion Surveys (missing variables)
'Someone is going to die in this truck': Amazon drivers and managers describe
harrowing deliveries inside trucks with 'bald tires,' broken mirrors, and faulty
brakes ---
https://www.businessinsider.com/amazon-drivers-say-some-delivery-trucks-are-falling-apart-2018-9
Jensen Comment
I'm not saying that the opinion surveys are misleading. But I am saying that the
article ignores the fact that most states now have fairly rigorous annual state
inspections of vehicles. It's possible that the regulations for those
inspections are not rigorous enough for delivery vehicles, but the two states
I've lived in do not permit 'bald tires,' broken mirrors, and faulty brakes,
broken windows, exhaust systems, etc. And state troopers can ticket inspected
vehicles that have safety defects such as broken mirrors, lights, and windows.
What is misleading is that these delivery companies often serve other vendors
as well. The tone of the article is anti-Amazon like maybe there's some bias in
the article.
What I found during the NH and Texas inspections of my own vehicles is that
the inspectors are really rigorous when it comes to brakes and exhaust systems.
The least bit of rust on rotors for example gives inspectors and excuse to
require new brakes. The least bit of rust on mufflers and exhaust pipes leads to
requiring new replacements. Of course there are often conflicts of interest
where the inspectors are also employees of repair facilities. But, in my
experience, the inspectors are willing to let you see the reason for negative
reports.
I think inspections should be more frequent for heavily driven vehicles like
taxis and deliver vehicles --- perhaps at least twice a year.
Amazon should use only reputable delivery companies that have deep enough
pockets for lawsuits. Up here in the boondocks the only Amazon deliveries are
made by UTS, FedEx, or the USPS.
**How to Mislead With Statistics
Here are the best colleges in America according to U.S. News & World
Report for 2019 ---
https://www.10news.com/news/national/here-are-the-best-colleges-in-america-according-to-u-s-news-world-report
Jensen Comment
What I have to say about best college rankings is ditto what I have to say below
about hardest colleges to get into. In mathematics we say that those many-to-one
transformations can be terribly misleading.
Hardest Colleges to Get Into in the USA
https://247wallst.com/special-report/2019/09/06/hardest-colleges-to-get-into/?utm_source=247WallStDailyNewsletter&utm_medium=email&utm_campaign=DailyNewsletter&utm_content=SEP102019a
Jensen Comment
I don't dispute the that the rankings are somewhat meaningful. What I dispute is
the ignoring of some of the criteria used for admissions --- often unique
combinations of criteria.
Admission to a prestigious university is a multivariate combination of
factors, and it's misleading to rank universities on a superficial subset of the
variables evaluated in the admissions process.
The first thing to do is to totally ignore the "acceptance ratio" criterion.
It costs money to apply to these universities. And most students across the USA
don't waste their time and money applying to colleges where they have little or
no chance of gaining acceptance. Hence, the denominator of an "acceptance ratio"
for Cal Tech or Harvard is misleading from get go due to self selection of what
schools a student tries to get into. The denominator may have much more meaning
for applicants to the Rank 50 university than to the Rank 1 university.
The second thing to do is to recognize that almost all (although not all)
applicants to schools like Cal Tech and Harvard have very high SAT scores plus
4.0 grade averages from their high schools. Cal Tech and Harvard need some other
criteria to pick the best from the best. And often those criteria are somewhat
unique and can't be easily compared. Purportedly, Marjory Stoneman Douglas High
School's David Hogg was did not have a stellar SAT score, but he was admitted to
Harvard for some other criteria not comparable with most other applicants ---
https://en.wikipedia.org/wiki/David_Hogg_(activist)
Many students are admitted to a prestigious university because of unique life
experiences that are both interesting and unlike experiences of other
applicants.
Those life experiences can't be quantifies in a ranking such as the one
above.
What's interesting to me is the unique qualifications of students who are
admitted to prestigious universities barely after reaching puberty (think 14
years old). What makes them so worthy of admission at such a young age.
A related question that I will probably never see answered is whether its
more common to flunk out of Cal Tech than Harvard among students that are really
trying to graduate and have no severe mental health issues. My priors are that
Harvard can be pretty easy once you're admitted, although there are exceptions
for certain disciplines that weaker students typically avoid.
One of my former girlfriends from decades ago was called to her chemistry
professor's office. He promised to give her a C in introductory physical
chemistry if she promised to change her major out of chemistry. She eventually
graduated in nursing.
**How to Mislead With Statistics
How classroom technology is holding students back ---
https://www.technologyreview.com/s/614893/classroom-technology-holding-students-back-edtech-kids-education/
Jensen Comment
I would not object if the title of the article was changed to "holding some
students back." Technology is not for everybody, especially those less able
and/or less motivated to learn. But it is espcially suited to our most motivated
top students. Time and time again the "No Significant Differences" empirical
outcomes show that pedagogy does not matter for our top students --- they excel
in any learning environment ---
http://faculty.trinity.edu/rjensen/assess.htm#AssessmentIssues
Where pedagogy matters most is with students who are not motivated to learn
for whatever reason, including being slow learners. An example is where some
prison inmates are able to learn much better from technology than other prison
inmates. In prisons the students are much less likely to encounter great
teachers than they are in colleges. And yet in prisons some, certainly not all,
of the students excel beyond most college students by using technologies to
learn on their own ---
https://www.inc.com/chris-denson/how-visiting-a-prison-changed-this-investors-life-forever.html?cid=search
I return to my oft repeated example at BYU where the first two accounting
courses are video courses where students mostly learn on their own or in teams.
---
http://faculty.trinity.edu/rjensen/000aaa/thetools.htm#BYUvideo
This pedagogy works at BYU because nearly every accounting student at BYU is
highly motivated to learn accounting. The pedagogy is less successful in
community colleges where there are a greater proportion of low motivated
learners.
Even at BYU video courses would be less successful in advanced accounting
courses where students tend to learn more from their professors and from each
other, especially in case-method Socratic courses.
**How to Mislead With
Statistics
Americans without college
degree dying 3 years earlier — even before COVID-19 ---
https://www.studyfinds.org/americans-without-college-education-die-earlier/
Jensen Comment
Would
Labron James have had a longer life expectancy if he'd earned a college
degree before becoming an NBA superstar?
The misleading part of this
study is that if a high school graduate who wants a longer life may be led to
believe a good thing to do is extend
life with a college diploma.
Firstly, this is misleading
because there are many underlying causal factors of shorter longevity (think
Down Syndrome or autism). It may well be that a larger portion of persons
without college degrees are likely to have these life shortening factors. But
not all people without college degrees have these factors such that a particular
person without a college degree
chosen at random has as much or more life expectancy than a Ph.D. or a medical
doctor chosen at random.
Secondly, there are vast
differences in college degrees that can affect careers that, in turn, affect
life expectancy. Some college graduates have very stressful careers that can
shorten life expectancy. Others have secure and relatively routine careers with
low stress.
Thirdly, is a there a whole lot
of difference in life expectancy between stay-at-home parents who have degrees
versus those who have no degrees? Many college graduates who spend full
time raising their children at home get jobs afterwards that do not require
college degrees.
**How to Mislead With Statistics (missing variables)
American Economic Review: Who Pays for the
Minimum Wage? ---
https://www.aeaweb.org/articles?id=10.1257/aer.20171445&&from=f
Jensen
Comment
This is one of those studies with conclusions that are embedded in a whole lot
of unmentioned caveats. For example:
Does Hungary have anything close to the $2 trillion underground economy that
provides alternatives to the minimum wage for both employers and employees?
Are
there enormous differences between industries such as restaurant workers
versus landscape workers (in Texas there are probably more landscape workers
working in the underground economy than the
economy paying more and providing benefits)?
My own
opinion is that having an enormous underground economy changes everything about
minimum wage conclusions. Interestingly the underground economy may pay much
more than minimum wage, especially when there are skills (think auto mechanics)
or risks (think farm and yard chemicals) or enormous discomforts (think of
working on a metal roof under Arizona's sun). But even when there relatively
high wages there are seldom underground economy benefits like medical insurance
and unemployment compensation and pension contributions.
Bob
Jensen's threads on the underground economy ---
http://www.cs.trinity.edu/~rjensen/temp/TaxNoTax.htm#Poor
**How to Mislead With Statistics
U.S. Funding for University Research Continues to Slide ---
https://itif.org/publications/2019/10/21/us-funding-university-research-continues-slide
The United States continues to fall further behind
world leaders in funding for university research. To reverse course, it
should increase support by $45 billion per year and provide stronger
incentives for businesses to increase their investments.
KEY TAKEAWAYS
Research
universities play a critical role in generating innovation-based economic
growth and driving U.S. global innovation leadership.
According to the
most recent OECD data, the United States has slid to 28th of 39 nations in
government funding for university research as a share of GDP, with the 12
leading governments investing more than double the U.S. investment.
Between 2011 and
2017, U.S. government funding for university research as a share of GDP fell
by nearly a quarter—0.06 percentage points. On average, nations decreased
0.03 percent of GDP during that time.
Congress should
commit to increasing university research support by $45 billion per year,
which would place the United States among the top seven nations in the world
in funding for university research.
Congress
should also expand the energy-related collaborative research and
experimentation tax credit to apply to any field of university research
investment—not just energy research—made by businesses.
Continued in article
Jensen Comment
How can these statistics possibly be misleading? One huge way is in failing
to count much of the research funding. For example, in the USA universities have
undergraduate and graduate business programs to a much larger extent than
colleges and universities in the rest of the world. Indeed the business college
on a USA campus is often the largest college on a university campus, especially
in most state-supported universities. There are also large humanities programs
such as modern languages. Whereas science and engineering colleges on campus
rely heavily on government and business research grants, the colleges of
business and humanities have few such grants counted in the above study as
"research." However, in colleges of business and humanities the tenure and
performances of faculty are heavily weighted on research performance. Over the
years teaching loads of upwards of five courses per semester dropped to two or
three courses per semester to support the research mission. In graduate schools
of business it is now common to only require one or two course preparations per
year. Plus most universities fund sabbatical leaves and summer research.
My point here is that in the USA much of the funding for business and
humanities research did not get counted in the above study. Faculty instead get
teaching relief and other university stipends that were overlooked in the above
study. In other parts of the world business education programs, if they exist at
all on campus, are part of science divisions (think economics) where government
research grants are more readily available than they are for business colleges
in the USA.
If research funding is so great in Switzerland, Norway, and Denmark why don't
the Chinese and Russians spend billions more trying to steal their research
relative to what is spent trying to steal the research of the USA?
Apart from university campuses, the above study ignores much of the research
taking place in business and government in the USA. The problem is that research
funding is confounded with funding of other job duties. The best example here is
product development in business firms where research is only part of the entire
heavily-funded total operation of product development. It's virtually impossible
to separate what part of product funding is development and what part is
comprised of other aspects of product development.
The above study ignores output volumes in terms of research publications of
the largest countries like the USA, China, and India. My hunch (strictly a guess
at this point) is that the USA, China, and India produce more research
publications than the rest of the world combined, although counting home
countries of authors gets complicated because of the rise in joint authorships
between USA authors and foreign authors.
The above study ignores funding of research facilities (link science,
medical, and computing laboratories in universities and business firms) where
the USA dominates.
If the other nations of the world are doing such a great job funding research
where are their new patents?
New Drug Patents by Country ---
https://www.americanactionforum.org/wp-content/uploads/2016/05/2016-05-17-Drug-Patents-Checkup.pdf
Over the past half century, the United States
has been the birthplace of the majority of the world’s biomedical
innovations.1 Despite a global slowdown in the development of new medical
interventions, due to the scientific shift towards more complex biologic
treatments, innovation in the U.S. has remained relatively steady thanks to
strong financial incentives to invest in research and development (R&D). In
fact, the below chart may underrepresent American contributions to
pharmacological breakthroughs in the past two decades as a result of U.S.
corporations relocating their headquarters to Switzerland and the U.K. to
take advantage of those countries’ lower corporate tax rates.
Jensen Comment
This does not justify some of the evil pricing schemes of big pharma in the USA,
especially pricing by patent trolls. But it does illustrate how complicated the
invention of biomedical innovations (that includes more than drugs) becomes,
especially when comparing the USA with the more highly populated European Union.
Why doesn't the EU lead in discovery of biomedical innovations? Why aren't
Russia and China inventing new biomedical innovations as fast as they are
inventing technology innovations?
I think that the highly defective and misleading ranking of nations on the
basis of research funding is secretly political in a subtle scare-tactic effort
to get lawmakers to greatly increase taxpayer funding of research in the USA. It
would be more meaningful if it did not leave out so much data on the total
funding of research in the USA.
US poverty statistics ignore millions of struggling Americans
---
https://theconversation.com/us-poverty-statistics-ignore-millions-of-struggling-americans-118321
Jensen Comment
Firstly, the really poor in the USA are eligible for Medicaid. The article
argues that a family making $50,000 is poor if it does not have medical
insurance. Such a family has made a resource allocation decision not to pay for
medical insurance, instead preferring other things such as a newer car, two
cars, a larger home, etc. This article overstates its case. I have a friend from
India who says Americans really don't understand what it is to be poor.
**How to mislead with statistics and rankings
The Worst Jobs in America ---
https://247wallst.com/special-report/2019/04/18/the-worst-jobs-in-america/6/
Jensen Comment
This is a perfect example of missing variables, especially focus of pay without
examining benefits. For example, enlisting in the military is ranked as the
fifth worst job in the USA. Granted the job entails danger and stress in combat
zones with low pay. However, only a small proportion of enlisted military end up
in combat zones. What the article fails to mention are the great benefits such
as retirement pay for life after 20-30 years, often with great job skills
because of the free training and experience from pilot training to computer
skills to medical training. Not mentioned is free college education even for
those who only serve four years. Not mentioned is the possible free medical
insurance for yourself and your spouse for an entire lifetime without having to
wait for Medicare.
This is another one of those highly misleading rankings in other respects.
Think about it for a minute. Many 18-year old high school graduates go into the
military and retire with a pension, job skills, and free medical insurance for
life after they retire at the relatively young age of 38. That's not to say
their aren't drawbacks. Although most enlisted personnel do not end up in combat
zones, most end up with lots and travel and job relocations that are tough on
young families.
**How to Mislead With Statistics
Who Got the Better MLB Contract—Bryce Harper or Manny Machado?
https://www.theatlantic.com/entertainment/archive/2019/03/bryce-harper-or-manny-machado-better-mlb-contract/584644/
Jensen Comment
The above article is misleading because it leaves out taxes. Most financial
recommendations are misleading if they don't factor in taxes. Manny Machado gets
clobbered with income tax.
Why California's Income Tax Should Not Be
Ignored
Bryce Harper Will Save Tens Of Millions In Taxes By Spurning California Teams
---
https://taxprof.typepad.com/taxprof_blog/2019/03/bryce-harper-will-save-tens-of-millions-in-taxes-by-spurning-the-dodgers-and-giants.html
**
How
to Mislead With Statistics
The Most Expensive Colleges That Paid Off the Least ---
https://247wallst.com/special-report/2019/08/21/most-expensive-colleges-that-pay-off-the-least/?utm_source=247WallStDailyNewsletter&utm_medium=email&utm_campaign=DailyNewsletter&utm_content=AUG222019a
Jensen Comment
The major deception here is that salary outcomes of graduates are not as
important to many (not all) of the colleges being ranked in this article.
Generally students go to music conservatories and art institutes to become good
at their crafts knowing full well that their crafts are not likely to great
money makers.
There are some colleges on this list where the median earnings criterion is a
somewhat better criterion (think Southern New Hampshire University). However,
medians suffer from the usual limitations unless we have additional information
on standard deviations and skewness. It could be that the medians (like
averages) are being pulled down by low performers in life. This, in turn, begs
the question of why there are so many low performers? One answer might be the
admission of a serious number of students with poor prospects of job
performance. In another study we might list rank those expensive colleges that
paid off the best, and get the Ivy League schools plus Stanford, Chicago, etc.
But the admission standards are so high to those universities that if those same
students would probably do about as well graduating from the University of
Southern New Hampshire.
The University of Southern New Hampshire is not unlike a lot of other
universities and colleges on this list that accept applicants with low
qualifications. The USNH made the list largely because it is also one of the
most expensive schools admitting lower quality students.
How to Mislead With Statistics
CNN: College grads earn $30,000 a year more than people with just a
high school degree ---
https://www.cnn.com/2019/06/06/success/college-worth-it/index.html
Jensen Comment
This study has the common misleading conclusions due to comparing averages
without also looking at variances and skewness. When Warren Buffett walks into a
restaurant having 50 diners the average customer becomes a billionaire for a few
moments.
The study is misleading because it lumps "college graduates" into one
sampling population. There are college graduates with four-year degrees,
five-year-degrees, and all the way up to brain surgeons who did not become fully
licensed until 12 years after graduating from high school. And among non-college
graduates there are those who had drive taxi cabs versus those who became
skilled airliner mechanics.
Incomes of both college graduates and non- college graduates are highly
skewed below means and medians. Think of all the parents where one parent mostly
stays at home to care for children, thereby having zero or very low part-time
wages. Since more than half of the high school graduates do not earn have
a college degree this makes the parental skewness more pronounced in the
non-college population.
There are huge measurement problems. Think of all the partners raising
children full time earn virtually zero in wages while sharing in the income of
their partners who have college degrees. My point is that these
measuring one parent's earnings as zero is misleading in
terms of family income.
And think of the many farm couples who really are partners in the earnings of
the farm. How do you partition the farm income between one spouse who has a
college degree from the other spouse who did not complete college?
Then there's the mistake of comparing "earnings" without comparing living
costs. College graduates more often are going to take jobs in urban areas where
both wages and living costs are higher then in rural areas Teachers make
more in Manhattan than in a small town because it costs outrageously more to
live in Manhattan. A carpenter in Swea City, Iowa can live a lot better on
$48,000 per year than many carpenters in Des Moines making higher wages. And a
college graduate cannot find a chemical engineering job in Swea City and is
forced to move to Des Moines or an more costly larger city.
And there's a huge problem of comparing workers in terms of lifetime
benefits. The high school graduate who elects to join the low-wage Air Force
rather than go to college does not end up so bad at Age 38 with a pension, free
medical care, and free medications for the remainder of her life while her best
friend became a third-grade teacher and cannot retire at Age 38 with any
lifetime benefits until reaching Social Security and Medicare age.
Why does the media persist in comparing apples and oranges using misleading
statistical comparisons?
**How to mislead with statistics
Measuring Learning Outcomes from Getting an Economics Degree ---
https://blog.supplysideliberal.com/post/2019/9/26/measuring-learning-outcomes-from-an-economics-degree
Jensen Comment
Disciplines with licensure examinations (think law, medicine, accountancy,
nursing, pharmacy, engineering, etc.) can look at licensing examination
performance of recent graduates. However, such outcomes can be misleading when
graduates invest in coaching courses after graduation. Coaching courses mixed
with college courses confound the licensing examination outcomes.
There's also possible bias. For example, accountancy masters programs at
flagship universities often have the be best CPA examination passage rates.
However, there are two sources of bias. One is that there is so much demand to
major in accountancy at a flagship university that that university sometimes
puts of barriers to entry along the way such as having to have a 3.5 gpa to
major in accounting or to get into a masters program. The bias here is that we
expect top students to have better licensing examination success even if their
alma maters did a rather poor job preparing them to take the licensing
examinations.
There's also possible bias in that flagship university students are often
preferred by recruiters of the largest multinational CPA firms, and those firms
often invest more in getting their newly-hired employees licensed. The firms may
pay for the best coaching courses and even conduct some of their own coaching
courses. Once again a flagship school may do a lousy job preparing students for
the licensing examination, but the employers of their graduates make up for lost
time.
There can also be sample size issues. For 24 years I taught in the
accountancy program at Trinity University. Our masters of accounting program was
very small (sometimes less than 20 students), and on some CPA exam dates we had
less than ten students taking the exam.. Sometimes our CPA examination
performance average was at or near the top forTexas. Other times is was below
average. The reason is that our licensing exam performance standard deviation
was was much greater due to sample size relative to the large mills like the
University of Texas at Austin and Texas A&M.
Lastly, I might add that the success of a college program lies in more than
examination performance and grades. In higher education we pride ourselves in
making students eager for more learning. Some of the best academic programs
should be judged on the basis of what graduates learned after graduation rather
than what they learned before graduation. Sometimes we have to wait to hear what
post-graduate award winners have to say about why they think they won those
awards.
**How to Mislead With Statistics
"How Well Do Teen Test Scores Predict Adult Income?" by Phillip Cohen,
Sociological Images, May 13, 2014 ---
http://thesocietypages.org/socimages/2014/05/13/how-well-do-teen-test-scores-predict-adult-income/
Jensen Comment
This is a good lesson in regression from sophomores to Ph.D. seminars ---
http://thesocietypages.org/socimages/2014/05/13/how-well-do-teen-test-scores-predict-adult-income/
This is an illustration of the enormity of the problem of missing variables
in regression. Sadly in accountics research missing variables are the rule
rather than the exception.
**How
to mislead with statistics
Harvard Research: When Airbnb Listings in a City Increase, So Do Rent Prices ---
https://hbr.org/2019/04/research-when-airbnb-listings-in-a-city-increase-so-do-rent-prices?utm_medium=email&utm_source=newsletter_daily&utm_campaign=dailyalert_not_activesubs&referral=00563&deliveryName=DM34433
Jensen
Comment
The article itself pretty well points out how this correlation can be misleading
due to missing variables.
How to Mislead With Statistics
Divorce and Higher Education ---
https://marginalrevolution.com/marginalrevolution/2019/07/divorce-and-higher-education.html
Jensen Comment
Note Tyler's comments about there "being more to it than this."
The major problem with this study is missing variables, variables that are
often quite interactive (which creates huge problems in linear regression) and
dependent upon unique circumstances.
**How to Mislead With Statistics (Small Sample, Missing Variables)
When you are dealing with a giant investment conglomerate to reveal all the
details might take over a million pages in an annual repor6t.
The following article is a little like writing about the performance of
superstar LaBron James for this season by focusing on two or three of his games
---
http://en.wikipedia.org/wiki/LeBron_James
Two or three games do not make a season's performance.
What a $250,000 home looks like in 25 major US cities (including a
"modest" home in San Antonio)---
https://www.businessinsider.com/what-250000-home-looks-like-in-25-big-us-cities-2019-5
Jensen Comment
This is a little misleading since housing prices vary so much among alternate
school districts in virtually all USA major cities.
St. Louis has 500+ homes available for a buck each ---
https://www.businessinsider.com/st-louis-cheap-dollar-homes-2019-3
Bernie Sanders: "You’re Damn Right We’re Going to Destroy Private Health
Insurance" ---
Click Here
Reason Magazine's Really Important Concerns about Medicare-for-All"
The Contradiction at the Heart of Bernie Sanders' Medicare for All Plan ---
https://reason.com/2019/04/24/the-contradiction-at-the-heart-of-bernie-sanders-medicare-for-all-plan/
There is a huge
contradiction at the heart of Bernie Sanders' Medicare for All plan.
On the
one hand, Sanders not only wants to expand government-provided coverage to
everyone in the country, he wants that coverage to be significantly more
generous than Medicare, private insurance, or comparable government-run
systems in other countries. On the other hand, he wants to drastically cut
payments to hospitals, many of which lose money on Medicare right now,
making up for the program's relatively low payments by charging much higher
prices to private insurers.
What
Sanders is proposing, in other words, is that the government finance a
significant increase in government services while also radically reducing
the amount it pays for those services. Even making generous assumptions,
it's almost impossible to see how his plan could work.
Let's
start with the promises Sanders makes about Medicare for All. No networks,
premiums, deductibles, or copayments. Under his plan, essentially all
non-cosmetic services would be free at the point of care for everyone.
Sanders calls this
Medicare for All, but what he's describing isn't Medicare as we now know it.
As
The New York Times
noted
earlier this year upon the release of a Sanders-inspired Medicare for All
bill in the House, the new program would "drastically reshape Medicare
itself," changing both what it pays for and how. In many ways, it would be a
completely different program. Medicare for All, in other words, isn't really
Medicare.
And that
program would be far more expansive and expensive than nearly any other
comparable system. It would cover more, and require less direct financial
outlays (not including taxes), than either today's Medicare or typical
private insurance plans in the U.S.
It would also be substantially more generous
than the national health systems set up in other countries. Sanders likes to
unfavorably contrast America's mixed public-private health care system with
foreign systems where the government is more directly involved. When he
announced the 2017 version of his Medicare for All plan, for example, he
bemoaned
the state of affairs in the United States "a time when every other major
country on earth guarantees health care to every man, woman, and child."
Discussions about health care policy on social media often include some
variant of the question, "If every other country with a developed economy
can do it, why can't the United States?"
The problem with this line of questioning is
that what Sanders is proposing
isn't what other
countries do. Canada, for example, has a
single-payer system, but it doesn't cover dental care, vision, drugs, or any
number of other services. A majority of Canadians carry private insurance in
order to cover those services. In Britain, which offers a fully socialized
medical system where health care providers are government employees, many
resident still buy private coverage. Sanders, on the other hand, would
effectively wipe out
private coverage in the space of just four
years.
There are
similar limitations on coverage in other countries, like the Netherlands.
It's also true in Australia, where patients typically pay a percentage of
the cost of specialty services. It's true that in these countries,
government plays a more central role in health care financing. But their
systems have also reckoned with costs and tradeoffs in a way that Sanders,
after so many years, has not.
Indeed,
the main trade-off that Sanders seems willing to discuss is the elimination
of insurance companies, which he portrays as greedy middlemen driving up the
cost of health care. Wiping out the industry in one fell swoop, as Sanders
has proposed, would be a unprecedented and disruptive move that would have
significant economic repercussions, including the probable loss of thousands
of insurance industry jobs. But it still wouldn't do much to bring down the
cost of health care, because so much money in the nation's health care
system is tied up in provider payments, especially hospitals.
And
therein lies the
(first)
contradiction.
Most
people probably think of hospitals as places where you go to get health care
services. Politically and economically, however, they also fulfill another
role: They are hubs for stable middle-class jobs, paying reasonably good
wages to thousands of highly trained workers, most of whom are not doctors
or specialists earning stratospheric salaries.
To
acquire the revenue to pay for all these jobs, hospitals rely on a mix of
private and public payments. Public payments make up a somewhat larger share
of total hospital budgets, but private payers are typically charged much
higher prices.
Hospitals
like to argue that Medicare and Medicaid payments are too low to cover their
costs, and that as a result, higher private payments effectively subsidize
public health coverage. Critics (with some evidence) often respond that
hospitals either overstate or don't really understand their own costs, and
that this is just a ploy to extract more money from government health
programs and private payers.
But when
considering Medicare for All, the particulars of this debate are largely
beside the point, because there is simply no question that eliminating
private insurance and payment for all services would drastically reduce the
amount of revenue for hospitals.
Yet that
is exactly what Sanders wants to do. His plan calls for paying for health
care services at Medicare rates, which means that, practically overnight,
hospitals would end up with far, far less revenue. Exactly how much is
unclear, but one estimate indicated that payments could drop by as much as
40 percent.
That would leave hospitals with a couple of
difficult choices. They could eliminate services. They could try to force
some employees to take pay cuts. They could fire large numbers of workers.
Or they could simply shut down. As a recent
New York Times
report
on how Medicare for All would affect hospitals noted, rural hospitals—many
of which are already struggling to stay afloat—would be particularly at risk
of closing.
Whatever
ended up happening, there is simply no way most hospitals would or could
continue operating as they do now under the payment regime that Sanders
envisions. Lots of middle class jobs would disappear. Services would be
eliminated or cut back.
Yet Sanders not only imagines that hospitals
would continue to operate as they do now, but that they would expand their
services to
even more people, since more people would have coverage. And since he
also imagines a system with no deductibles or copays, those people would
almost certainly end up dramatically increasing utilization of hospital
services.
Studies of health insurance have consistently
shown
that expansions of health insurance result in increased demand for (and use
of) health care services; more people with coverage means more people lining
up to get care. (Relatedly, introducing even very small copays—on the order
of just a few dollars—can reduce the number of visits to doctors and
hospitals.) Greater utilization of health care services does not necessarily
translate into
measurably better
physical health outcomes. But it does
increase the strain on the health care delivery system—which is to say, it
puts a huge amount of pressure on hospitals.
Continued in article
Jensen Comment
Another contradiction is that to pay for Medicare-for-All program Bernie Sanders
wants to tax most of what high-income workers earn, and the highest income
professionals in the USA on average are physicians. There is currently a
shortage of physicians. This shortage will become critical as medical care
becomes virtually free and often overused as a free service by hundreds of
million residents of the USA.
Here's the second contraction
Taxing physician income at 70% or more will discourage students from becoming
physicians and will give existing physicians incentives to retire early or work
at leisurely part-time doctoring. Far better work two days per week and pay a
30% income tax rate than to be a 60--hour week highly stressed, and overworked
physician being taxed at 70% of every extra dollar earned.
Medicare-for-All is a Tragedy of the Commons ---
https://en.wikipedia.org/wiki/Tragedy_of_the_commons
**How to Mislead With Statistics
Highest Paid Professionals in Every State
https://www.businessinsider.com/highest-paying-job-in-every-us-state-2019-2
Note that there are much higher proportions of low income lawyers than doctors
such that medians and means are pulled down for lawyers --- thereby make those
statistics distorted.
"Here's how much money doctors actually make," by Lauren F Friedman,
Business Insider, April 21, 2015 ---
http://www.businessinsider.com/how-much-salary-does-a-doctor-make-2015-4
Jensen Comment
It's hardly surprising that some of the highest-paid
physicians are also those that have the highest malpractice insurance expenses,
e.g., orthopods and gas passers (Anesthesiologists). It's almost impossible to
make meaningful comparisons of after-expense physician income since things like
malpractice insurance, office rental, etc. vary so much with location in cities
and states. For example, malpractice insurance costs in Texas are very low due
to a constitutional amendment that caps punitive damages. This is not the case
in other states where punitive damages can go through the roof.
My guess is that in the above study the incomes of a whole lot of emergency
roomn physicians were net of malpractice insurance expenses paid by hospitals
and clinics versus orthopod incomes before deducting malpractice insurance
premiums.
Incomes of physicians are also hard to compare since so many of them are part
of and sometimes even own medical clinics. My occasional neighbor up here in the
mountains owns a cardiology clinic in Boston. His "income" arises from his own
medical services plus the services of other cardiologists who in his clinic.
It's extremely common for obstetricians (Ob/Gyn) to work for hospitals and
clinics for a number of reasons, malpractice insurance being the biggest reason.
Also obstetricians, like emergency room doctors, often prefer regular hours
rather than being on constant call from their patients or have babies at any
time on any day of the week.
"Canadian Malpractice Insurance Takes Profit Out Of
Coverage," by Jane Akre, Injury Board, July 28, 2009 ---
Click Here
http://www.injuryboard.com/national-news/canadian-malpractice-insurance-takes-profit-out-of-coverage.aspx?googleid=267890
The
St. Petersburg Times takes a look at the cost of
insurance in Canada for health care providers.
A neurosurgeon in Miami pays about $237,000 for medical malpractice
insurance. The same professional in Toronto pays about $29,200, reports
Susan Taylor Martin.
A Canadian orthopedic surgeon pays just over $10,000 for coverage that
costs a Miami physician $140,000. An obstetrician in Canada pays $36,353 for
insurance, while a Tampa Bay obstetrician pays $98,000 for medical
malpractice insurance.
Why the difference?
In the U.S., private for-profit insurance companies extend medical
malpractice coverage to doctors.
In Canada, physicians are covered through
membership in a nonprofit. The
Canadian Medical Protective Association
offers substantially reduced fees for the same coverage, especially
considering that their payout is limited by caps in Canada just as in some
U.S. states.
In 1978, the Canadian Supreme Court limited pain
and suffering awards to just over $300,000, circumventing the opportunity
for a jury to decide on an award depending on the case before them.
Canadian Medical Protective Association
Here’s how it works.
Fees for membership vary depending on the region of the country in which
the doctor works and their specialty. All neurosurgeons in Ontario will pay
the same, for example. The number of claims they have faced for medical
malpractice does not figure into their premium
"We don't adjust our fees based on individual
experience; it's the experience of the group,'' says Dr. John Gray, the
executive director, "That's what the mutual approach is all about, and it
helps keep the fees down for everyone,” he tells the
St. Petersburg Times.
If a doctor is sued, the group pays the claim and
provides legal counsel.
In the U.S., the push has been on for limiting claims, no matter how
egregious the medical malpractice. President Obama was booed in June when,
before the American Medical Association, he said he would not limit a
malpractice jury award.
"We got a crazy situation where Obama is talking
about the cost of medicine but he said, 'I don't believe in caps,' "
complains Dr. Dennis Agliano, past president of the
Florida Medical
Association. "If you don't have caps, the sky's
the limit and there's no way to curtail those costs.''
But the importance of limiting jury awards may not play into the big
picture on health care reform.
Malpractice lawsuits amount to
less than one percent of both the Canadian and the
U.S. healthcare system, meanwhile between 44,000 and 98,000 Americans die
each year due to medical errors in hospitals alone, while 16 times as many
suffer injuries without receiving any compensation, reports the group
Americans for Insurance Reform.
Major Difference
In Canada, an injured patient is often required to pay for the initial
investigation into his case. In the U.S. the contingency fee basis, usually
in the range of 30 percent, allows the injured party to proceed without a
financial downside.
In both the U.S. and Canada, the definition of medical negligence is that
a duty of care was owed to the patient by the physician, there was a breach
h of the standard of care and the patient suffered harm by the physician’s
failure to meet that standard of care.
A bad outcome in itself is not the basis of a lawsuit.
The Canadian Medical Protective Association insures virtually all of the
country’s 76,000 doctors, as opposed to the U.S. where private for-profit
insurance companies cover physicians for medical malpractice.
In Canada, the median damaged paid in 2007 was $91,999 and judgments
favored patients 25 times, doctors 70 times.
In the U.S., many physician groups are requiring
patients to waive their rights to a jury trial, even though malpractice
litigation accounts for just 0.6 percent of healthcare costs.
Public Citizen,
the consumer group, charges that the facts don’t
warrant the “politically charged hysteria surrounding medical malpractice
litigation.”
For the third straight year,
medical malpractice payments were at record lows
finds the group in a study released this month. The decline, however, is
likely due to fewer injured patients receiving compensation, not improved
health safety.
2008 saw the lowest number of medical malpractice
payments since the federal government’s
National
Practitioner Data Bank began compiling malpractice
statistics. In 2008, payments were 30.7 percent lower than averages recorded
in all previous years.
In the report titled,
The 0.6 Percent Bogeyman, the nonprofit watchdog
group states, “between three and seven Americans die from medical errors for
every 1 who receives a payment for any type of malpractice claim.”
Public Citizen previously reported that about
five percent of doctors are responsible for half
of the medical malpractice in the U.S. that can result in permanent injury
or death. #
Read more:
http://www.injuryboard.com/national-news/canadian-malpractice-insurance-takes-profit-out-of-coverage.aspx?googleid=267890#ixzz0W0Z71JOP
**How to Mislead With Statistics
Timing is Everything: Evidence from College Major Decisions ---
http://www.econweb.umd.edu/~pope/westpointtiming.pdf
Jensen Comment
Based on my own anecdotal experience across 40 years of being on the faculty of
four universities I'm suspicious about the conclusions of this study on
causality.
Personally, I think that student choices of major in many, certainly not all,
instances is primarily impacted by parents and/or other relatives for very close
family friends. This is not necessarily the case at the start of the first
semester in college where students still tend to leave their options only. But I
think deep in the backs of their minds the wishes of parents and family friends
come to surface.
I admit to being wrong in many instances and this article often rings true.
Our minister has ten very loving and tightly-knit children. What emerged is a
loved leader among the children named Lauren. She graduated from high school
(all were home schooled) and entered nursing school. She's now a popular cardiac
nurse in the Eastern Main Medical Center in Bangor. Lauren influenced her
younger brother Landon's decision to attend the same nursing school. I'm sure he
was partly influenced by all the job opportunities that opened up to his older
sister. But along the way in college Landon was greatly influenced by a required
course in psychology. Landon changed majors and is now a psychology major bent
on becoming a clinical psychologist. Job opportunities are much more limited
(competitively) as a new graduate in psychology. Go figure!
The accounting profession was greatly worried as virtually all the 50 states
commenced requiring 150 credits to sit for the CPA examination, which for most
aspiring CPAs is tantamount to requiring a masters degree. What would this alone
do to the number of undergraduate accounting majors? We'll never know. The
reason is that at the same time CPA firms and business firms offset this new
academic requirement with greatly expanded undergraduate internship programs. It
turns out in accounting and other academic majors it really helps to have
internships available to most students in a discipline and, get this,
internships that lead to job offers before students even enter their masters
programs (with the job offers being contingent upon getting the masters
degrees).
My point student decisions regarding majors are
probably too variable, complicated, and serendipitous to neatly summarize.
Certainly ranking key factors is extremely misleading.
There are too many interacting variables.
**How to Mislead With Statistics
"I'll Bet Robert Shiller $5,000 That He's Wrong About This Chart," by
Mike "Mish" Shedloc, Business Insider, April 10, 2014 ---
http://globaleconomicanalysis.blogspot.com/2014/04/shiller-drinks-kool-aid.html#ixzz2yTm72lT3
. . .
Supposedly the current reading of 42 is all you
need to know to understand a recession isn't in the cards for "years to
come".
Note that in the mid-1940s a recession started with
weekly hours over 45, something Shiller conveniently chopped off in his
chart.
OK let's toss that out as a war ending event.
Is there anything sacrosanct about 42 vs. 41 where
many recessions started? I suggest no. And what about manufacturing
employment vs. hours worked?
Good question. Here's the chart.
. . .
Two Questions
- Is there anything about manufacturing
employment that remotely suggests no recession for years to come?
- Is there anything about manufacturing
employment that indicates hours worked in manufacturing has the
importance it may have had decades ago?
Reality
There is no single chart that is a sure fire
indicator of anything. An inverted yield curve is probably the closest bet,
but given QE and blatant Fed manipulation of interest rates, it's highly
likely the next recession starts with a positive curve.
Even if hours worked has high importance (and it
doesn't) there is absolutely nothing to suggest where manufacturing hours
will be six months from now!
Shiller should know better than to make such
statements.
I propose a $5,000 bet with Robert Shiller right
now, donated to our favorite charity that he is wrong.
**How to Mislead With Statistics
"Guess Who Doesn’t Care That You Went to Harvard?" by Gretchen Gavett,
Harvard Business Review Blog, February 28, 2014 ---
http://blogs.hbr.org/2014/02/guess-who-doesnt-care-that-you-went-to-harvard/
Jensen Comment
I think this is a misleading article. Business firms may not care whether or not
that you graduated as an undergraduate from Harvard but they a often are deeply
impressed by the fact that you got into Harvard, Yale, MIT, Princeton,
Dartmouth, etc. Also those business firms and graduate schools know that the
highest GRE and GMAT scores are highly correlated with the highest SAT scores
that got students into the Ivy League schools in the first place. Also grade
inflation is virtually highest in the Ivy League among colleges and universities
in higher education (except maybe at Princeton which is making a limited effort
to bring down grades). Naive recruiters might be impressed by high grades from
Harvard without knowing that 80% of the graduates from Harvard graduate cum
laude.
Business firms will more actively recruit undergraduates from Cornell and the
flagship state university business schools because most of the Ivy League
universities like Harvard do not have undergraduate business schools. But this
does not apply to MBA graduates from Ivy League schools that have prestigious
MBA programs.
Gretchen Gavett fails to mention a leading recruiting edge of graduate
business and law programs at Harvard, Yale, MIT, and Dartmouth --- those
fantastically important Ivy League alumni networks. For example, business
executives that greatly adore their alma mater's green blazers actively seek to
hire recent Tuck School graduates from Dartmouth's Tuck Graduate School of
Business. Green-blazed graduates have an edge with successful Tuck alumni
recruiters!
MBA programs at Ivy League schools do not do well when firms are hiring for
certain types of specialties. For example, most Ivy League MBA programs do not
have curricula for passing the CPA examination. Firms do not generally recruit
new auditors and tax accountants and AIS specialists at the Ivy League
universities. Gretchen Gavett is correct in this regard!
**How to Mislead With Statistics
From the 24/7 Wall Street Newsletter on February 17, 2014
Although a little late this year, due largely to
the federal government’s 17-day shutdown in 2013, tax season is here. And,
according to a new report, what you owe in taxes could be largely determined
by where you live. The report, released by the Office of Revenue Analysis of
the government of the District of Columbia, reviewed the estimated property,
sales, auto and income taxes for a hypothetical family at various income
levels in 2012 in the largest city within each state. City tax burdens vary
widely. A family of three earning $75,000 in Cheyenne, Wyoming, paid just
$3,475, or 4.6% of its income, in state and local taxes. In Bridgeport,
Connecticut, a family of three earning $75,000 paid $16,333, or 21.8% of its
income -- a total that does not even include federal taxes.
These are the cities with the highest (and lowest) taxes ---
http://247wallst.com/special-report/2014/02/14/cities-paying-the-most-and-least-in-taxes/?utm_source=247WallStDailyNewsletter&utm_medium=email&utm_content=FEB172014A&utm_campaign=DailyNewsletter
We have tracked the composition of, and major
changes to, the Berkshire Hathaway portfolio.
Meet the 2014 Warren Buffett stocks.
Jensen Comment
Be careful of how tax burdens are computed in this analysis. For example the
parameters are based heavily on $25,000 versus $150,000 family income
parameters. Trying to live on $150,000 in Manhattan is like trying to live on a
poverty wage. Those families well above the $150,000 parameter such as those in
Manhattan earning well above the median get clobbered with much higher city
taxes than those above the median in Bridgeport, Connecticut because high
incomes in Manhattan are so much higher for multimillionaires living in
Manhattan as opposed to Bridgeport.
Medians and means can be very misleading when the data are extremely bimodal
such as having a lot of lower income people combined with a lot of extremely
high income people paying city income taxes and property taxes. In
Manhattan the two modes are so extreme that the median family income number is
virtual nonsense. High income people that choose to live in Manhattan in very
expensive housing pay a very dear price in terms of taxes imposed by the city on
top of the income taxes of the state and federal governments. This is one of
the main reasons high income people working in Manhattan elect to live outside
Manhattan --- often in villages towns that do not impose income taxes on
top of state and federal income taxes.
In other words, Manhattan looks like a good tax deal only because the
parameter of $150,000 is so low for Manhattan.
Living on $150,000 in Manhattan would be relatively lousy living in small,
dingy, and possibly rat-infested brownstone apartment where children are warned
not to venture out at night. If this study was revised by replacing the $150,000
parameter with a $500,000 parameter that is reasonable for Manhattan, San
Francisco, and Honolulu the rankings towns and city tax burdens would be totally
different. Goodbye Bridgetown and hello Manhattan, San Francisco, and Honolulu.
This is just one of those many ways that "figures
don't lie but liars figure."
**How to Mislead With Statistics
Excerpts taken from the article: “A Famous Study Found That Blind
Auditions Reduced Sexism in the Orchestra. Or Did It?” ---
https://replicationnetwork.com/2019/10/25/in-the-news-reason-october-22-2019/
**How to Mislead With Statistics
As Two-Parent families Decline, Income and Wealth Inequality
For example, married parents in a $200,000 home and income now have to live as
single parents in two much lower quality homes on lower incomes
"For richer, for poorer: How family structures economic success in America,"
by W. Bradford Wilcox and Robert I. Lerman, American Enterprise Institute,
October 28, 2014 ---
http://www.aei.org/publication/for-richer-for-poorer-how-family-structures-economic-success-in-america/
Executive Summary
The standard portrayals of economic life for
ordinary Americans and their families paint a picture of stagnancy, even
decline, amidst rising income inequality or joblessness. But rarely does the
public conversation about the changing economic fortunes of Americans and
their families look at questions of family structure. This is an important
oversight because, as this report shows, changes in family formation and
stability are central to the changing economic landscape of American
families, to the declining economic status of men, and to worries about the
health of the American dream.
Continued in article
**How to Mislead With Statistics
Paul Krugman Rejected by His Peers ---
Click Here
http://townhall.com/columnists/johncgoodman/2015/01/17/paul-krugman-rejected-by-his-peers-n1944174?utm_source=thdaily&utm_medium=email&utm_campaign=nl&newsletterad=
Questionable Integrity of Paul Krugman: How to Mislead With Statistics
"Paul Krugman's Interesting Semantic And Statistical Dodge On Tax Rates,"
by Tim Worstall, Forbes, September 26, 2014 ---
http://www.forbes.com/sites/timworstall/2014/09/26/paul-krugmans-interesting-semantic-and-statistical-dodge-on-tax-rates/
Nobel Laureate economist and political activist Paul Krugman is sometimes
known to cherry pick data or even invent data in order to make a political point
---
Paul Krugman ---
http://en.wikipedia.org/wiki/Paul_Krugman
. . .
Krugman's columns have drawn criticism as well as
praise. A 2003 article in The Economist[ questioned Krugman's
"growing tendency to attribute all the world's ills to George Bush," citing
critics who felt that "his relentless partisanship is getting in the way of
his argument" and claiming errors of economic and political reasoning in his
columns. Daniel Okrent, a former The New York Times ombudsman, in his
farewell column, criticized Krugman for what he said was "the disturbing
habit of shaping, slicing and selectively citing numbers in a fashion that
pleases his acolytes but leaves him open to substantive assault.
"The Missing Data in Krugman’s German Austerity Narrative" Daniel J.
Mitchell, Townhall, February 25, 2014 ---
http://finance.townhall.com/columnists/danieljmitchell/2014/02/25/the-missing-data-in-krugmans-german-austerity-narrative-n1800047?utm_source=thdaily&utm_medium=email&utm_campaign=nl
There’s an ongoing debate about
Keynesian economics, stimulus spending, and
various
versions of fiscal austerity,
and regular readers know I do everything possible to explain that you can
promote added prosperity by reducing the
burden of government spending.
. . .
But here’s the problem with his article. We know
from the (misleading) examples above
(not quoted here) that he’s complained about supposed
austerity in places such as the United Kingdom and France, so one would
think that the German government must have been more profligate with the
public purse.
After all, Krugman wrote they haven’t “imposed a
lot of [austerity] on themselves.”
So I followed the advice in Krugman’s “public
service announcement.” I didn’t just repeat what people have said. I dug
into
the data to see what
happened to government spending in various nations.
And I know you’ll be shocked to see that Krugman
was wrong. The Germans have been more frugal (at least in the sense of
increasing spending at the slowest rate) than nations that supposedly are
guilty of “spending cuts.”
"About Those Income Inequality Statistics An answer to Paul Krugman,"
by Bret Stephens, The Wall Street Journal, January 3, 2014 ---
http://online.wsj.com/news/articles/SB10001424052702304325004579298502492870522?mod=djemEditorialPage_h
Let me do something
New York Times
NYT -0.13% columnist
Paul Krugman isn't exactly famous for doing, at
least not graciously: acknowledge a mistake.
In my Dec. 31 column on income inequality, I used a
data set from the U.S. Census Bureau to make the case that incomes in the
U.S. have been growing across the board, even if the incomes of the wealthy
have grown faster than those of others further down the income scale. But I
wrote those lines looking at a set of numbers that had not been adjusted for
inflation.
Professor Krugman, in a post on his New York Times
blog, takes me to task for this. Had I done so looking at the
inflation-adjusted table, it would have shown the incomes of the bottom 20%
essentially stagnating since 1979 (and long before then, too), though it
also would have shown incomes for the top 20% rising far less dramatically.
That was an error, roughly of the kind the Nobel
Laureate economist made last August when he confused an x for a
1/x. As is his charming wont, Mr. Krugman accuses me not of making an
honest mistake, but of "pulling a fast one."
My mistake is all the more unfortunate because
the basic point I was making is right: Americans are getting richer across
the entire income spectrum, even if they are getting richer at very
different rates. That much is confirmed by data from the Congressional
Budget Office. The CBO finds that between 1979 and 2007 income for poor
households grew by 18%, for the middle classes by nearly 40%, and for the
top 81-99% by 65%. It's the top 1% who have made out very handsomely, with a
jump of 275% over nearly three decades.
The difference between the Census Bureau and CBO
data comes down to the complicated (and ultimately subjective) way in which
"income" is defined. The Census Bureau data relies on a definition of income
that is pre-tax but post-transfer cash income. But it also excludes the
non-cash benefits that go to many of the poor, such as food stamps,
Medicaid, CHIP (children's Medicaid) and housing subsidies. (and now
more free or subsidized medical care and medications)
By contrast, the CBO numbers measure after-tax,
after-transfer income. It also includes non-cash transfers. Those benefits
may not be fungible, but they do have value. And they vindicate my core
point: "The richer have outpaced the poorer in growing their incomes, just
as runners will outpace joggers who will, in turn, outpace walkers." What
mattered, I said, was that "the walking man walks."
My column also noted that President Obama erred
when he said the top 10% take half of aggregate income; in fact, it's the
top 20% who take half the income, according to Census Bureau data. Mr.
Krugman takes issue with this, too, saying the Census Bureau figures are
pretty much worthless when it comes to quantifying the aggregate incomes of
the very rich. Much better, he says, is data from a controversial study by
two left-wing French economists, Emmanuel Saez and Thomas Piketty, which is
in line with President Obama's contention.
Talk about a fast one. As Greg Mankiw, chairman of
the Harvard Economics department, notes, Saez-Piketty has its own set of
very large problems: "The data are on tax units rather than households, they
do not include many government transfer payments, they are pre-tax rather
than post-tax, they do not adjust for changes in household size, and they do
not include nontaxable compensation such as employer-provided health
insurance."
Ultimately, debates about income inequality are
never going to be settled because both "income" and "inequality" are very
hard to measure. Is the best measure of inequality wage inequality,
income inequality, or consumption inequality? If a poor family today can now
afford a car, an air conditioner, a computer and other goods unaffordable or
unavailable to the poor of 35 years ago, can they really be said to have
stagnated economically? How do changes in the tax code affect the ways in
which income can be reported, sheltered and measured? What is the true money
value of health insurance?
And so on and on. The argument I made in my column
is that inequality should only matter to Americans if, Russia-like, the rich
are getting richer at the expense of the poor.
Neither the Census Bureau nor the CBO figures show
that.
None of this is to excuse the fact that I goofed in
my use of data. My apologies. As for Mr. Krugman, he should bear in mind
something the public editor of the New York Times once said about him: "Paul
Krugman has the disturbing habit of shaping, slicing and selectively citing
numbers in a fashion to please his acolytes but leaves him open to
substantive assaults."
"Is Paul Krugman Leaving Princeton In Quiet Disgrace?" by Ralph Benki,
Forbes, July 14, 2014 ---
http://www.forbes.com/sites/ralphbenko/2014/07/14/is-paul-krugman-leaving-princeton-in-quiet-disgrace/
Professor Paul Krugman is
leaving Princeton. Is he leaving in disgrace?
Not long, as these things go, before his departure
was announced Krugman thoroughly was indicted and publicly eviscerated for
intellectual dishonesty by Harvard’s Niall Ferguson in a hard-hitting
three-part series in the Huffington Post, beginning
here, and with a coda in
Project Syndicate, all
summarized at Forbes.com. Ferguson, on
Krugman:
Where I come from … we do not fear bullies. We
despise them. And we do so because we understand that what motivates
their bullying is a deep sense of insecurity. Unfortunately for Krugtron
the Invincible, his ultimate nightmare has just become a reality. By
applying the methods of the historian – by quoting and contextualizing
his own published words – I believe I have now made him what he richly
deserves to be: a figure of fun, whose predictions (and proscriptions)
no one should ever again take seriously.
Princeton, according to
Bloomberg News, acknowledged Krugman’s
departure with an extraordinarily tepid comment by a spokesperson. “He’s
been a valued member of our faculty and we appreciate his 14 years at
Princeton.”
Shortly after Krugman’s departure was announced
no less than the revered Paul Volcker, himself a Princeton alum, made a
comment — subject unnamed — sounding as if directed at Prof. Krugman. It
sounded like “Don’t let the saloon doors hit you on the way out. Bub.”
To the
Daily Princetonian (later reprised by the
Wall Street Journal, Volcker
stated with refreshing bluntness:
The responsibility of any central bank is price
stability. … They ought to make sure that they are making policies that
are convincing to the public and to the markets that they’re not going
to tolerate inflation.
This was followed by a show-stopping statement:
“This kind of stuff that you’re being taught at Princeton disturbs me.”
Taught at Princeton by … whom?
Paul Krugman, perhaps? Krugman, last year, wrote
an op-ed for the New York Times entitled Not
Enough Inflation. It betrayed an
extremely louche, at best, attitude toward inflation’s insidious
dangers. Smoking gun?
Volcker’s comment, in full context:
The responsibility of the government is to have
a stable currency. This kind of stuff that you’re being taught at
Princeton disturbs me. Your teachers must be telling you that if you’ve
got expected inflation, then everybody adjusts and then it’s OK. Is that
what they’re telling you? Where did the question come from?
Is Krugman leaving in disgrace? Krugman really
is a disgrace … both to Princeton and to the principle of monetary
integrity. Eighteenth century Princeton (then called the College of New
Jersey) president John Witherspoon, wrote, in his
Essay on Money:
Let us next consider the evil that is done by
paper. This is what I would particularly request the reader to pay
attention to, as it was what this essay was chiefly intended to show,
and what the public seems but little aware of. The evil is this: All
paper introduced into circulation, and obtaining credit as gold and
silver, adds to the quantity of the medium, and thereby, as has been
shown above, increases the price of industry and its fruits.
“Increases the price of industry and its fruits?”
That’s what today is called “inflation.”
Inflation is a bad thing. Period. Most of all it
cheats working people and those on fixed incomes who Krugman pretends to
champion. Volcker comes down squarely, with Witherspoon, on the side of
monetary integrity. Krugman, cloaked in undignified sanctimony, comes down,
again and again, on the side of … monetary finagling.
Krugman consistently misrepresents his
opponents’ positions, constructs fictive
straw men, addresses marginal figures, and
ignores inconvenient truths set forward by figures of probity such as the
Bank of England and the
Bundesbank,
thoughtful work such as that by Member of
Parliament (with a Cambridge Ph.D. in economic history) Kwasi Kwarteng, and,
right here at home, respected thought leaders such as
Steve Forbes and
Lewis E. Lehrman (with whose
Institute this
writer has a professional affiliation).
Continued in article
Bob Jensen's threads on professors who cheat ---
http://www.trinity.edu/rjensen/Plagiarism.htm#ProfessorsWhoPlagiarize
**How to Mislead With Statistics
Here's how much money doctors across the US make ---
https://www.businessinsider.com/how-much-money-do-doctors-make-gender-pay-gap-doximity-study-2019-3
Jensen Comment
This article is a great example of how statistical reports can be misleading if
they only focus on mean averages without added information about standard
deviations and skewness and missing variables. For example, consider
neurosurgery. My wife's spine surgeon in Boston is what he calls a "big-back"
surgeon. He performs spinal surgeries that 95+% of the back surgeons in the USA
refuse to perform. He actually broke Erika's spine into three pieces and then
attached four rods from her hips to her neck. Afterwards, however, she can still
pick up a tissue off of the floor when bending her spine. Needless to say his
rates, sometimes exceeding tens of thousands of dollars per surgery, are greater
than the rates of "little-back" surgeons who also work out his office. By the
way, he's not on the faculty of the Harvard Medical School. However, every time
I've spoken with him he was followed by two or three Harvard Medical School
neurosurgery residency physicians who were what I called his "puppies."
By the way, it might be interesting to study details of his malpractice
insurance premiums and lawsuits. He's amazing because he has the guts to be a
"last-chance" neurosurgeon in spite of the circling lawyers. By last chance I
mean when patients can no longer find a neurosurgeon who will operate on their
spines he's their "last chance." Erika had over a dozen spine surgeries before
she at last found this "big-back" surgeon in Boston.
There are also many other troubles with the above article. For example,
malpractice insurance is very high priced in the USA relative to all other
nations. And malpractice insurance costs vary greatly with specialties such as
being very high for obstetrics (lawyers sue for every bad baby) versus
neurosurgery versus psychiatry versus primary care physicians.
Let's consider an example. According to the study the average pay for a
neurosurgeon is $617,000. But that does not account for differences in whether
that salary is net of malpractice insurance premiums. Such netting out is
complicated because many neurosurgeons make this much or much more without
having to pay malpractice insurance premiums. My wife's spine surgeon who
installed her morphine pump is an employee of the Dartmouth Hitchcock
Medical Center that pays malpractice insurance for virtually all employees and
medical school faculty. However, many neurosurgeons who operate in that same
medical center are not employees and must pay their own malpractice insurance.
Similarly, there's a nearby Veterans Hospital where VA neurosurgeons do not have
to pay their own malpractice insurance. But if the VA has to outsource a
particular type of surgery that surgeon's bill to the VA will include
malpractice insurance.
Incomes of many specialists vary when they must pay for their own staff
versus have no expenses for staff. For example, the Dartmouth Hitchcock Medical
Center pays for all staff such as receptionists, nurses, technicians,
accountants, etc. It even pays for lawyers when needed. The
private-practice physicians who may also perform surgeries at this medical
center must pay for their own office space and staff. How do you compare a
salaried employee of that medical center with the profits of a private-practice
physician?
I might point out a political problem related to all of this. There's an old
saying: "Show me a bad doctor, and I'll show you a rich professional." The
point is that even at the lowest end of the income distribution medical doctors
in the USA are well paid.
The Democratic candidates for the 2020 presidential nomination have created a
paradox.
Most, not all, students are drawn to medical school in anticipation of
relatively high after-tax incomes. The
politicians advocating Medicare-for-All want to fund this $30+ trillion cost
with greatly increased taxes (think 70% of a physician's income). At the same
time more than twice as many physicians will be needed to staff
Medicare-for-All. Eventually, the progressives will also legislate free medical
school education. But how many students will flock to medical schools even if
they are free? My guess is very few if you are gong to tax away 70% of their
income when they at long last begin to practice medicine.
The problem with becoming a physician is not just the cost of
medical school. The problem is the ordeal --- those years of education and
training needed to become masters of their crafts. The time needed varies with
specialties, but you don't become a neurosurgeon without years of ordeal in
training before you can bill your first paying patient. And there's a lot of
blood, sweat, and tears in those training years. Even worse is that there's a
lot of weekly tension and risk of burn out in the years of practice that follow.
Tell that to the advocates of Medicare-for-All combined with soaring taxes.!
If you want to double the number of physicians in the USA you not only have
to make medical school free; You have to let them be the highest paid
professionals on average after taxes.
PS
You can read more about Erika's ordeal with pain and surgeries at
http://www.cs.trinity.edu/rjensen/Tidbits/ErikaBob/ErikaPain/Set01/Set01.htm
I might add that the electronic pain stimulator installed eventually proved to
be worthless. The same surgeon who installed it removed it and replaced it with
a morphine pump. The pump is no magic bullet, but its more effective than the
electronic wiring up and down her spine
Canadian doctors still make dramatically less than U.S. (and UK and
German) counterparts: study ---
https://nationalpost.com/news/canada/canadian-doctors-still-make-dramatically-less-than-u-s-counterparts-study
Canadian doctors make less than the OECD average, although they do not pay
nearly as much as USA physicians for malpractice insurance, office space, and
labor assistants like office nurses ---
https://en.wikipedia.org/wiki/Physicians_in_Canada
. . .
Canada
should not ignore the wage gap, as a sudden shortage of certain specialists
in the States could trigger a drain from here, said Dr. John Haggie,
president of the Canadian Medical Association. Canada saw a net loss of
doctors to the U.S. in the 1990s, as provinces instituted doctor pay caps
and tried to rein-in fee increases as a way to corral health costs.
But
Dr. Haggie voiced no particular envy Tuesday at the statistics just
published in the journal
Health Affairs
Jensen Comment
I read where there are 72,000 physicians employed in the Canadian health system.
The population of Canada is 37+ million spread over nearly 4 million square
miles.
In the USA
Patients experience long waits (months) for doctor appointments largely due to
the shortage of Canadian physicians. Delays for elective procedures such as knee
and hip replacements are so long that many Canadians use their own savings to
get such surgeries performed in the USA.
In the USA there are over 950,000 physicians who, on average, are the
highest paid professionals in the USA..
https://en.wikipedia.org/wiki/Physicians_in_the_United_States#Demographics
Also see
https://247wallst.com/special-report/2017/03/08/states-with-the-highest-and-lowest-paid-doctors/
The population of the USA is nearly 10 times that if Canada if you include the
undocumented immigrants. USA residents are spread over roughly the same number
of square miles as Canada, although the distribution is not as skewed as that of
Canada is skewed toward the south.
Bernie Sanders: "You’re Damn Right We’re Going to Destroy Private Health
Insurance" ---
Click Here
**How to Mislead With Statistics --- On-Time versus Delayed Flight Arrivals
"So like Delta plane --- arrives early but no gate available but they show
their flight stats as on-time. What a joke they get worse by the year" ---
https://twitter.com/hashtag/delta?src=hash
Jensen Comment
A lot depends upon how long you have to wait. I can recall waiting more than a
half hour for gates after arrival. Sometimes it's not the fault of the airline.
One time I landed in La Guardia when the Captain announced that the plane could
not taxi to the terminal due to high gusts of wind. Passengers sang "Rock a- bye
Baby."
But the main problem with airline delays in general is there is less time
slack in the system than in the good old days when I used to fly a lot. One
plane arriving or departing late might may, in succession, delay others using
that gate. Departing flights that are delayed may eventually report "delayed
arrival" at their destinations. Arriving flights report "on-time arrivals" if
the wheels touched down "on time" before being delayed getting into an arrival
gate.
Interestingly, when meeting a connecting flight I found that it was more
frustrating to be delayed 30 minutes in a arrival plane on the ground than being
delayed 30 minutes before boarding the plane taking me to a connecting flight.
I guess it was because I always thought the pilot would fly faster if the
plane took off late.
In reality, pilots don't seem to make up much of the delay time. Except one
time I was late taking off in San Antonio to make a connecting flight at DFW on
American Airlines. The pilot, a woman, on that flight kept the flight low
(11,000 feet) and very fast. A flight that normally took 55 minutes took 44
minutes that day. American Airlines also expedited our arrival so that I made my
connecting flight with three minutes to spare.
**How to Mislead With Governmental Accounting
"How Much Do We Really Owe?," by John Goodman, Forbes, August 7,
2014 ---
http://www.forbes.com/sites/johngoodman/2014/08/07/how-much-do-we-really-owe/
First the good news: the official federal deficit
is only 3% of GDP – way below the 10% figure it reached only a few years
ago. Now the bad news: The real deficit is more than ten times that amount.
The U.S. government’s deficit is expected to be
$514 billion this year, according to the
Congressional
Budget Office (CBO). That’s the number you get
when you look at cash flow. It means the government will spend $514 billion
more than it takes in during the 2014 fiscal year.
But this kind of accounting ignores federal
government liabilities that will become due in future years. For example,
over the course of a year millions of people earn Social Security and
Medicare benefits as well as other government entitlement benefits that will
have to be paid in future years. When you total all that up (and subtract
expected future revenues to pay those benefits), we added $5 trillion in
debt last year according to Boston University economist
Larry Kotlikoff.
Another way to look at the problem is to consider
not just one year’s deficit, but the total amount of debt that government
has accumulated. US debt held by the public is currently $12.6 trillion, or
about 75% of the size of our economy the way the CBO measures things. But in
arriving at that number, the CBO doesn’t recognize promises to pay Social
Security checks and medical bills as real obligations.
Take a senior citizen who is expecting an interest
payment on a government bond next month and who is also expecting a Social
Security check. The way the CBO looks at the world, the interest payment on
the bond is a real obligation of the government. But the Social Security
check isn’t.
That’s a strange way of accounting and Kotlikoff
and his colleagues reject it. Instead they project the value of all the
promises we have made under Social Security and other entitlement programs –
benefits that ordinary citizens believe they have earned – and subtract
expected future revenues, given the current tax law. The difference is an
unfunded liability that is every bit as real as promises to make future
interest payments on bonds and Treasury bills.
Calculating obligations in this way, Kotlikoff
estimates that the total unfunded liability of the federal government is
$210 trillion, or about 12 times the size of our economy. Writing in The New
York Times, Kotlikoff says:
“The fiscal gap — the difference between our
government’s projected financial obligations and the present value of all
projected future tax and other receipts — is, effectively, our nation’s
credit card bill. Eliminating it, would require an immediate, permanent 59
percent increase in federal tax revenue. An immediate, permanent 38 percent
cut in federal spending would also suffice. The longer we wait, the worse
the pain. If, for example, we do nothing for 20 years, the requisite federal
tax increase would be 70 percent, or the requisite spending cut, 43
percent.”
And the tax increase, by the way, doesn’t work
unless the money is sequestered and invested. It can’t just be deposited in
the Treasury’s bank account and spent on other things.
Bob Jensen's threads on the USA's entitlements disaster ---
http://www.trinity.edu/rjensen/Entitlements.htm
Bob Jensen's threads on the sad state of governmental accounting ---
http://www.trinity.edu/rjensen/Theory02.htm#GovernmentalAccounting
**How to Mislead With Statistics
"Don't Rely On Salary Data To Pick A Programming Language (career): To
Learn Current demand says nothing about earnings potential," by Matt Asay,
ReadWriteWeb, November 28, 2014 ---
http://readwrite.com/2014/11/28/programming-language-salary-data-dont-mix
Jensen Comment
This is good advice in general, not just good advice for programmers. I always
advised my graduating accounting students not to be mislead by higher starting
salaries. I told them to instead look at prospects for training, experience, and
exposure to great clients, clients that will often hire them into terrific jobs
after they have on-the-job skills.
As a matter of fact higher salaries can be very misleading if you ignore
living costs.
For example, CPA firms will often pay more to graduates who will locate in San
Francisco, Manhattan, Honolulu, etc. But the cost of living in those cities
overwhelms the higher compensation. A lower salary in Des Moines or San Antonio
end up being more in terms of compensation net of living costs. But even even
then compensation should not be the deciding factor. Look at other things vital
to career and happiness in life.
Also don't look at happiness in life to make short term decisions. I very
nearly took my first teaching job in Gunnison, Colorado because I wanted to ski
and raise horses. At the time this would have been a dead end choice that
entailed heaving teaching loads and no research support. Plus as a hot dog skier
I would probably be long dead by now.
PS
I still have a friend in Houston who makes a good living programming in COBOL.
"These Are The Highest Paying Programming Languages You Should Learn,
Ranked By Salary," by Lisa Eadicicco, Business Insider, November 20,
2014 ---
http://www.businessinsider.com/best-tech-skills-resume-ranked-salary-2014-11
. . .
Based on that data, here are programming languages
listed next to their average annual salary from lowest to highest:
12. PERL - $82,513
11. SQL - $85,511
10. Visual Basic - $85,962
9. C# - $89,074
8. R- $90,055
7. C - 90,134
6. JavaScript - $91,461
5. C++ - $93,502
4. JAVA - $94,908
3. Python - $100,717
2. Objective C - $108,225
1. Ruby on Rails - $109,460
While some of these coding languages can help you
earn around $100,000, train to become a Salesforce Architect if you want one
of the highest paying jobs in tech. According to
data from IT recruiting firm Mondo that was published back in March,
Salesforce Architects can earn anywhere between $180,000 and $200,000.
Bob Jensen's threads on careers ---
http://www.trinity.edu/rjensen/Bookbob1.htm#careers
**How to Mislead with Statistics
(missing variables, distortion, bias)
Guns Kill More U.S. Children Than Cancer
https://qz.com/1505227/guns-kill-more-more-us-children-per-year-than-cancer/
Jensen Comment
The headline and the bar chart are more misleading than the article itself that
provides added detail that some of those deaths by guns would've likely been
deaths by other means had guns not been available:
. . .
The researchers used data from a US Centers for
Disease Control database that compiles death certificates throughout the US;
2016 is the most recent year for which complete data is available. Of the
3,143 US childhood gun deaths that year, 1,865, or about 60%, were
homicides. Another 35% (1,102 deaths) were suicides, and 4% (126 deaths)
were unintentional shootings. The circumstances surrounding the remaining 1%
(50 deaths) were too unclear to be categorized in this way.
“Children in America are dying or being killed at
rates that are shameful,” Edward W. Campion, the executive editor of the New
England Journal of Medicine and a physician, wrote in an editorial that was
published the same day as the study. “The sad fact is that a child or
adolescent in the United States is 57% more likely to die by the age of 19
years than those in other wealthy nations. America’s children and
adolescents are at far higher risk for death than are youth in other
developed countries such as England, Sweden, and Australia.”
Continued in article
For example, of the 3,143 deaths by guns over a third were suicides. Chances
are that most of those children bent on committing suicide would've found other
means to die such as overdosing, jumping off balconies or crashing vehicles.
And how do we know that quite a few of the deaths attributed to vehicle
accidents were really undetected suicides.
Only 126 childhood deaths(4%) purportedly were unintentional --- a lot less
than is implied by the headline and bar chart. I'm not sure how deaths that were
accidental due to unintended victims of drive-by shootings are classified. Are
these homicides or unintentional?
What is the real tragedy in the USA is that nearly 2,000 childhood deaths per
year are from homicides. As with suicides, if guns were not available chances
are that many of those homicides would have resulted in deaths by other means
such as knives or beatings.
What is very misleading in the above article is the failure to report number
of lives saved and rapes prevented when a "child" is killed by a gun. A goodly
number of the teens killed by guns were teens threatening police or teens who
invaded households or were attempting to commit violent rapes or car jackings
with their own weapons. Some were killed in armed holdups. Some were killed in
various other types of self defense.
And it's very misleading to compare nations and different cultures on the
basis of childhood gun deaths. Nations with fewer gun deaths are likely to have
fewer homicides, rapes, and/or suicides for various cultural reasons or they are
more dangerous for children (especially females) for other reasons. If fewer
children are killed by guns in Mexico City than in Chicago or Dallas does that
make the streets safer for children in Mexico City (or Bangkok or Rio)?
I'm all in favor of gun laws with severe punishments for guns that are not
very securely locked in place. I don't think there's a need for assault rifles
to be sold to anybody other than law enforcement and the military. But I also
think that gun possession is a deterrent that is impossible to build into
statistics. It's impossible to measure the number of crimes that did
not take place because of any one deterrent. I
believe gun possession is a deterrent to crime in the grand scheme of things.
And while we're at it, cancer one of the very leading killers of adults. But
it's played up more in the media as a killer of children than is warranted,
especially by non-profits seeking money for cancer care and research. But if you
look at the bar chart in the above article, 9% of childhood deaths from cancer
is only slightly higher than 7% of dying from suffocation (apart from drowning)
that gets very little fund raising attention in the media. Aside from vehicle
deaths, childhood deaths are relatively low. We, with the help of nature,
protect our children pretty well in the USA.
**How to Mislead With Statistics
The County in Each State With the Least Expensive Housing
https://247wallst.com/special-report/2019/03/21/the-county-with-the-least-expensive-housing-market-in-every-state-2/
Jensen Comment
Firstly, this really should read the least expensive houses to buy since it
ignores the rental markets such as rental markets for apartments.
The study is based primarily on median home values and suffers from the
frustrating lack of information about variances and skewness.
There is some added useful information such as the percentage of houses in
each county that are vacant. But this is sometimes confusing. For example, in
Clark County, New Jersey there is only a 10.2% vacancy rate with the median
house value at $161,596. in Clark County, Idaho 43.4% of the houses are
vacant and yet the median value of a home is $108,629. And then there's De Baca
County, New Mexico the median value of a house is only $69,412 with a vacancy
rate of 41.7%. It makes a little more sense for home values to be lower when
vacancy rates are higher.
But there are many other variables to consider that are ignored in this
study. For instance in Hawaii County, Hawaii the median value of a home is
$375,676 with a vacancy rate of 22.3%. This is probably because Hawaii is such
an outlier in a study like this. Another outlier is the Yukon-Koyukuk Census
Area that has a median house value of $83,596 with a whopping 51.8% vacancy
rate.
**How to mislead with statistics
Are over 1/3 of the adult population of the USA not interested in being in the
work force?
Record 92,898,000 Americans (aged 16 and over) Not In The Workforce ---
http://www.breitbart.com/big-government/2015/01/09/record-92898000-americans-not-in-the-workforce/
Jensen Comment
This is one way to mislead with statistics. A huge proportion of that 93 million
Americans supposedly not in the work force are really in the work force. A huge
proportion of them are working and drawing tax-free wages in the $2 trillion
underground cash economy, including legitimate work that's not reported (e.g.,
house cleaners) and illegal work (e.g., drug dealing and other crimes) ---
http://www.cs.trinity.edu/~rjensen/temp/TaxNoTax.htm
Secondly there are a high proportion of Americans who do not want to work or
cannot work. Millions get lifetime disability pensions. More millions have
partners or parents earning enough income for financial support.
**How to Mislead With Statistics (definitions, missing variables)
50 million Americans live below the official poverty income — here are the
poorest towns in every US state
https://www.businessinsider.com/poorest-towns-in-every-us-state-2018-9
Jensen Comment
This is highly misleading for a number of reasons. Firstly the poverty line in
the USA is upper middle class in the majority of other nations, especially when
things like the safety nets of earned income credits, Medicaid, SS disability
income, food stamps, housing subsidies, and welfare are factored into the
equation.
Secondly there's an enormous $2+ trillion underground economy where
supposedly USA's "poor people" are collecting substantial tax-free cash earnings
that are never reported by employers or employees. Often those unreported
earnings are supplemented by food stamps, housing subsidies, and welfare. The
types of underground economy earnings alternatives are listed at
http://www.cs.trinity.edu/~rjensen/temp/SunsetHillHouse/SunsetHillHouse.htm
And remember that crime often pays in America. Some of the fattest cats in
the luxury penthouses that drive the most expensive cars are drug dealers,
legislators, and City Hall executives.
**How to mislead
with statistics
The Most Expensive Wars in United States History ---
Click Here
http://247wallst.com/special-report/2015/05/21/the-most-expensive-wars-in-u-s-history/?utm_source=247WallStDailyNewsletter&utm_medium=email&utm_content=MAY222015A&utm_campaign=DailyNewsletter
Jensen Comment
The trend in warfare is the replacement of labor with capital. Soon wars will be
fought by robots and drones on both sides of battles. However, we may never be
able to eliminate collateral pain, suffering, and death of civilian casualties.
In recent wars medical (think antibiotics) and transportation (think
helicopters) technology for battlefield casualties soared in terms of saving
lives. This is a mixed blessing from a financial standpoint since mental and
physical casualties returning from war often need subsequent lifetimes of
support. It's terrible even today to recall the pain and suffering of soldiers
left to die on the battlefields of the USA's Civil War. But a cold and
calculating accountant would view this as less costly than treating a generation
of casualties on both sides.
In the article cited above the costs are understated.
Firstly, there's the lifetime cost of casualties returning from war. Secondly,
there's the cost of casualties left to die on historic battlefields --- such as
the cost of not having them come home to support their families. The other costs
not included in the article are mind boggling.
Return on Investment (ROI) ---
http://www.businessinsider.com/nba-highest-salaries-2015-2
**How to Mislead With Statistics
Most of the NBA's highest-paid players aren't worth it ---
http://www.businessinsider.com/nba-highest-salaries-2015-2#ixzz3T30XleVh
Jensen Comment
The above article does not estimate ROI for these highest-paid players. The
problem with both the article and ROI in general is that often factors
contributing to financial returns have higher order effects called
covariances, non-convexities, or whatever in mathematics. When these are
significant in a positive or negative sense they make attributions of
performance of a single factor extremely difficult or impossible. For example,
when Cleveland brought back LeBron James the entire sports world refocused on
Cleveland, including advertisers, ticket buyers, other players, etc. Because
there are so many higher order positive and negative effects it's impossible to
assess a single player's true worth to the team.
It's also impossible to judge the worth of a veteran player for a single
season since players like Kobe Bryant had enormous impacts across many seasons.
It's also impossible to judge the value a a player because there are so many
unknown opportunity values of alternative investments that might have been made.
For example, if Cleveland had decided to not invest in LeBron for this season in
favor of one or two of the best rookies who play elsewhere we cannot really be
sure how well those rookies would be playing for Cleveland's team since there
are so many team factors that affect a single performer. Exhibits A-Z are the
many players let go by teams who become stars on other teams.
**How to Mislead With Statistics
This epic chart shows the average wage for almost every job in America
---
http://www.businessinsider.com/the-average-wage-for-almost-every-job-in-america-2015-6#ixzz3d2buLBjq
Jensen Comment
Once again I remind readers of how misleading compensation rankings can be due
to missing variables in deriving the numbers. The biggest source of error
becomes "gross" versus "net" compensation. For example the highest paid
professionals in the USA are anesthesiologists and surgeons. But they may not
lead the pack in terms of net compensation
after deducting for malpractice insurance, business insurance, medical office
space costs, and medical office staff(receptionists, nurses, accountants,
computer technicians, etc.) Those who work for medical centers, including VA
centers, that pay anesthesiologists and surgeons net
of such expenses do not make nearly as much as the gross compensation rankings
in the comparisons in the above citation.
Gross compensation varies considerably with location. For example,
malpractice insurance is much cheaper in Texas due to a constitutional amendment
that caps punitive damages that make lawyers salivate. Office space costs that
must be covered in San Francisco and Silicon Valley is out of sight compared to
what it costs in Bangor, Maine.
Compensation also varies a great deal with perks that are almost impossible
to compare in various professions. For example, large public accounting firms
spend a fortune on training costs relative to what is drug chains spend for
training pharmacists and what doctors spend for training their nurses. For
newly-hired staff accountants this and on-the-job experience is more important
than starting salaries, especially for those accounting graduates who have no
intention of staying in public accounting pressure cookers for more than a few
years before moving on.
Some companies like Starbucks and Blue Cross Anthem will now provide free or
nearly-free general education leading to most any type of undergraduate degrees
(not necessarily job related) even for lowest-paid full-time employees whereas
this perk is not common in most other companies. The USA military branches
provide very generous college stipends for enlisted personnel to use even after
being honorably discharged. Those stipends in many instances cover full tuition,
room and board. We have a granddaughter who intends to join the Navy just
because of this perk.
Retirement benefits vary greatly. For example, in the private sector it's
rare to provide generous retirements to employees who are 40-50 years of age.
It's commonplace among USA military retirees. Several of my cousins retired from
the Air Force before they were 40 years of age and now live comfortably on
marginal farms (think cold northern Minnesota) that do not pay a whole lot
beyond military retirement benefits.
Job security also varies a great deal and is perk for which employees will
take sacrifices in take-home pay. For example, it's virtually impossible to be
fired from the USA Civil Service, which is why many folks try so hard to work
for the Civil Service. One of our sons who works for the largest Caterpillar
dealer in the world had a chance for promotion that would have given him a huge
increase in compensation. However, he would no longer have job security backed
by his union. He turned the promotion down.
College professors frequently turn down higher paying opportunities that do
not have tenure. Some that could nearly double their salaries will not give up
their tenure. For example, sometimes even endowed chairs in the Academy are
offered under conditions where tenure will only be evaluated after a year on the
job. Sometimes professors will not put their current tenure at risk by
relocating where they must be re-evaluated for tenure after a year. Bob Jensen
is Exhibit A, although when I moved from Florida State University to Trinity
University I did have to be re-evalueated for tenure after a year as the Jesse
Jones Professor of Business Administration. I had opportunities to move after
than without immediate tenure, but there's no way I would have done that again.
There's too much stress having to earn tenure more than once!
I have a friend who wanted to leave a university in Ohio so badly that he
gave up his tenure to move elsewhere. He lost three different professorships
after that and is, I think, belatedly sorry he sacrificed his tenured job
security.
Then are all the problems with comparing averages (means or medians) due to
varying standard deviations and that pesky kurtosis.
Bob Jensen's threads on careers are at
http://www.trinity.edu/rjensen/Bookbob1.htm#careers
**How to mislead with statistics (rankings, missing variables)
The Top Fifty Colleges and Universities in the USA
https://www.businessinsider.com/best-colleges-in-america-ranked-2018-9#1-harvard-university-50
Jensen Comment
Probably the least happy universities are the Ivy League universities that did
not make the Top 10.
It's a lot like comparing apples versus oranges when you compare
narrow-focused and tiny Swarthmore (Rank 31) with a mega university like Ohio
State (not in the top 50).
I won't go into my usual rant about why such rankings are misleading.
Probably the major complaint I have is the "halo" effect of historic reputation
and greatness in some disciplines (think science and literature) spills over
into some not-so-great specialties. For example, both Brown and Princeton have
finance majors, but I would not rank those majors nearly as high as finance
majors in some other universities like Bentley. Jagdish Gangolly will probably
argue that UC San Diego has a better medical school than many of the medical
schools in the Top 40 universities. Texas A&M and Harvey Mudd probably have
better engineering schools than most universities in the Top 50.
BYU, Texas, and Wisconsin have a better schools of accountancy than any of
the schools of accountancy in the Top 50 other than maybe Notre Dame and
Illinois.
Texas can hold its own in computer science against any of the Top 50.
My point here is that some of the Top 50 are ranked
in terms of historic greatness as opposed to current greatness.
**How to Mislead With Statistics
These 9 US colleges are more selective than some Ivy League schools ---
http://www.businessinsider.com/these-9-us-colleges-are-more-selective-than-some-ivy-league-schools-2015-3
Jensen Comment
There are various ways in which rejection rates can be misleading. The first
question to as is what proportion of the students who were accepted by these
nine US colleges would be rejected by Ivy League schools. My opinion is that
most would be rejected except for students admitted to exceedingly prestigious
universities like MIT and Stanford.
The College of the Ozarks is a unique institution where students work to pay
their tuition. Most students in the Ivy League schools can either afford those
schools or have significant financial aid. Rejection rates are high because
millions of students would like to get a free college education.
Except for some of those selective 9 colleges like Stanford and MIT, the
admission rates themselves are not comparable with Ivy League colleges and
universities. Most top graduates do not even bother (and pay) to apply to the
most prestigious universities like Harvard, Yale, Stanford, and MIT because they
conclude ahead of time that probabilities of being rejected are so high that
it's not worth the time, money, and stress to apply in the first place,
particularly graduates who do not have very unique resumes in addition to nearly
perfect SAT scores. White males and females who have not also done something
remarkable other than ace the SAT examination generally know what it takes to be
admitted to an Ivy League university.
An example of something unique might be to have gone to Haiti after a huge
hurricane and helped to teach children of victims in tent camps. Ot it might
help to have given piano lessons or math for three entire summers to children of
mothers incarcerated in prison.
What it takes to be admitted to a very prestigious university ---
https://alumni.stanford.edu/get/page/magazine/article/?article_id=66225
Also see
What does it really take to get into the Ivy League? Part I: Grades
What does it really take to get into the Ivy League? Part II: PSAT, SAT, and ACT
What does it really take to get into the Ivy League? Part III: AP, IB, and SAT
II Exams
What does it really take to get into the Ivy League? Part IV: Extracurriculars
What does it really take to get into the Ivy League? Part V: Essays
What does it really take to get into the Ivy League? Part VI: Recommendations
What does it really take to get into the Ivy League? Part VII: Application
Strategy
What does it really take to get into the Ivy League? Part VIII: Interviews
What does it really take to get into the Ivy League? Part IX: Checklist
What does it really take to get into the Ivy League? Part X: Epilogue
**How to Mislead With Statistics (uncomplete analysis, definitions_
"Is Law School a Better Investment Than Med School?" by Casey Sullivan,
FindLaw, December 4, 2015 ---
http://blogs.findlaw.com/greedy_associates/2015/12/is-law-school-a-better-investment-than-med-school.html
. . .
Lawyers have a median student debt of $89,926, 90
percent of their median salary ($100K), whereas doctors have a median debt
of $130,641, 98 percent of their median salary ($133K). Furthermore, the
average starting salary of lawyers in the private sector is $84K, compared
to the $55K doctors make in residency.
Continued in article
Reply from Paul Caron on December 10, 2015---
http://taxprof.typepad.com/taxprof_blog/2015/12/is-law-school-a-better-investment-than-medical-school.html#more
. . .
The news
comes from Credible, an online student loan
refinancing company. Credible looked at its data
for lawyers, doctors, teachers, and other
professions, to find out which degrees had the
highest return on investment. That data suggests
that a J.D. has a better ROI than an M.D.
According to Credible:
Lawyers have a median student
debt of $89,926, 90 percent of their median
salary ($100K), whereas doctors have a median
debt of $130,641, 98 percent of their median
salary ($133K). Furthermore, the average
starting salary of lawyers in the private sector
is $84K, compared to the $55K doctors make in
residency.
So, congrats, lawyers. We're
financial geniuses!
There are, of course, a few
caveats. ... According to the Bureau of Labor
Statistics, doctors might make a bit more than
Credible reports. The annual mean wage for
doctors generally is
about $195,000 a year. For pediatricians,
the median annual wage is $163,000. For
surgeons, the
mean is $240,440. (We know,
mean isn't the same as median, but many
doctor salaries are so high that the BLS doesn't
bother reporting median wages.) That would make
doctor debt a much smaller percentage of income
than lawyers'.
Here's
one of the problems when comparing incomes of lawyers versus doctors
https://www.businessinsider.com/highest-paying-job-in-every-us-state-2019-2
Note that there are much higher proportions of low income lawyers than doctors
such that medians and means are pulled down for lawyers --- thereby make those
statistics distorted.
Jensen Comment
The article is far more misleading than just for things mentioned by Paul Caron.
Firstly, the analysis is based upon mean averages without an analysis of
distributions. Means are especially misleading because they are impacted by
outliers. Secondly, the analysis fails to compare differences in how lawyers and
doctors are compensated. Lawyers tend to receive relatively low maintenance
salaries with much greater contingency awards depending upon lawsuit successes
and rewards for drawing in clients. Physicians tend to have less trouble
attracting patients and are paid on the basis of procedures and volume of
patients. General practitioners get compensated better for high patient volume.
Surgeon rewards come for the procedures where brain surgeons and organ
transplant surgeons are paid much more for procedures than general surgeons.
There's also great variation in compensation based upon opportunity for
overtime and utilization of that opportunity. I recall a Stanford University
study that concluded male physicians tended to make more due to the lower
propensity of many females to take on overtime. For example, female physicians
often prefer to be emergency room specialists where there are fixed hours per
week with little or no obligation for patient follow up in hospitals. Of course
there are wide variations in such conclusions as evidenced by the many female
pediatricians who have considerable opportunities for and obligations for
overtime.
In truth the averaging analysis combines too many unlike things such as
averaging compensation for general practitioners and the many, many specialty
physicians having great variations in compensation and costs of becoming
specialists. The same can be said of lawyers who have greatly varying
compensation depending upon specializations.
Averages across specialties are more misleading than helpful.
**How to
Mislead With Statistics (missing variables)
A college professor offered students 2 options for skipping a final exam — and
stumbled upon the most effective way to motivate people ---
http://www.businessinsider.com/a-college-professor-offered-students-2-options-for-skipping-a-final-exam-and-stumbled-upon-the-most-effective-way-to-motivate-people-2016-2
Jensen
Comment
In statistical analysis there are many sources of possible error. Leading
sources are missing variables. What is missing in this article is how the
outcomes will vary with the grading policies of the professor. For example, if
everybody in the class gets the same grade the outcomes of this research are
likely to be very misleading relative to a class having a high standard
deviation of course grades..
I looked up
this marketing professor on RateMyProfessor.com. Although the respondents at RMP
are self-selecting and usually only a small percentage of all students in any
class, the outcomes were a bit weird for this professor. Although the workload
of the course is rated fairly high, all respondents reported getting A+ course
grades.
My gut
reaction is that I do not trust the conclusions of this study if this instruct
truly tends to give almost all A or A+ grades. However, the subjective comments
tend to reveal that this instructor is a good teacher. However, different
alternatives for grading hardly mean much if the grade is the same under any
alternative
February 7,
2016 reply from Jagdish Gangolly
Bob,
The second alternative (losing the
right to the optional final if performance on quizzes is poor) was what my
college at the University of Bombay used. The college administered what was
called "preliminary examination" a few months prior to the university
finals. If you performed poorly on the preliminary exam, you could NOT sit
for the university final and automatically flunked out for a year. In a
sense it happened to me. Because my attendance in my sophomore year was
atrociously low (something like 12 percent of classes), the college refused
to allow me to take the preliminary exam. I fought the ruling tooth and nail
and finally won. If I had not, today I would be flipping hamburgers or
shining shoes.
It is important that in preparing our
syllabi laying out rules we recognize that young people make many stupid
mistakes. Some overgrow them, others do not. Syllabi are not places we
should try to discover our smarts. I would never include in my syllabi any
bargains for my students.
Regards,
Jagdish
**How to Mislead With Statistics
"How much you have to save every year if you want to put your kids through
college," by Libby Kane, Business Insider, April 27, 2015 ---
http://www.businessinsider.com/how-much-to-save-every-year-for-college-2015-4
Customized cost and savings calculators.
Jensen Comment
I've repeated elsewhere over and over that there are many factors that make the
cost of college education variable and uncertain. For example, the cost of
getting an online degree (even from a high quality university) while living at
home is a whole lot different than paying full tuition, room, and board for an
onsite degree at either a public or private university or college.
Also financial aid is common and very serious for a majority of students. The
tuition cost is now zero in many USA
prestigious (e.g., Ivy League) universities for students from families earning
less than $125,000 per year. In addition, President Obama is now forgiving all
or parts of student loans for a relatively small number of graduates.
The problem when the kids are very young lies in choosing a college savings
plan without knowing what lies ahead in terms of future tuition costs, living
costs, financial aid, etc. Colleges may be funded quite differently 20 years
from now, and we really don't know what kind of deals will be available way out
in the future. For example, it's entirely possible that the most prestigious
universities in the USA will be totally free to all students, albeit a highly
restricted number of students qualifying for admissions. It's entirely possible
that the first two years of college will eventually be free in most
state-supported universities.
Parents and especially grandparents currently contribute a great deal of
financial support from tax-advantages 529 Plans ---
http://en.wikipedia.org/wiki/Coverdell_Education_Savings_Account
Who knows if and how long those plans will survive?
These plans are currently clobbered by the Fed's "quantitative easing" (QE)
interest rates that through savers under the bus by paying virtually negligible
interest rates.
Bob Jensen's personal finance helpers ---
http://www.trinity.edu/rjensen/Bookbob1.htm#InvestmentHelpers
**How to Mislead With Statistics (missing variables)
Four great reasons to switch your career and become an accountant ---
https://www.businessinsider.com/sc/accounting-career-switch-reasons-2018-9
Jensen Comment
The "Pay is Great" Reason 2 is misleading. Except where accountants own their
own firms they are not likely to receive high-end compensation as spectacular as
many other professionals like physicians, architects, etc. The incomes of
lawyers are difficult to compare, because there is such variance in lawyer
earnings.
And starting salaries of accounting graduates
are generally lower than those of actuaries, engineers, computer scientists, and
pharmacists. Students are drawn to accounting by the availability of entry-level
jobs not requiring prior experience. More importantly they are drawn into those
jobs because of the valuable training and experience received and the ability to
then branch off into so many, many specialties in both the private and public
sectors. Years ago I read where, due to an increase in white-collar crime, the
FBI hired more experienced accountants than
experienced lawyers. That may have changed today due to the FBI's needs for
experienced technology experts.
Accounting is also one of the best tracks to the executive suites. CEOs and
CFOs often rose up from accounting degrees. In many of these instances, however,
accountants took on other specialties, especially finance and marketing, along
the way up.
Accounting, like law and medicine, is attractive due to both rural and urban
opportunities. Graduates in computer science and engineering may find slim
pickings for careers in small rural communities. However, those communities
still need teachers, nurses, physicians, lawyers, tax accountants, and small
business accountants.
And because of supply versus demand new accounting Ph.Ds are often the
highest-paid $125,000+ new faculty on college campuses ---
http://faculty.trinity.edu/rjensen/Bookbob1.htm#AccountingFaculty
Bob Jensen's threads on careers ---
http://faculty.trinity.edu/rjensen/Bookbob1.htm#careers
**How to Mislead With Statistics (distortions, missing variables)
The Atlantic: As younger generations become more racially diverse, many states
are allocating fewer tax dollars to public colleges and universities ---
https://www.theatlantic.com/politics/archive/2018/05/american-higher-education-hits-a-dangerous-milestone/559457/
Jensen Comment
The article misleadingly overlooks the major causes of reduced spending for
higher education.
Soaring Medicaid expenses have become the biggest expenditure items in most
state budgets, expenditures that cannot be as easily reduced as expenditures for
higher education. Couple Medicaid with underfunded pensions for state workers
and we see funding for higher education being left in political dust.
By way of illustration look at the Medi-Cal portion ($101.5 billion) of the
2018-19 pie chart for California at
http://www.ebudget.ca.gov/2018-19/pdf/BudgetSummary/HealthandHumanServices.pdf
For California the higher education budget for 2018-19 is proposed at $33.7
billion in comparison ---
http://www.ebudget.ca.gov/2018-19/pdf/BudgetSummary/HigherEducation.pdf
Click on "States" in the upper left corner to see states grading as to fiscal
responsibility and debt crises ---
https://www.statedatalab.org/
In other words the "radical diversity" issue is not so much a cause of
reduced support higher education as is a budgeting choice issue devoting the
lion's share of state budgets to health and welfare, especially Medicaid. And a
major cause of the increase in Medicaid spending is the way citizens are
figuring out how to divert long-term assisted living and nursing home expenses
to Medicaid. If families plan ahead more than five years in advance, they can
funnel more of their parents and grandparents resources into their own pockets
and shift the long-term nursing care expenses over to Medicaid. And then they
complain that the states are paying less for their children's state-supported
higher education.
Medicare and Medicaid were never intended by government to pay for so much
long-term nursing care of the middle class, but by one means or another schemes
have been devised to make long-term nursing care and the cost of dying for the
middle class as well as the poor. Medicaid is picking up a larger share of
long-term nursing costs and Medicare is picking up the cost of dying
(hospital, medication, and doctor bills).. The cost of
dying became the largest budget item in Medicare and is exploding as the
population of the USA ages. This is also the major cause, along with underfunded
pensions, of funds being diverted by states from
higher education to Medicaid.
The bottom line is that as the population ages we're seeing a
massive shift in state (and Federal) spending from
the young to the old as education money is
massively being diverted to Medicaid (and Medicare).
**How to Mislead With Statistics (distortions, missing variables, samples)
"The 11 most expensive countries for a university education," by
Lianna Brinded, Business Insider, December 28, 2015 ---
http://www.businessinsider.com/expert-market-11-countries-where-parents-spend-the-most-money-on-university-tuition-fees-2015-10
Jensen Comment
This has to be one of the most misleading articles that I have ever read. It's
not at all clear how the data is collected and aggregated, but it overlooks how
complicated it is to compute "tuition cost," especially in the USA. Firstly,
virtually all of the top state supported universities in all 50 states have
excellent academic reputations such as UC Berkeley, University of Washington,
University of Wisconsin, University of Illinois, University of Texas, Texas A&M,
University of Michigan, etc. Tuition costs vary greatly between what in-state
students are charged versus out-of-state students. In-state students get a
relatively good deal for both onsite and online degrees.
Secondly, the study seems to ignore the high proportion of need-based
financial support from both the top-ranked state-supported and private
universities. Education is virtually free for top students coming from
households having less than $35,000 in annual income plus social benefits like
Food Stamps and free Medicaid.
Thirdly, for students of lesser ability wanting to go to college the USA has
a fantastic network of state-supported universitiess, community colleges, and
branch campuses that are relatively low cost and not anywhere close to the
median tuition costs reported in the above article. Online degree alternatives
have exploded from these institutions which enables many students (especially
young parents) to live at home and not have to pay room and board costs on a
campus.
In the U.K., open university has hundreds of thousands of students who pay
less than £5,000, over 60,000 of them pay almost nothing. There are many other
universities in the U.K. that are similarly low cost.
I have only one comment left about the above article --- HOGWASH!
The problem is not the cost of higher education in the USA.
The problem is that the diplomas mean less and less due to grade inflation.
They are not a good deal due to the high cost of tuition. They are becoming a
worse and worse deal because of grade inflation that renders the education more
and more meaningless.
December 28, 2015 reply from Robin Alexander
I agree with Bob on this one. The article didn’t
give a hint on how it derived its numbers, and in Hungary’s case, they
didn’t seem to take the "free tuition if stay in country 10 years" into
account when making it #1 in percent of income eaten by tuition. Totally
undependable. But it gives rise to several points:
1. I do think that gross tuition (not taking into account loans, grants,
scholarships, etc.) is rising faster than median income as are crucial
services such as health care. This can cause problems for some qualified and
motivated students.
2. I agree that grade inflation is a huge problem. I graduated with
around a 2.8 (I was a late bloomer) that was considered good but not great
in my day. Towards the end of my teaching career, anybody with less than a
3.5 was barely considered hirable! I think the trend to grade inflation
really took off when “student evaluations” began to be used unscientifically
for raises and promotion at universities. Whatever the cause, at my
university there was tremendous pressure from deans on up to pass more
students and not give the grade they had earned. One of my colleagues
stuck to her guns and gave grades that the students deserved and for this
she was hounded out of the U.
3. I believe one of the worst things one can do to a young person is to
encourage an unable and unmotivated student to go to college. They will gain
little of benefit from the experience and will drag down the experience of
those who really want to be there.
There’s more, but this will do for now.
Robin Alexander
**How to Mislead With Statistics (missing variables)
This hidden car cost will set you back $3,000 a year
https://www.msn.com/en-us/autos/ownership/this-hidden-car-cost-will-set-you-back-dollar3000-a-year/ar-AAAufqL?ocid=spartandhp
Considering insurance, gas,
maintenance and repairs, most drivers are well aware of how expensive cars
are to buy and maintain.
In fact, the average cost to own and
operate a
new
vehicle
is $8,849 a year, according to an annual study by AAA, or just under 59
cents a mile if you average 15,000 miles of driving a year.
However, the largest
expense that comes with buying a new car largely falls under the radar, the
automotive group said.
"Depreciation
accounts for almost 40 percent of the cost of owning a new vehicle, more
than $3,000 per year," said Robert Sinclair, a spokesman for AAA Northeast.
Read on for more interesting ownership tips on
MSN Autos
New cars typically
depreciate the minute you drive off the lot. By the time it's a year old,
the vehicle has lost nearly one-third of its value, according to Edmunds
data.
The secret to minimizing
depreciation costs: "Keep your car for a long time and keep it
well-maintained or even consider buying a quality, pre-owned vehicle,"
Sinclair said.
Why you should buy instead
of leasing a car
For those currently car
shopping, in addition to the purchase price and the rate you'll pay to
finance a car, consider the length of time you plan to own your car,
Sinclair advised. By driving a pre-owned vehicle in good condition, you can
keep your costs way down over that time.
That idea has already
caught on. About 39.3 million used cars were purchased in 2017, up 1.8
percent from 2016, according to Cox Automotive. Alternatively, new car sales
were down 2 percent to 17.1 million.
Certified pre-owned car
sales, specifically, rose 1.6 percent year over year. (A certified pre-owned
vehicle, usually one coming off a lease, often includes warranty coverage,
which greatly reduces the worry that can also come with buying a used car.)
While President
Donald Trump's tariffs on new car sales haven't been enacted yet,
just the threat of higher prices on new cars could boost demand for used
cars even more.
For this year, 39.5 million
used cars are expected to be bought in the U.S., up even more from last
year, while new vehicle sales are expected to decline to 16.7 million, Cox
Automotive said.
"On the Money" airs
on CNBC Saturdays at 5:30 a.m. ET, or check listings for air times in local
markets.
More from Personal
Finance:
Continued in article
Jensen Comment
All my life I've driven pre-owned cars, because I was
aware of the tremendous loss of value (depreciation) in the first few years
when owning a new car. And usually the cost of leasing was very high for similar
reasons plus financing costs. But after 2008, when dealers themselves could
borrow money for close to zero interest rates, they tended to pass on much of
the savings to lessees such that leasing became a better deal than before 2008.
I leased a car for the first time in 2017. I think I
actually saved money.
What the article above fails to recognize is that there's
still opportunity value when leasing a car as long as you make money on the
opportunity to invest the money saved by not buying the car. In 2017 the
interest rates on CDs and most other safe investments was almost zero. However,
for years I've done very well investing in a Vanguard long-term insured tax
exempt bond fund. It actually works out, after-tax, that I'm better off keeping
the price of a new car in that fund and leasing a new car. I warn you that
investing in tax-exempt bonds in not entirely risk free and values of the bonds
can go up and down (usually only slightly). However, I don't ever plan to cash
in most of my tax-exempt investments to a point where I don't really care
whether their values go up or down as long as they pay a relatively generous
after-tax cash flow every month. They are also not good inflation hedges for
young folks. But I'm an old fart not much worried about inflation for the
remainder of my life.
Suppose that the monthly lease payments sum to $3,000 per
year for three years. Further assume that if I had instead purchased the car for
cash the drop in value (depreciation) would be $3,000 per year.
That seems like a wash for me give or take while at
the same time my after-tax return on the price of the car (say $25,000) in my
tax exempt fund is gravy on top of my pretty good leasing deal. And at the end
of the lease I don't have to either find a buyer for the car or take a lousy
trade-in deal offered by a dealer.
And at the end of the leasing period I have the option to
buy the car I've been leasing for three years. One advantage of this is after
three years I really know the car well --- it's not quite the same as buying a
pre-owned car that someone else drove for three years.
What I'm saying is that leasing may
or may not be a good deal for you, but I think it was a good deal for me.
It all depends upon the leasing deal you can make and the timing of when you
make it. Leasing rates are better when you drive very little each year. And
timing when you lease can be important. I leased a new 2016 model just when the
new 2017 models were coming out. Leasing a 2017 model was expensive compared to
leasing the new 2016 model for me because the
dealer adjusted the lease rate for the first year depreciation on a new 2016 car
that had never been driven.
And if you're a gambler at heart you can take the $25,000
that you do not spend on a new car and by Tesla stock at the moment --- not that
I'm recommending that you gamble on Tesla rather than invest in a tax-exempt
mutual fund. I'm not buying any Tesla stock. But then I didn't buy Apple stock
20 years ago. Sigh!
Warning 1: Depreciation per year is higher in the north
than than south. Due to winter's road salt it's almost impossible to find a good
pre-owned car in New Hampshire relative to Texas and Arizona.
Warning 2: Both leasing and ownership financing will
become worse deals is interest rates continue to rise in the USA economy.
Supreme Court of the United States ---
https://en.wikipedia.org/wiki/Supreme_Court_of_the_United_States
**How to mislead with statistics (missing values)
Physics and Math Predict Supreme Court Votes
http://www.physicscentral.com/explore/plus/supreme-court.cfm
Opinions of the Supreme Court
https://www.supremecourt.gov/opinions/slipopinion/18
Jensen Comment
I'm not taking issue with the records of the supreme court or models used to
predict judicial decision outcomes. What I do take issue with is how incomplete
these records are in judging the partisanship power of the Court or individual
members of the court based upon voting records. The power
of the Supreme Court is vast due to it's power to intimidate.
It's a lot like the trouble analysts have in trying to place fraud prevention
values on IRS tax audits or financial statement audits. We can examine
the records of actual audits in detecting fraud until the cows come home, but
we can never analyze frauds that never happened
because of fear of being detected in audits. The
same thing happens when trying to judge the Supreme Court and its members on the
basis of their voting records. What we cannot analyze is the vast set of all
cases or possible cases that never came to the court out of fear of what the
Court would decide.
I would contend that the more the Supreme Court is viewed as partisan the
larger the set of cases or potential cases that never will reach the court. For
example, after his decision on Obamacare and some other cases the current
Justice John Roberts is not viewed as horrifically conservative as many
progressives once feared. Justice Elena Kagan is not viewed as liberal as many
conservatives once feared. But these opinions are based
upon a relatively few number of cases that reached the Supreme Court.
The Supreme Court can be far more biased in selection of cases than in
deciding cases.
Furthermore, fear of a politicized court may prevent business firms, colleges,
states, etc. from even filing lawsuits initially out of fear of what might
happen on what is viewed as a "politicized" supreme court. For example,
California's new law favoring net neutrality is being challenged by the Federal
government. If California loses in a lower court decision will California be
afraid to carry the fight up to the current (post-Kavanaugh) Supreme Court?
Personally I think California might be foolish to appeal to the present USA
Supreme Court. California should fear that the Supreme Court's decision might
forever make it more difficult to fight for net neutrality --- net neutrality is
something I want badly. It may be better to wait until liberals have more power
to reinstate net neutrality in Congress and the White House.
My point here is that voting records per se are potentially misleading in
judging our Supreme Court or its individual members.
There is some evidence of Supreme Court bias on other grounds,
particularly the Harvard/Yale bias ---
http://articles.latimes.com/2010/may/12/opinion/la-oe-turley-supreme-court-20100512
I don't dispute this argument, although it is somewhat ironic that both
Justices Thomas and Sotomayor graduated from the Yale law school. I suspect that
these days the Yale Law School would like to disbar Justice Thomas even if he is
African American.
**How to mislead with statistics (missing variables)
It's cheaper to enroll people in Medicaid than to subsidize their private
insurance ---
Scroll down at
http://ritholtz.com/2018/08/10-sunday-reads-126/
Jensen Comment
This graph is misleading because it only looks at the short-term annual expense.
Subsidizing private insurance only covers short-term medical expense annually
and does not cover long-term nursing care. The two-ton guerilla is the excluded
Medicaid coverage of long-term nursing care that even Medicare won't cover. This
also is misleading in that private insurance might cover treatments by doctors
and hospitals that will not treat Medicaid patients.
Bob Jensen's threads on health coverage are at
http://faculty.trinity.edu/rjensen/Health.htm
**How to
Mislead With Statistics (missing variables)
Does Joining a Fraternity or Sorority Actually Improve Grades and Earnings
After Graduation? No, a Study Finds ---
https://www.chronicle.com/article/Does-Joining-a-Fraternity-or/244890?cid=at&utm_source=at&utm_medium=en&elqTrackId=a843f5d062714a6c9129459baa1c8036&elq=0b15c80bc2444a4ebdf14a2006f09188&elqaid=21105&elqat=1&elqCampaignId=10023
Jensen
Comment
I'm in agreement that Greek Life probably hinders study and lowers grades,
especially in the first year with Mickey Mouse pledge activities and later with
temptations such as daily card playing, pool, and other diversionary activities
including drinking parties.
I managed
to maintain A-level grades in a fraternity house for two years at Iowa State
University, but it was a huge struggle. When I transferred to Denver University
in my third year the last thing I wanted to do was to affiliate with my
fraternity on the DU campus.
It struck
me that there are too many missing variables in the above study to relate
correlation to cause, especially if it concluded (it didn't) that fraternity
membership improves grades. In theory membership could help grades such as
mentoring of brothers/sisters, but there are too many other missing variables
and sample selection bias in the above study. Firstly, I think most fraternity
members tend to be full-time students since most members would not have
additional time for part-time jobs or varsity sports when they carry full course
loads. Secondly, my anecdotal experience is that most brothers who really wanted
to work for grades moved out of the fraternity house because they were too
distracted by daily goings on in the house such as card games, group
television/movie watching, and levels of noise with members coming and going at
all hours of the day.
My point
here is that when you sample fraternity members you're not sampling a
homogeneous population. You're combining members who live in the fraternity
house with members who live elsewhere and simply come around now and then at
their own choosing. Those that live elsewhere such as in nearby apartments are
not a whole lot different from non-members who live in the same apartment
houses.
I did learn
some non-academic things in my fraternity such as how to make small talk when
meeting people for the first time. We had to wear coats and ties for evening
meals and learned not to ignore guests. We always stood up when a woman entered
a room --- which I guess is no longer such a politically correct thing to do.
And my fraternity stressed that sexual harassment or even getting "fresh" was
strictly verboten in our fraternity. Of course in those days fraternities were
only for white males and sororities were only for white women. There were some
silly rules. Back packs were acceptable, but no fraternity member would be
caught dead with a brief case. Neckties had to be plain and narrow with no
bright colors. Only dark blue or black was acceptable for blazers. Suits and
socks and matching shoes had to be dark. Tennis shoes were not to be worn with
suits or sport jackets. Dress shirts had to be white. Tennis shoes and socks
could only be white. Sweaters were not to have mixed colors and were worn only
with dress shirts.
My
fraternity life meant having to sacrifice sleep in order to maintain high
grades. This was one of the reasons, certainly not the only reason, that made me
want to change universities. Even back then I was bothered by the whiteness and
snobbishness of fraternities and sororities.
**How to Celebrate With Statistics (missing variables)
23 charts and maps that show the world is getting much, much better
https://www.vox.com/2014/11/24/7272929/global-poverty-health-crime-literacy-good-news
Jensen Comment
Since Vox leans to the left this article surprised me. The selected charts
provide positive trends of very important criteria (e.g., global poverty) in
society. It's pretty easy to quibble with international comparisons data. But I
decided to refrain from that this morning. Why not celebrate some good news for
a change? I'll drink to that later in the day. I'll also drink later in the day
because there's already snow on the ground on October 18, 2018
What's misleading here is the cherry picking of good news and overlooking the
bad news.
**How to Mislead With Statistics
The ITEP would have you believe that the poor in every state of the USA would be
better off if wealth was redistributed and the poor get even more of a free ride
in terms of state taxation
Institute for Taxation and Economic Policy ---
http://www.itep.org/
Also see
http://en.wikipedia.org/wiki/Institute_on_Taxation_and_Economic_Policy
"Who Pays?" ITEP, January 2015 ---
http://www.itep.org/whopays/
Jensen Comment
The first thing that makes me suspicious is that ITEP bills itself as being
bipartisan. There's nothing bipartisan about the Board of Directors of ITEP ---
http://www.itep.org/about/board_directors.php
Personally, I have much more respect for the professionalism and independence
of the Tax Foundation ---
http://taxfoundation.org/
Also see
http://en.wikipedia.org/wiki/Tax_Foundation
The Tax Foundation's Review of the ITEP report on "Who Pays?"
http://taxfoundation.org/article/comments-who-pays-distributional-analysis-tax-systems-all-50-states
The Institute on Taxation and Economic Policy (ITEP)
released a report last month titled Who Pays? A Distributional Analysis
of the Tax Systems in All 50 States.[1]
The study attempts to examine the overall level of regressivity of the tax
systems of the fifty states and Washington, D.C. and presents state and
local effective tax rates (total state and local taxes paid as a percentage
of income) for each state’s five income quintiles. The report finds that
nearly all states have regressive state and local tax systems.
The report also surveys the features of each state
and local tax system, characterizing each feature as either regressive or
progressive. Some of the tax system characteristics that ITEP regards as
regressive are narrow income tax brackets, lack of a state income tax, and
high reliance on sales and excise taxes. Progressive characteristics include
little reliance on consumption taxes and graduated income tax rate
structures.
Here we present three issues with ITEP’s
conclusions and policy recommendations, in addition to their methods of
presentation.
Issue #1: ITEP advocates tax policies that
dampen economic growth in favor of short-term income redistribution.
A tax system should choose long-term economic
growth over short-term redistribution.[2]
Tax Foundation Chief Economist Dr. William McBride recently published a
comprehensive review of the literature on the empirical relationship between
taxes and economic growth over the last three decades, finding overwhelming
evidence of a negative relationship between the two.[3]
What’s more interesting is that among the work that examined specific tax
types, researchers found that the most harmful to growth were corporate and
individual income taxes, followed by taxes on consumption. The least harmful
were taxes on property.
ITEP suggests that states move away from taxes on
consumption (sales and excise taxes) and aim for “highly progressive income
taxes.” That is, the report suggests moving more towards the taxes that are
most harmful to economic growth. One study in Dr. McBride’s survey, an OECD
panel data analysis, found progressive income tax systems specifically are
negatively related to economic growth.[4]
This may occur due to the way these systems disincentivize certain
behaviors. According to Dr. McBride,
The more we try to make an income tax progressive,
the more we undermine the factors that contribute most to economic growth:
investment, risk-taking, entrepreneurship, and productivity. This is because
high-income earners tend to do much of the saving, investing, risk-taking,
and high-productivity labor.[5]
ITEP suggests that states move toward a tax revenue
source that would harm future economic growth in favor equalizing incomes in
the short term.
Issue #2: ITEP recommends that state and
local governments rely on unstable sources of revenue.
ITEP suggests states move more toward progressive
income tax systems. Income tax revenues, however, are much more volatile
from year to year than sales taxes or property taxes. Using state and local
government finance data from the U.S. Census Bureau,[6]
we analyzed the U.S. totals of various combined state and local tax revenue
sources to identify the most volatile sources of tax revenue from year to
year. Figure 1 shows the annual percentage change in various types of state
and local tax revenues.
Figure 1 Not Quoted Here
The Census data indicates that the most volatile
source of combined state and local government tax revenues in the U.S. is
corporate income tax, followed by individual income tax and sales and gross
receipts taxes. Property tax revenues are the least volatile from year to
year. These findings are confirmed by a 2010 Tax Foundation analysis of
state tax revenue volatility by tax type, which found that corporate income
and personal income tax revenues were the most volatile.[7]
Further, the general shape of annual changes in revenues from taxes on
corporate income, individual income, and sales and gross receipts closely
follows the shape of the overall economy. Changes in income taxes, however,
are much more pronounced as the overall economy changes.
In their analysis, ITEP punishes states that depend
heavily on consumption taxes as a main source of revenue while advocating
moving toward income taxation. Depending largely on a volatile source of
revenue can cause budget issues in the event of an economic downturn. This
is especially important in light of the inadequacy of state rainy day funds
in providing additional funding during the most recent recession.[8]
Depending on high-income earners for tax revenue is
even more problematic. Using 2009 IRS data, we found that millionaire
income, in addition to the tax revenues they generate for the federal
government, is quite volatile:
Comparing the 2009 data to the pre-recession data
for 2007 shows that not only did the number of millionaires fall by 40
percent, but the overall income of millionaires fell by 50 percent. The
result for the U.S. Treasury was that 54 percent of the total drop in tax
revenues during this period was due to the falling tax collections from
millionaires.[9]
Though this example uses federal tax collections,
the principle still applies to state and local governments. The more a
government relies on volatile sources of revenue, the more unstable overall
funding will be when the economy dips.
Issue #3: ITEP includes one regressive
feature of the federal income tax in its calculations, but excludes the rest
of the highly progressive federal income tax.
Perhaps the most problematic part of ITEP’s report
is its selective inclusion of federal policy. When ITEP presents effective
state and local tax rates they also include what is known as the federal
offset. The federal income tax code allows taxpayers who itemize their
deductions to claim tax payments to state and local governments as a
deduction. ITEP argues that since this benefit disproportionately helps
high-income taxpayers lower their total tax bill, it should be accounted for
in an analysis of regressivity. Including the federal offset in an analysis
of state and local tax structures is misleading because it is a feature of
the federal tax code, not state and local tax systems.[10]
When the federal offset is not included in the
calculations of state and local effective rates, ITEP’s regressivity
conclusions are much less severe. ITEP also breaks the top quintile into
three smaller income groups, making the difference between the richest and
the poorest appear much more pronounced. In the following analysis, we
present the top quintile as a whole, rather than breaking it up into smaller
income groups. Figure 2 shows the U.S. average of state and local effective
tax rates, with and without the federal offset.
Fiture 2 Note Quoted Here
Continued in the article
Jensen Conclusion
It all boils down to how biased the unending debate about whether the poor will
be better off if all wealth and income is equally distributed versus whether the
poor in the USA are actually doing better by having incentives to strive for
differential wealth and income.
Some analysts argue that we will have just as many dedicated brain surgeons
if they make no more than dishwashers in a restaurant. I happen to not agree,
but it's probably something that cannot be answered with data since we have very
little to compare it with. Castro complained that when Cuban workers all
received the same allowances they did not want to work very hard. Certainly,
many of the most skilled professionals escaped and are still trying to escape
Cuba. But comparing Cuba with the USA is not really fair in terms of so many
factors affecting prosperity.
In the final analysis it's still Karl Marx versus Friedrich Hayek
Karl Marx ---
http://en.wikipedia.org/wiki/Karl_Marx
Friedrich Hayek ---
http://en.wikipedia.org/wiki/Friedrich_Hayek
The world is still waiting for any of the 200+ nations to demonstrate that
Karl Marx had a better idea.
In Cuba where the goal was to eliminate inequality, Fidel Castro found that
his ration books, free housing, free public transportation, and minimal wages
destroyed incentives to work.
Why did Cuba
abandon its socialist/communist dream of equality for everybody?
The Guardian: This was the
egalitarian dream of Cuba in the 1960s: For years in Cuba, jobs as varied as
farm workers and doctors only had a difference in their wages of the equivalent
of a few US dollars a month.
https://www.theguardian.com/world/2008/jun/12/cuba
Jensen Comment
Only now is Cuba backtracking from its egalitarian dream by uncapping wages and
legalizing profits while liberals in the USA want to return again to the 1960s
Cuban dream.
"Report: Castro says Cuban model doesn't work," by Paul Haven.
Associated Press, Yahoo News, September 8, 2010 ---
http://news.yahoo.com/s/ap/20100908/ap_on_re_la_am_ca/cb_cuba_fidel_castro_5
Fidel Castro told a visiting American journalist
that Cuba's communist economic model doesn't work, a rare comment on
domestic affairs from a man who has conspicuously steered clear of local
issues since stepping down four years ago.
The fact that things are not working efficiently on
this cash-strapped Caribbean island is hardly news. Fidel's brother Raul,
the country's president, has said the same thing repeatedly. But the blunt
assessment by the father of Cuba's 1959 revolution is sure to raise
eyebrows.
Jeffrey Goldberg, a national correspondent for The
Atlantic magazine, asked if Cuba's economic system was still worth exporting
to other countries, and Castro replied: "The Cuban model doesn't even work
for us anymore" Goldberg wrote Wednesday in a post on his Atlantic blog.
He said Castro made the comment casually over lunch
following a long talk about the Middle East, and did not elaborate. The
Cuban government had no immediate comment on Goldberg's account.
Since stepping down from power in 2006, the
ex-president has focused almost entirely on international affairs and said
very little about Cuba and its politics, perhaps to limit the perception he
is stepping on his brother's toes.
Goldberg, who traveled to Cuba at Castro's
invitation last week to discuss a recent Atlantic article he wrote about
Iran's nuclear program, also reported on Tuesday that Castro questioned his
own actions during the 1962 Cuban Missile Crisis, including his
recommendation to Soviet leaders that they use nuclear weapons against the
United States.
Even after the fall of the Soviet Union, Cuba has
clung to its communist system.
The state controls well over 90 percent of the
economy, paying workers salaries of about $20 a month in return for free
health care and education, and nearly free transportation and housing. At
least a portion of every citizen's food needs are sold to them through
ration books at heavily subsidized prices.
President Raul Castro and others have instituted a
series of limited economic reforms, and have warned Cubans that they need to
start working harder and expecting less from the government. But the
president has also made it clear he has no desire to depart from Cuba's
socialist system or embrace capitalism.
Fidel Castro stepped down temporarely in July 2006
due to a serious illness that nearly killed him.
He resigned permanently two years later, but
remains head of the Communist Party. After staying almost entirely out of
the spotlight for four years, he re-emerged in July and now speaks
frequently about international affairs. He has been warning for weeks of the
threat of a nuclear war over Iran.
Castro's interview with Goldberg is the only one he
has given to an American journalist since he left office.
California's Senator Kamala Harris ---
https://en.wikipedia.org/wiki/Kamala_Harris
**How to Mislead With Statistics (missing variables)
Presidential Candidate Kamala Harris Promises Basic
Income for All: Every person in the USA
should file a tax return --- it's like Filing for Dollars where more than 80%
of the people in the USA win extra cash--
https://www.harris.senate.gov/news/press-releases/harris-proposes-bold-relief-for-families-amid-rising-costs-of-living
Jensen Comment
The missing variable here is how to pay for her "unlimited" spending programs.
Senator Harris promises refundable "tax credits" to Americans who make less than
$100,000 --- those taxpayers who currently only pay 20% of of the USA's income
taxes. People making over $100,000 pay 80% of the nation's income taxes.
Nearly half of all people filing income tax returns
currently pay zero income taxes. Many more don't currently file
tax returns at all such as children in college and folks working in the tax-free
$2 trillion underground economy ---
https://www.forbes.com/sites/kellyphillipserb/2016/05/13/americans-who-make-more-than-100000-pay-80-of-federal-income-taxes/#669a5e3c3ff4
Under her proposal more than 80% of the people in the USA could
receive a basic tax-free income. Every person should
file a tax return --- it's like Filing for Dollars.
This is not the negative income tax that Milton Friedman once
proposed. Friedman wanted to replace the safety nets (Medicaid, welfare, food
stamps, housing subsidies, etc.) with a negative income tax. Kamala's basic
income proposal, however, gives cash back in addition to increasing all safety
nets with her added proposal for rent relief ---
https://reason.com/blog/2018/07/20/new-kamala-harris-bill-asks-federal-taxp
Also, those that are able can work tax free in the $2 trillion underground
economy for added cash.
In addition she proposes no
spending limits on the green initiative plus free health care, student loan
forgiveness, free college, and cash reparations to African and Native Americans.
All told she's promising social and environmental spending of over $100 trillion
or much more ---
https://www.foxnews.com/politics/kamala-harris-dismisses-concerns-about-green-new-deal-price-tag-its-not-about-a-cost
She's promising unlimited government spending to be assured of winning the USA
presidency. It just might work since most
millennials don't have clue about economics!
The missing variable here is how to pay for her "unlimited"
spending programs. The math just doesn't work out even if we tax 100% of the
income of high earners. Remember that existing entitlements for Medicaid,
Medicare, Social Security, Aid for Disable Persons, etc. add another $100+
trillion.
A hundred trillion here and a hundred trillion there ---
pretty soon were talking Venezuela or Zimbabwe.
Where's Paul Krugman when we need him most?
Kamala Harris announces $100B plan for black home ownership,
tackling racial wealth gap ---
https://www.blabber.buzz/conservative-news/609928-kamala-harris-announces-100b-plan-for-black-home-ownership-tackling-racial-wealth-gap-special?utm_source=c-alrt&utm_medium=c-alrt-email&utm_term=c-alrt-GI
Giving them free health care, free medications, guaranteed annual income,
reparations awards, free food, and lower standards for college graduation just
isn't enough. The bounty for being black just keeps piling on.
How to Mislead With Statistics (emotions rule)
Three reasons why people fall for politicians’ lies about statistics ---
https://theconversation.com/3-reasons-why-people-fall-for-politicians-lies-about-statistics-110014
Jensen Comment
A reason for being misled (related to letting emotions rule) is hoping that the
politician will become powerful enough to make the lie come true. For example,
many people are falling for statistics cited and the promises made by promises
of guaranteed income for everybody in the USA (think AOC and Kamela Harris).
Nancy Pelosi warns of the hazards of believing those lies.
“You have to make decisions that you’re going
to reach certain goals, and some of our goals
we think are achievable”
Nancy Pelosi (when criticizing Alexandria's Green New Deal and
Basic (Guaranteed) Income
Click Here
**How to Mislead With Statistics (bias, missing variables)
Billionaires (like progressives Howard Schultz and Mike Bloomberg) who hate
Alexandria Ocasio-Cortez's 70% tax on the superrich are adamant it will hurt the
USA economy — but history suggests otherwise (Yeah right) ---
https://www.businessinsider.com/alexandria-ocasio-cortez-70-percent-marginal-tax-fix-impact-on-economy-2019-2
Jensen Comment
What billionaires ever paid the highest marginal rates when they were 70%-90%
back in the 1960s?
When the rates were this high the Income Tax Code was so riddled with loopholes
for high income folks that none of them ever paid 70%-90% tax rates.
When Top
Rates Were So High: Do you really think Bing Crosby and Bob Hope paid 90
percent of their income to the taxman?
https://www.bloomberg.com/opinion/articles/2019-01-29/hollywood-stars-didn-t-pay-90-percent-tax-they-created-loopholes
Sweden unlike the USA did not have so many loopholes, but Sweden learned from
its mistakes and lowered the marginal rates.
How Democrats Want To Tax The Rich ---
https://taxprof.typepad.com/taxprof_blog/2019/03/how-democrats-want-to-tax-the-rich.html
Why did liberal
Sweden axe its wealth tax while at the same time lowering its top income tax
rate from 87% (1979) to 65% (1990) to 56% (2002)? ---
http://ftp.iza.org/dp11475.pdf
Elizabeth Warren would probably prefer that you do not
study experiences of all disastrous Scandinavian wealth taxes and very high
marginal income tax rates that were later greatly reduced to stimulate the
economy (called supply side (Laffer Curve) economics) ---
http://www.econlib.org/library/Enc/MarginalTaxRates.html
Larry Summers ---
https://en.wikipedia.org/wiki/Lawrence_Summers
Summers on the Wealth Tax ---
https://marginalrevolution.com/marginalrevolution/2019/10/summers-on-the-wealth-tax.html
Larry Summers is my favorite liberal economist
because even while maintaining his liberal values he never stops thinking
like an economist. That makes him suspect among the left but it means that
he is always worth listening to. The video below with Saez, Summers and
Mankiw (with Rampell moderating) is excellent throughout. I cribbed a number
of points from Summers:
“I have studied last week’s
twitter war very carefully and I have to say that I am 98.5% convinced by
the critics that the Zucman-Saez data are substantially inaccurate and
misleading.”
The arguments around political
power are not persuasive. Most of what is wrong with politics is because
that is what the people want (I’m filling in a bit here from comments
throughout). A wealth tax does nothing about corporate lobbying and would
increase the incentive to give to
political organizations. If you cut wealth at the top by 30% that wouldn’t
change relative political power in the slightest.
Wealth is up in large part
because interest rates are down which means that permanent income hasn’t
increased.
Forced savings programs like
social security and unemployment insurance mean that people at the bottom
need to save less and thus their wealth falls even as their welfare
increases.
A wealth tax increases the
incentive to consume instead of save and invest.
On employee stock ownership
plans: “When you put workers in control of firms and you give them
substantial control–see Israeli kibbutz’s, see Yugoslav cooperatives, see
universities where faculties have a powerful voice–the one thing you do
not get is expansion. You get more
for the people who are already there. That does not seem to be an attractive
position for progressives.”
In the Q&A Summers just goes to
town on Saez when Saez claims 90% tax rates are a great American invention.
“The people who were around in the Kennedy administration who were at least
as progressive as you are were united in the belief that 90% tax rates were
a bad idea….The number of people who paid those 90% tax rates was trivial
and it wasn’t because there weren’t a lot of rich people.” Greg Mankiw, who
gives a nice parable in his remarks, has to stifle a laugh as Summers lets
rip.
Also
see
https://mises.org/wire/problem-elizabeth-warren’s-wealth-tax-plan?utm_source=Mises+Institute+Subscriptions&utm_campaign=c9499c2e11-EMAIL_CAMPAIGN_9_21_2018_9_59_COPY_01&utm_medium=email&utm_term=0_8b52b2e1c0-c9499c2e11-228708937
A message for regular readers of this blog: unless
something big breaks later today, this will be my last day blogging AT THIS
)NYT) SITE. The Times is consolidating the process, so future blog-like
entries will show up at my regular
columnist page. This should broaden
the audience, a bit, maybe, and certainly make it easier for the Times to
feature relevant posts.
It will also, for technical reasons, make my
life simpler — you’d be surprised how many
hoops I have to go through to get these (NYT) things posted. But that’s not
the reason.
Anyway, I expect to be doing
the same sort of thing, mixing regular columns with stuff, usually wonkish,
that doesn’t belong in the regular paper. Old blog posts will remain
available.
One of the things I dislike about Paul Krugman is his inconsistency.
Previously he wrote the following about open border immigration and economic
safety nets (welfare, free medical care, free education, housing subsidies, food
stamps, etc.)
A Comprehensive Approach To Law School Access Admissions ---
http://taxprof.typepad.com/taxprof_blog/2018/08/a-comprehensive-approach-to-law-school-access-admissions.html
**How to Mislead With Statistics (missing variables)
Shameful: Lack of Diversity in the CPA Profession ---
https://cpatrendlines.com/2010/03/02/shameful-lack-of-diversity-in-the-cpa-profession/
Jensen Comment
Statistics on diversity in the "CPA Profession" can be very misleading. Firstly,
the "CPA Profession" is only a part, not even a majority part, of the total
accounting profession. Passing the CPA examination and obtaining the experience
requirements to become a CPA are not required for many, many types of accounting
jobs. Accounting careers are highly varied in both the public and private
sectors. Secondly, those minority college graduates who do become CPAs face
tremendous opportunities to leave the public accounting profession. Sometimes
clients will offer almost whatever it takes to lure minority CPA's away from the
CPA firms.
My point here is that there should not be a knee-jerk reaction that the enormous
shortage of minority partners in CPA firms is ipso facto evidence of
negative prejudice. Firstly, very few CPA firm recruits (white and minority)
ever expect or even want to become CPA firm partners. Many of those recruits
start out in CPA firms for the training, experience, and the fact that it's
often easier to land the first job in a CPA firm for whites and minorities
provided they have good grades. Many, however, cannot or otherwise do not pass
the CPA examination. Others pass the CPA examination but really never want to
become partners due the many negatives about becoming a CPA firm partner,
including lots of out-of-town travel, expectations of bringing in new clients
and keeping existing clients happy, stress of job performance such as missing
something really important in an client's audit or a client's tax return or a
client's accounting system.
Retaining African Americans in the Accounting Profession---
https://4f2bur4nuye2cgakm2rm61qk-wpengine.netdna-ssl.com/wp-content/uploads/2010/03/Howard-U-Retaining-African-Americans-In-Accounting-Profession.pdf
**How to Mislead With Statistics (missing variables, distortions)
Engineers Are Leaving Trump’s America for the Canadian Dream ---
https://www.bloomberg.com/news/features/2018-04-20/h-1b-workers-are-leaving-trump-s-america-for-the-canadian-dream
Jensen Comment
The above article is not so misleading in terms of the subset it deals with
coming into Canada --- engineers from nations other than the USA.
What is misleading, however, is that it ignores Canadian engineers coming into
the USA. I don't know the immigration ratio is for engineers, but the total
immigration ratio of Candada/USA is roughly 5/1. Among these some are most
certainly STEM graduates who cam down from Canada for college in the USA and
then stay on in the USA. It is not at all clear that engineers are leaving
America for Canada in terms of net migration patterns. Employment opportunities
for engineers are greater in the USA. Those with Ph.D.s certainly have many more
USA colleges and universities to choose from if they want to enter the Academy.
April 22, 2018 reply from Jagdish
Bob,
The educational standards in India are not uniform.
The quality of education at most Indian Universities is horrible even by
American standards. However, the standards at the national institutes (such
as Indian Institutes of Technology, Indian Statistical Institute, Indian
Institutes of Management, Indian Institute of Science, Indian Agricultural
Research Institute, All India Institute of Medical Sciences,...) are world
class. However, the competition for admissions is brutal. Many of the
candidates applying there use Ivy leagues as safety schools (example: the
billionaire Narayana Murthy, the chairman of Infosys. His son used Cornell
as a safety school while applying to IITs. He did not get into any of the
eight or so then IITs, but got in easily to Cornell). In 2014, 1.3 million
students appeared for the IIT joint entrance examinations. Of them the top
150,000 scorers were considered for the second round advanced entrance
examination, but only 27,152 qualified to take the advanced entrance
examination. Of these, about 10,000 were admitted. When I applied for
admission into IIMC, the two IIMs had 200 seats for which about 15,000
applied. Of the 100 selected 24 were whisked away by American universities
with admissions and hefty scholarships. These numbers should indicate why
not many students from the US go there for studies.
Of late, many Indian immigrants here do send their
children for medical schools to India when they do not get into schools
here. And private medical schools do charge them hefty fees. One of my
nieces went there after a degree from Berkeley when she could not get into
any medical schools here. And I have heard of some white ethnic American
students going to study medicine in India. Some medical schools here also
have sister med schools in India. For example, Loma Linda University where
my late wife practiced and taught residents had such a relationship with a
medical school in India (at the same university where Microsoft CEO Satya
Nadel studied engineering).
The American students who do go to India to study
are usually in areas such as anthropology, Linguistics, Music, and
occasionally political science and history. When my sister was doing her
masters in solid state physics in the late 1960s her roommate was an
exchange student from the US who was a music and dance major.
On the other hand, the number of Americans who go
to India as expats has sky-rocketed. All major US corporations have large
offices and do send their US executives there for international exposure.
Also, many Indian companies actively recruit Americans, but those companies
are quite snooty; they usually recruit primarily from Ivy leagues and other
private schools such as Chicago and Stanford.
Regards,
Jagdish
**How to Mislead With Statistics (missing variables)
Has Connecticut found a solution to underfunded public pensions?
https://www.statedatalab.org/news/detail/has-connecticut-found-a-solution-to-underfunded-public-pensions
“As pension solutions go, those are all pretty
standard stuff. But the other approach Connecticut is considering is truly
fresh. The state’s inventory of real assets on its books, such as office
buildings, parking lots, raw land or highway right-of-ways, identifies
nearly 7,000 properties. An initial estimate is that these assets could have
an overall value in the billions. If the state were to include certain state
enterprises, such as toll-roads, that number could reach even higher. A
question arose: In lieu of cash, can the state donate any of these real
assets as an in-kind contribution to its pension funds?”
Jensen Comment
There may be some assets of value that can be held by pension funds, but to say
that most of these assets have "overall value in the billions to pension funds."
is misleading. For example, raw land might have value if it can be quickly sold
with low transactions cost. However, selling some of this raw land may not be
such a hot idea such as selling flood plains or parks. Selling parking lots may
have some drawbacks if the parking lots will be developed in a way to leave lots
of people without parking. What about selling office buildings that house state
workers? Would the state have to start paying rent to owners? Could the owners
evict the state workers?
All told it seems to me that this is a very fuzzy
idea with enormous transactions costs as well as enormous long-term
losses to the state.
**How to Mislead With Statistics (missing variables)
Based on civil rights data released by the U.S. Department of Education,
ProPublica has built an interactive database to examine racial disparities in
educational opportunities and school discipline ---
https://projects.propublica.org/miseducation?elqTrackId=f06df2359e6340a6a4812a071e9b430e&elq=348c473b7310444cae0eee9348850b4b&elqaid=21012&elqat=1&elqCampaignId=9959
Scroll down to the table below the graph
Jensen Comment
I don't deny that there's racial inequality in schools. However, in terms of
discipline differences it struck me that the schools shown with the highest
disparity in in nonwhite student high discipline are also the schools with the
greatest likelihood of nonwhite teachers and administrators doling out the
discipline. The worst school districts are often the districts with the highest
proportion of single-parent homes where discipline at home is often more
difficult, especially in districts with a stronger influence of youth gangs.
My point is that the data reflect deeper societal
problems that go beyond racial bias of teachers and administrators. If
there was a magic bullet to eliminate racial bias in the classroom the data
might not dramatically change for the worst performing school districts. The
magic bullet has to be found outside the schools.
Of course some of the school districts with white majorities have disgraceful
racial prejudices in the schools that are reflected in this data.
**How to Mislead With Statistics (distortions, missing variables)
Yahoo Finance MAP: The most and least tax-friendly states ---
https://finance.yahoo.com/news/map-least-tax-friendly-states-144250362.html
Jensen Comment
It's somewhat misleading compare states by aggregating their taxes. The main
problem is all the variations in tax breaks and exclusions. Sales taxes are not
equal in terms of products that have exemptions and states that have sales tax
holidays. California has the infamous Proposition 13 on property taxes, but
other states have somewhat similar, albeit more limited, exclusions. For
example, Bexar County (think San Antonio) gives seniors a limited property tax
break on school district taxes. New Hampshire has no general income tax but has
a sneaky tax on cash dividends and interest (that are not not part of retirement
plans) after a $5,000 exemption. New York has a 10-year income tax exemption for
executives whose companies partner with universities in research.
**How to mislead with statistics (distortions, missing variables) ---
The median cost of a private nursing home room has reached $100,375 per year,---
https://www.cnbc.com/2018/10/19/this-retirement-expense-has-hit-100000-annually-and-its-continuing-to-rise.html
Actuarial models of long-term care insurance providers greatly underestimated
the rapid rise in costs and recently had to more than double the monthly rates
for such insurance. The "median cost" of $100,375 is misleading in that this
cost has a wide overall variance and a median that differs substantially between
the 50 USA states. In fairness the article touches on this point slightly (such
as pointing the high cost of nursing homes in Alaska). There's also extreme
variability in terms of quality of care. This, in part, is due to the high
worker turnover in nursing homes and the tendency for many to hire unskilled
workers at minimum wage. My point is that comparing nursing homes is a lot like
comparing sweet cherries with sour lemons.
Sadly, parents that made the most sacrifices for their adult
children often are the least-supported in their own times of needs years later.
The good news is that with professional guidance more than five
years in advance, heirs can legally confiscate Grandma's estate so that she's
eligible later on for Medicaid-provided long-term nursing care. The bad news is
that the quality of many nursing homes that accept Medicaid patients is often
the worst in the USA. Maybe we should be more like the Germans who sometimes
ship their gaga grandmas and grandpas to to relatively good lower-priced nursing
homes in Poland.
Nursing Home and
Hospital Elderly-Care Fraud
Elderly residents given intensive therapy in the last weeks of life jumped 65
percent, a study shows, raising questions about financial incentives. ---
https://www.bloomberg.com/news/articles/2018-10-09/nursing-homes-are-pushing-the-dying-into-pricey-rehab?cmpid=BBD100918_BIZ&utm_medium=email&utm_source=newsletter&utm_term=181009&utm_campaign=bloombergdaily
Bob Jensen's threads on health care
http://faculty.trinity.edu/rjensen/Health.htm
**How to Mislead With Statistics (missing variables)
Students in a new Rutgers study indicate pay doesn't matter in selecting a major
---
https://www.insidehighered.com/news/2018/08/17/rutgers-study-pay-doesnt-affect-students-major-choice?utm_source=Inside+Higher+Ed&utm_campaign=e04f10c3ed-DNU_COPY_01&utm_medium=email&utm_term=0_1fcbc04421-e04f10c3ed-197565045&mc_cid=e04f10c3ed&mc_eid=1e78f7c952
Jensen Comment
I did not investigate details of this survey. Hence I can only speculate based
upon my 40 years of experience in teaching mostly accountancy. There are two
types of pay. One is starting salary. The other is long run opportunity salary.
Students now pay a price for majoring in accountancy. It's not possible to
take the uniform (nationwide) CPA examination without getting 150 credits which,
in nearly all instances, entails getting a masters degree in accountancy.
Secondly, there are a lot of accounting, tax, ethics, law, computer, auditing,
and other courses that must be taken before being allowed to sit for the CPA
examination, although the numbers of such courses vary among the 50 states. And
on top of that starting accounting salaries are not notably high when compared
with average starting salaries for students with degrees in engineering,
pharmacy, etc.
This begs the question of why do students major in accounting?
The answer is somewhat complicated. Firstly, accounting graduates are almost
(not entirely) assured of getting multiple job offers before they even graduate.
Secondly, accounting majors are attracted to internships that are usually
offered in the senior year, internships that usually lead to job offers during
the internships. Thirdly, and probably most importantly, accounting firms tend
to offer tremendous training programs and on-the-job exposure to multiple
clients, clients that in turn often end up offering jobs to younger graduates
still in training by public accounting firms.
My point is that high starting salaries do
not attract most accounting majors. What attracts them are lots of job openings
at graduation date combined with long-run opportunity trails, some of which lead
to the executive suites.
What attracts accounting majors is the virtual assurance of getting a job after
earning their masters degrees and the tremendous and varied career choices that
those starting jobs lead to further down the road. Being an accounting graduate
can be a great track to becoming a highly paid executive. Plus there's the
possible choice of going on for a Ph.D. after some years of professional
experience where accounting Ph.D.s are the highest paid graduates going into
academe (there's a tremendous shortage among colleges for tenure-track
candidates in accountancy).
I might also add that "pay" is somewhat relative. For example, why do so many
students major in KI-12 education. Some just want to serve the world as
teachers. But others think ahead to to earning salaries and still having 2-3
months each summer for raising a family, writing books, farming, or teaching
summer school to earn added "pay" not measured in the salary data not shown in
to students in the above Rutgers survey.
Lastly, I might mention that students are sometimes attracted to majors where
they're more likely to graduate with high grade averages. What limits the number
of accounting graduates is that accounting is usually a tougher major other
majors in the business school. In a top engineering school students who do
poorly the first year often track into other majors including business degrees.
Weaker business schools sometimes are in universities that have very tough
engineering schools.
Also the some majors are so popular that universities limit the number of
those majors by setting minimum grade averages for those majors. It's not
uncommon for universities to require a 3.0 gpa or higher to major in accounting
as an undergraduate. And students who want to sit for the CPA exam must qualify
for admission to a masters program that usually entails having a high grade
average plus a respectable score on the GMAT or GRE.
**How to
Mislead With Statistics
(distortions, missing variables)
It's undoubtedly a blue-state bastion. But far from being a socialist hellhole,
the Golden State is thriving after years of malaise ---
https://www.politico.com/magazine/story/2019/02/21/trump-california-attacks-economy-225191
Jensen
Comment
Politico is a popular liberal site that's very biased. It's not a fake news site, but
it does heavily cherry pick for liberal views and leaves out conservative
counterpoints. A good example is the above Politico site. Except for housing
costs it brings out the many positives of California and leaves out the
negatives such as high income taxes (just about the highest in the nation). high
fuel costs (highest in the nation), traffic (among the worst in the nation),
overcrowded prisons )it can no longer afford), and the severe natural disasters
such as forest fires and extreme cycle of droughts to floods and back again.
The
site fails to mention flight of businesses. Exhibit A is Apple's decision to
invest over a billion dollars in HQ2 in Austin, Texas ---
https://www.apple.com/newsroom/2018/12/apple-to-build-new-campus-in-austin-and-add-jobs-across-the-us/
The
site praises the trend downward in the number of undocumented immigrants flowing
across the southern border without giving any credit to the highly effective
fencing installed by the Federal government.
California is a sanctuary state that protects undocumented residents at the
expense of legal residents. For example, home and business cameras
now have options for face recognition software. But in places like San Francisco
face recognition technology is now banned because it might recognize
non-citizens ---
https://www.businessinsider.com/microsoft-cruel-to-stop-government-using-facial-recognition-2019-2
The
article never mentions that California lost the drug war ---
http://www.sfexaminer.com/sfpd-efforts-fight-opioid-epidemic-question-police-net-dozens-arrests/
Police in San Francisco have seized more than 125
pounds of narcotics and $500,000 in drug money so far this year, the latest
numbers on police efforts to curb the opioid crisis show.
A targeted operation in the Tenderloin and South of
Market netted 62 drug arrests in a single week last month, Cmdr. David Lazar
said at the most recent Police Commission hearing last Wednesday.
Yet drug users continue to inject on city
sidewalks and the usual street corners remain open-air drug markets. Several
members of the Police Commission questioned the merits of the enforcement
efforts.
“We know that jail isn’t working,” Police
Commissioner Cindy Elias said at the hearing. “It’s very frustrating for
officers who see these people day in and day out, even if they arrest them
it’s not making a difference.”
Are the slums of San Francisco worse than
slums of India, Haiti, Africa? (Possibly because of drug addiction)
https://townhall.com/columnists/johnstossel/2019/02/07/slum-by-the-bay-n2540841?utm_source=thdaily&utm_medium=email&utm_campaign=nl&newsletterad=02/07/2019&bcid=b16c6f948f297f77432f990d4411617f&recip=17935167
San Francisco Health
Department: There are about 24,500 injection drug users in San Francisco —
that’s about 8,500 more people than the nearly 16,000 students enrolled in San
Francisco Unified School District’s 15 high schools ---
http://www.sfusd.edu/en/assets/sfusd-staff/about-SFUSD/files/sfusd-facts-at-a-glance.pdf
And most of those injection drug users are among the
hordes of homeless defecating in the streets
https://www.theguardian.com/commentisfree/2018/aug/18/san-francisco-poop-problem-inequality-homelessness
The
article laments housing shortages but never mentions that much of the problem is
due to rent control.
Here's what left-leaning Nobel Prize winner Paul Krugman says about rent control
---
https://www.nytimes.com/2000/06/07/opinion/reckonings-a-rent-affair.html
. . .
The analysis of rent control is among the
best-understood issues in all of economics, and -- among economists, anyway
-- one of the least controversial. In 1992 a poll of the American Economic
Association found 93 percent of its members agreeing that
''a ceiling on rents reduces the quality and quantity of housing.''
Almost every freshman-level textbook contains a case study on rent control,
using its known adverse side effects to illustrate the principles of supply
and demand. Sky-high rents on uncontrolled apartments, because desperate
renters have nowhere to go -- and the absence of new apartment construction,
despite those high rents, because landlords fear that controls will be
extended? Predictable. Bitter relations between tenants and landlords, with
an arms race between ever-more ingenious strategies to force tenants out --
what yesterday's article oddly described as ''free-market horror stories''
-- and constantly proliferating regulations designed to block those
strategies? Predictable.
And as for the way rent control sets people against
one another -- the executive director of San Francisco's Rent Stabilization
and Arbitration Board has remarked that ''there doesn't seem to be anyone in
this town who can trust anyone else in this town, including their own
grandparents'' -- that's predictable, too.
None of this says that ending rent control is an
easy decision. Still, surely it is worth knowing that the pathologies of San
Francisco's housing market are right out of the textbook, that they are
exactly what supply-and-demand analysis predicts.
But people literally don't want to know. A few
months ago, when a San Francisco official proposed a study of the city's
housing crisis, there was a firestorm of opposition from tenant-advocacy
groups. They argued that even to study the situation was a step on the road
to ending rent control -- and they may well have been right, because
studying the issue might lead to a recognition of the obvious.
So now you know why economists are useless: when
they actually do understand something, people don't want to hear about it.
Brookings: What does (new) economic evidence tell us about the effects of
rent control?
https://www.brookings.edu/research/what-does-economic-evidence-tell-us-about-the-effects-of-rent-control/
Jensen Comment
We have friends whose son is a San Francisco chef. Their son lives in a tiny,
tiny and poorly maintained rent-controlled apartment with his wife. The
apartment is very convenient for walking to their jobs. The claim is that they
decided that they would rather keep their apartment rather than have children in
a studio apartment or commute from outlying areas. If true, this illustrates an
externality of rent control.
The article above concluded with the following paragraph:
Rent control appears to help affordability in the
short run for current tenants, but in the long-run decreases affordability,
fuels gentrification, and creates negative externalities on the surrounding
neighborhood. These results highlight that forcing landlords to provide
insurance to tenants against rent increases can ultimately be
counterproductive. If society desires to
provide social insurance against rent increases, it may be less
distortionary to offer this subsidy in the form of a government subsidy or
tax credit. This would remove landlords’
incentives to decrease the housing supply and could provide households with
the insurance they desire. A point of future research would be to design an
optimal social insurance program to insure renters against large rent
increases.
Note that having private insurance to mitigate rent increases would have to
be taxpayer-funded insurance since it makes no economic sense to have it be
tenant-funded. Insurance covers unlikely happenings. Rent increases are pretty
much likely happenings in urban areas much like the fact that the only owners
needing flood insurance are those owners likely to be flooded. Hence, the
government has to fund flood insurance. Similarly the government would have to
fund rent increase insurance.
Why might the government fund rent increase insurance that transfers taxpayer
dollars to renters and landlords?
There's probably not a good argument for a couple in San Francisco earning
nearly $250,000 per year. But there may be reasons for helping teachers,
firefighters, police, and other civil servants making less than $150,000 per
year. But I would argue that this type of subsidy to such renters is unfair,
because it helps only those willing to live in small apartments and penalizes
their colleagues who must pay commuting expenses in order to have larger and
safer homes and better schools for families. It's better, in my opinion, to
subsidize the wages lower-income folks providing necessary services rather than
subsidize only those who choose to rent closer residences to their jobs.
Faced with a housing shortage and skyrocketing rents, Oregon is
poised to become the first state to impose mandatory rent controls, with a
measure establishing tenant protections moving swiftly through the Legislature
---
https://outline.com/ZjFACN
House Speaker Tina Kotek, a Democrat, said
30,000 housing units must be built per year to meet the state’s current
housing deficit and to build for the future as more people move to Oregon.
Jensen Comment
Is Tina Kotek the comedian of the day?
What's the incentive to build new rental units? What prospective landlords would
want to invest in long-term housing subject to rent control limits on revenue
and unrestrained risk on expenses?
Short-term returns may not sound too bad in this era of low interest rates, but
over the long-term you've got to be stupid to invest under these rent-controlled
restrictions.
One year in the future Oregon will at last legislate landlord incentives to
invest, but not today.
This is not the answer to providing shelter for the homeless, many of whom are
addicts and/or on welfare
**How to Mislead With Statistics (definitions, missing variables)
Harvard Study Concludes People Who Graduate During Recessions Earn Less Money —
but They’re Happier ---
https://hbr.org/2018/09/people-who-graduate-during-recessions-earn-less-money-but-theyre-happier?utm_medium=email&utm_source=newsletter_daily&utm_campaign=dailyalert_not_activesubs&referral=00563&deliveryName=DM14780
Jensen Comment
I think this study is limited to those that have jobs for which they aspired to
rather than those that are unemployed or have jobs beneath their aspirations
such as when an Ph.D. can only get a fast-food job or an adjunct teaching job
rather than a tenure-track position.
Secondly, recessions and booms are not binary events. No two recessions are
exactly alike in degree or in terms of impact degrees on labor sector varying
impacts in the economy. A study of workers in the 2008 recession may not apply
to workers in future recessions. Happiness varies over time such as when
increased numbers of student loan borrowers are increasingly stressed over loan
repayments. Its always tough to do statistical analysis on non-stationary
systems.
Also, I'm dubious of measures of "happiness." There are many unknown
variables when studying "happiness." Also people sometimes forget things when
asked about their "happiness." For example, some respondents may ignore that
they have to still live with parents when asked about their happiness in a
particular job.
**How to Mislead With Statistics (missing variables) ---
A simple technology could secure the border for a fraction of the cost of a wall
— but no one's talking about it
https://www.businessinsider.com/fiber-optic-sensing-technology-vs-border-wall-2019-2
Jensen Comment
The problem with buried fiber optic cables is that they really don't prevent
intruders from getting across the border. There was a recent enmass race amidst
tear gas canisters by caravan marchers for the border in San Diego. They knew
they would almost certainly get caught, but they were relying on the liberal
Ninth Circuit Court to eventually let them stay in the USA while, in the
meantime, the USA government by law is required to them shelter, food, medical
care, and safety. Or as is sometimes the case the Border Patrol simply turns
them loose in the USA. Of course is was still a gamble that both detained
intruders and released intruders will eventually be deported. But over 11
million known intruders are living in the USA.
Many of these racing marchers were instead turned back by fencing and tear
gas.
Hence all the favorable statistics for catching intruders once they have
crossed the border misses the point. Once across the border they get to stay for
weeks and months and maybe years and maybe forever. If stopped by a fence or
wall they are still in the Mexico --- which is where they don't want to stay
---
https://www.breitbart.com/border/2019/02/05/video-caravan-migrants-make-a-dash-for-unfenced-texas-border/
**How to Mislead With Statistics (bias, missing variables)
Billionaires (like progressives Howard Schultz and Mike Bloomberg) who hate
Alexandria Ocasio-Cortez's 70% tax on the superrich are adamant it will hurt the
USA economy — but history suggests otherwise (Yeah right) ---
https://www.businessinsider.com/alexandria-ocasio-cortez-70-percent-marginal-tax-fix-impact-on-economy-2019-2
Jensen Comment
What billionaires ever paid the highest marginal rates when they were 70%-90%
back in the 1960s?
When the rates were this high the Income Tax Code was so riddled with loopholes
for high income folks that none of them ever paid 70%-90% tax rates.
When Top
Rates Were So High: Do you really think Bing Crosby and Bob Hope paid 90
percent of their income to the taxman?
https://www.bloomberg.com/opinion/articles/2019-01-29/hollywood-stars-didn-t-pay-90-percent-tax-they-created-loopholes
Sweden unlike the USA did not have so many loopholes, but Sweden learned from
its mistakes and lowered the marginal rates.
Why did liberal
Sweden axe its wealth tax while at the same time lowering its top income tax
rate from 87% (1979) to 65% (1990) to 56% (2002)? ---
http://ftp.iza.org/dp11475.pdf
Elizabeth Warren would probably prefer that you do not
study experiences of all disastrous Scandinavian wealth taxes and very high
marginal income tax rates that were later greatly reduced to stimulate the
economy (called supply side (Laffer Curve) economics) ---
http://www.econlib.org/library/Enc/MarginalTaxRates.html
Larry Summers ---
https://en.wikipedia.org/wiki/Lawrence_Summers
Summers on the Wealth Tax ---
https://marginalrevolution.com/marginalrevolution/2019/10/summers-on-the-wealth-tax.html
Larry Summers is my favorite liberal economist
because even while maintaining his liberal values he never stops thinking
like an economist. That makes him suspect among the left but it means that
he is always worth listening to. The video below with Saez, Summers and
Mankiw (with Rampell moderating) is excellent throughout. I cribbed a number
of points from Summers:
“I have studied last week’s
twitter war very carefully and I have to say that I am 98.5% convinced by
the critics that the Zucman-Saez data are substantially inaccurate and
misleading.”
The arguments around political
power are not persuasive. Most of what is wrong with politics is because
that is what the people want (I’m filling in a bit here from comments
throughout). A wealth tax does nothing about corporate lobbying and would
increase the incentive to give to
political organizations. If you cut wealth at the top by 30% that wouldn’t
change relative political power in the slightest.
Wealth is up in large part
because interest rates are down which means that permanent income hasn’t
increased.
Forced savings programs like
social security and unemployment insurance mean that people at the bottom
need to save less and thus their wealth falls even as their welfare
increases.
A wealth tax increases the
incentive to consume instead of save and invest.
On employee stock ownership
plans: “When you put workers in control of firms and you give them
substantial control–see Israeli kibbutz’s, see Yugoslav cooperatives, see
universities where faculties have a powerful voice–the one thing you do
not get is expansion. You get more
for the people who are already there. That does not seem to be an attractive
position for progressives.”
In the Q&A Summers just goes to
town on Saez when Saez claims 90% tax rates are a great American invention.
“The people who were around in the Kennedy administration who were at least
as progressive as you are were united in the belief that 90% tax rates were
a bad idea….The number of people who paid those 90% tax rates was trivial
and it wasn’t because there weren’t a lot of rich people.” Greg Mankiw, who
gives a nice parable in his remarks, has to stifle a laugh as Summers lets
rip.
Also
see
https://mises.org/wire/problem-elizabeth-warren’s-wealth-tax-plan?utm_source=Mises+Institute+Subscriptions&utm_campaign=c9499c2e11-EMAIL_CAMPAIGN_9_21_2018_9_59_COPY_01&utm_medium=email&utm_term=0_8b52b2e1c0-c9499c2e11-228708937
**How to Mislead With Statistics bias, definitions)
Dividends and Buybacks ---
http://aswathdamodaran.blogspot.com/2019/02/january-2019-data-update-8-dividends.html
Jensen Comment
Not only should accounting students know how to account for dividends and
buybacks, they should know how the two ways of getting cash to shareholders are
different and yet related.
I like this article as a quick and easy way to teach students about this
complicated issue.
Most of the political articles on buybacks are misleading, and
voters are easily misled by those political articles.
This, like a lot of academic articles, falls among those articles that
politicians would like to hide from the public. That's not very hard to do since
voters are not much interested in our research and messaging.
**How to Mislead With Statistics (missing variables)
Cost of Living in America's Major Cities
https://247wallst.com/special-report/2019/01/23/cost-of-living-in-americas-major-cities/?utm_source=247WallStDailyNewsletter&utm_medium=email&utm_content=JAN242019a&utm_campaign=DailyNewsletter
Jensen Comment
The major deception here is not reporting standard deviations and skewness and
bifurcation of distributions. Manhattan and San Francisco are among the highest
cost of living cities in the USA? But for whom?
Both cities have rent controls such that people living in their rentals for
decades can actually live quite reasonably in Manhattan as opposed to newcomers
that get clobbered with enormously high rents. My point here is that when you
are talking about cost of living the question is cost
of living for whom?
This partly explains why the median incomes reported on Column 4 are so
confusing. For example the median income for Manhattan is $69,211 whereas for
Oakland its $85,947. And yet housing costs in Manhattan are reported as being
four times higher than in Oakland. Why can half the people who live in Manhattan
afford to live in Manhattan while it might actually be more expensive to rent
housing in Oakland? The answer in part is rent control for those people earning
less than $69,211 in Manhattan. I don't think Oakland has rent controls, but I
could be wrong about this. I know San Francisco has rent controls.
There are also other things to consider such as K-12 public education. Public
schools in San Francisco are quite good such that many residents do not have to
factor in private school expenses for their children in San Francisco relative
to most other cities on the list such as New Orleans and Oakland and St. Louis
and Chicago that have scary public schools.
Probably the most deceptive thing about this article is the difficulty of
factoring in the impact of the suburbs surrounding a major city. Suburbs vary in
terms of cost of living, school quality, and other factors such as large yards
versus no yards. People working in San Francisco move to Oakland for lower
housing costs. People in New York move to Westchester for better public schools.
For example, in her 60-Minutes interview Alexandria Ocasio-Cortez reports
that her parents moved to nearby Westchester just so she could enroll in better
public schools. In other words her parents traded lower cost of living for
higher cost of living to get better public schools for her. People working in
San Francisco and living in Oakland trade off school quality for lower cost of
living.
I could go on and on here. For example, in addition to public school quality
differences there's the element of safety and crime. San Antonio appears to be a
relatively low cost of living city. And yet many people in San Antonio live in
expensive gated-neighborhoods in large part to be less fearful of burglaries and
home invasions. In other words, the cost of living safer in San Antonio may be
more expensive than the cost of living in a non-gated neighborhood in San
Antonio or in one of its higher cost suburbs like New Braunfels. My point here
is that the low cost of living for San Antonio reported in the above article is
not really reflective of what it costs many people to live inside the city
limits of San Antonio.
**How to Mislead With Statistics (missing variables) ---
A simple technology could secure the border for a fraction of the cost of a wall
— but no one's talking about it
https://www.businessinsider.com/fiber-optic-sensing-technology-vs-border-wall-2019-2
Jensen Comment
The problem with buried fiber optic cables is that they really don't prevent
intruders from getting across the border. There was a recent enmass race amidst
tear gas canisters by caravan marchers for the border in San Diego. They knew
they would almost certainly get caught, but they were relying on the liberal
Ninth Circuit Court to eventually let them stay in the USA while, in the
meantime, the USA government by law is required to them shelter, food, medical
care, and safety. Or as is sometimes the case the Border Patrol simply turns
them loose in the USA. Of course is was still a gamble that both detained
intruders and released intruders will eventually be deported. But over 11
million known intruders are living in the USA.
Many of these racing marchers were instead turned back by fencing and tear
gas.
Hence all the favorable statistics for catching intruders once they have
crossed the border misses the point. Once across the border they get to stay for
weeks and months and maybe years and maybe forever. If stopped by a fence or
wall they are still in the Mexico --- which is where they don't want to stay
---
https://www.breitbart.com/border/2019/02/05/video-caravan-migrants-make-a-dash-for-unfenced-texas-border/
**How to Mislead With Statistics (missing variables)
Cost of Living in America's Major Cities
https://247wallst.com/special-report/2019/01/23/cost-of-living-in-americas-major-cities/?utm_source=247WallStDailyNewsletter&utm_medium=email&utm_content=JAN242019a&utm_campaign=DailyNewsletter
Jensen Comment
The major deception here is not reporting standard deviations and skewness and
bifurcation of distributions. Manhattan and San Francisco are among the highest
cost of living cities in the USA? But for whom?
Both cities have rent controls such that people living in their rentals for
decades can actually live quite reasonably in Manhattan as opposed to newcomers
that get clobbered with enormously high rents. My point here is that when you
are talking about cost of living the question is cost
of living for whom?
This partly explains why the median incomes reported on Column 4 are so
confusing. For example the median income for Manhattan is $69,211 whereas for
Oakland its $85,947. And yet housing costs in Manhattan are reported as being
four times higher than in Oakland. Why can half the people who live in Manhattan
afford to live in Manhattan while it might actually be more expensive to rent
housing in Oakland? The answer in part is rent control for those people earning
less than $69,211 in Manhattan. I don't think Oakland has rent controls, but I
could be wrong about this. I know San Francisco has rent controls.
There are also other things to consider such as K-12 public education. Public
schools in San Francisco are quite good such that many residents do not have to
factor in private school expenses for their children in San Francisco relative
to most other cities on the list such as New Orleans and Oakland and St. Louis
and Chicago that have scary public schools.
Probably the most deceptive thing about this article is the difficulty of
factoring in the impact of the suburbs surrounding a major city. Suburbs vary in
terms of cost of living, school quality, and other factors such as large yards
versus no yards. People working in San Francisco move to Oakland for lower
housing costs. People in New York move to Westchester for better public schools.
For example, in her 60-Minutes interview Alexandria Ocasio-Cortez reports
that her parents moved to nearby Westchester just so she could enroll in better
public schools. In other words her parents traded lower cost of living for
higher cost of living to get better public schools for her. People working in
San Francisco and living in Oakland trade off school quality for lower cost of
living.
I could go on and on here. For example, in addition to public school quality
differences there's the element of safety and crime. San Antonio appears to be a
relatively low cost of living city. And yet many people in San Antonio live in
expensive gated-neighborhoods in large part to be less fearful of burglaries and
home invasions. In other words, the cost of living safer in San Antonio may be
more expensive than the cost of living in a non-gated neighborhood in San
Antonio or in one of its higher cost suburbs like New Braunfels. My point here
is that the low cost of living for San Antonio reported in the above article is
not really reflective of what it costs many people to live inside the city
limits of San Antonio.
**How to mislead with statistics (bias, missing variables)
It's cheaper to enroll people in Medicaid than to subsidize their private
insurance ---
Scroll down at
http://ritholtz.com/2018/08/10-sunday-reads-126/
Jensen Comment
This graph is misleading because it only looks at the short-term annual expense.
Subsidizing private insurance only covers short-term medical expense annually
and does not cover long-term nursing care. The two-ton guerilla is the excluded
Medicaid coverage of long-term nursing care that even Medicare won't cover. This
also is misleading in that private insurance might cover treatments by doctors
and hospitals that will not treat Medicaid patients.
**How to Mislead With Statistics (missing variables) (bias)
MIT’s (mostly with Stanford researchers) Uber study couldn’t possibly have been
right. It was still important ---
https://qz.com/1222744/mits-uber-study-couldnt-possibly-have-been-right-it-was-still-important/
Jensen Comment
The study appears to have been sloppy and unprofessional rather than
intentionally misleading even though it serves the liberal agenda.
The obvious question overlooked is why so many workers
volunteer for Uber when there are many opportunities for earning more than $3.37
per hour in this economy where help wanted signs are posted in front of nearly
all establishments?
Didn't the researchers think about that? The article points out some other
things these researchers overlooked.
The quote at the end of the article is a hoot:
Yes, $3.37 an hour was a crazy number. But when people are primed to believe
that driving for Uber is a crappy job, then you better bet they are going to
believe a prestigious academic study that comes along telling them exactly
that.
If you do a Google search most of the media (which tends to be
liberal) thinks the $3.37 is absolute fact. Abe Lincoln said it best:
"You can fool all the people some of the time, and some of the people all of the
time, but not . . . "
I'm not sure it takes such powerful cost accounting math as much
as it takes common sense. For example, depreciation of a car is a decline in
value that combines four important variables: Make versus Mileage versus Age
versus temporal Non-stationary Market prices and Variance in prices. No powerful
math can disentangle those confounded variables in spite of what Einstein wished
was the case. And the confounding varies with locale. For example, road salt in
New Hampshire increases the importance of Mileage relative to Age and Make such
that New Hampshire Uber drivers probably get hit harder than Arizona drivers,
but nobody can accurately measure the effect of salt in a particular car (that
differs from an average car). Other factors intervene such as how often the car
is washed and what is paid for the wash.
And even things like gas prices vary greatly from Texas to
Maryland to California.
And tips vary a lot with customers and conditions such as any
Uber driver tomorrow morning in New Hampshire will likely get a bigger tip
during a Nor'easter.
Thus its not the power of the math as much as it is the lack of
data for millions of variations in non-stationarities of the variables in a
given Uber trip.
**How to Mislead With Statistics (missing variables) (rankings)
The Best and Worst States for Business
https://247wallst.com/special-report/2018/02/28/the-best-and-worst-states-for-business-5/?utm_source=247WallStDailyNewsletter&utm_medium=email&utm_content=MARCH012018A&utm_campaign=DailyNewsletter
Jensen Comment
This is misleading because there are so many criteria and ways to weight these
criteria in terms of importance. For example, low population states are poor
business choices for franchise retail stores and food chains because demand is
so low in states that only do not have large cities (think Wyoming, Vermont, New
Hampshire, and Alaska). Similarly low population states have limited labor
supplies, especially for skilled labor. For firms not dependent upon the local
areas for customers these states can have other attractions such as fewer
business regulations and low taxes. South Dakota attracts credit card companies
because of the regulatory climate. This is not such an attraction for automobile
companies seeking to build new factories.
In the above rankings Massachusetts is ranked in top place. Massachusetts is
attractive for firms wanting skilled labor and nearness to top universities.
Massachusetts is also known in New England as Taxaachusetts because it taxes
everything in sight.
New Hampshire ranks pretty high in terms of low taxes, low housing costs,
schools, and living environment and yet New Hampshire does not provide much
competition for companies seeking skilled workers, low energy costs, and funding
deals like those offered in New York. New Hampshire has no sales tax or general
income tax, but its business taxes and property taxes are relatively high.
One criterion in the above is working age population change 2010-2020. But
this is a percentage index that suffers from denominator effects that make low
worker population in 2010 attractive.
The bottom line is that business climate is in the eye
of the beholder. Every state has some attractions and some detractions.
States with the most detractions (think highly taxed California with its soaring
living costs and business regulations) also have some important attractions that
include climate, labor market, large cities, and a huge coastline with busy
shipping ports.
California's Senator Kamala Harris ---
https://en.wikipedia.org/wiki/Kamala_Harris
**How to Mislead With Statistics (missing variables)
Presidential Candidate Kamala Harris Promises Basic
Income for All: Every person in the USA
should file a tax return --- it's like Filing for Dollars where more than 80%
of the people in the USA win extra cash--
https://www.harris.senate.gov/news/press-releases/harris-proposes-bold-relief-for-families-amid-rising-costs-of-living
Jensen Comment
The missing variable here is how to pay for her "unlimited" spending programs.
Senator Harris promises refundable "tax credits" to Americans who make less than
$100,000 --- those taxpayers who currently only pay 20% of of the USA's income
taxes. People making over $100,000 pay 80% of the nation's income taxes.
Nearly half of all people filing income tax returns
currently pay zero income taxes. Many more don't currently file
tax returns at all such as children in college and folks working in the tax-free
$2 trillion underground economy ---
https://www.forbes.com/sites/kellyphillipserb/2016/05/13/americans-who-make-more-than-100000-pay-80-of-federal-income-taxes/#669a5e3c3ff4
Under her proposal more than 80% of the people in the USA could
receive a basic tax-free income. Every person should
file a tax return --- it's like Filing for Dollars.
This is not the negative income tax that Milton Friedman once
proposed. Friedman wanted to replace the safety nets (Medicaid, welfare, food
stamps, housing subsidies, etc.) with a negative income tax. Kamala's basic
income proposal, however, gives cash back in addition to increasing all safety
nets with her added proposal for rent relief ---
https://reason.com/blog/2018/07/20/new-kamala-harris-bill-asks-federal-taxp
Also, those that are able can work tax free in the $2 trillion underground
economy for added cash.
In addition she proposes no
spending limits on the green initiative plus free health care, student loan
forgiveness, free college, and cash reparations to African and Native Americans.
All told she's promising social and environmental spending of over $100 trillion
or much more ---
https://www.foxnews.com/politics/kamala-harris-dismisses-concerns-about-green-new-deal-price-tag-its-not-about-a-cost
She's promising unlimited government spending to be assured of winning the USA
presidency. It just might work since most
millennials don't have clue about economics!
The missing variable here is how to pay for her "unlimited"
spending programs. The math just doesn't work out even if we tax 100% of the
income of high earners. Remember that existing entitlements for Medicaid,
Medicare, Social Security, Aid for Disable Persons, etc. add another $100+
trillion.
A hundred trillion here and a hundred trillion there ---
pretty soon were talking Venezuela or Zimbabwe.
Where's Paul Krugman when we need him most?
Kamala Harris announces $100B plan for black home ownership,
tackling racial wealth gap ---
https://www.blabber.buzz/conservative-news/609928-kamala-harris-announces-100b-plan-for-black-home-ownership-tackling-racial-wealth-gap-special?utm_source=c-alrt&utm_medium=c-alrt-email&utm_term=c-alrt-GI
Giving them free health care, free medications, guaranteed annual income,
reparations awards, free food, and lower standards for college graduation just
isn't enough. The bounty for being black just keeps piling on.
“You have to make decisions that you’re going
to reach certain goals, and some of our goals we think are achievable”
Nancy Pelosi (when criticizing Alexandria's Green New Deal and
Basic (Guaranteed) Income
Click Here
**How to Mislead With Statistics
The COVID Panic Is a Lesson in Using Statistics to Get
Your Way in Politics ---
https://mises.org/wire/covid-panic-lesson-using-statistics-get-your-way-politics?utm_source=Mises+Institute+Subscriptions&utm_campaign=e9c5c5695a-EMAIL_CAMPAIGN_9_21_2018_9_59_COPY_01&utm_medium=email&utm_term=0_8b52b2e1c0-e9c5c5695a-228708937
Jensen Comment
One of my favorite examples is the media's use of Sweden's relatively high
Covid-19 death rate (that's lower than that of the Belgium, the UK, and various
other EU nations) as a glaring example of what happens when you don't have a
national lockdown. Evidence seems to be mounting that Sweden's high death rate
comes more from a glaring failure to protect its most vulnerable citizens,
especially the elderly. Had Sweden done this aggressively early on in March the
case the media might have had less of a case against the Swedish failure to lock
down. Of course we'll never know in hind sight since national death rates from
Corona-19 are so varied and complicated and the data are so inaccurate.
Please don't take this tidbit
as a suggestion that locking down is not important for most (all?) nations.
**How to Mislead With Statistics
Corona19 Death Rates ---
https://www.factcheck.org/2020/05/where-the-u-s-ranks-in-covid-19-deaths-per-capita/
President Trump claimed the USA had one of the lowest death rates.
Chris Wallace Claimed the USA has had the seventh highest death rate ---
https://townhall.com/tipsheet/guybenson/2020/07/20/fact-check-president-trump-vs-chris-wallace-on-coronavirus-death-rates-defunding-the-police-n2572736
Both are wrong. Out of 144 nations the USA comes in at Rank 32
with most European nations having higher
death rates. Austria and Norway had death rates lower than the USA.
Averages (for some nations are more misleading than others). For example, the
Netherlands has a relatively dense population across the entire country. Its
death rate has a low standard deviation relative to the USA. In comparison, the
USA has a relatively disperse nation with populations concentrated in some large
cities in in some states and other states that are relatively low in population.
Among other things population density contributes to higher death rates (but
there are exceptions for other interactive factors like age of the state
populations, number of people commuting by subways and trains, etc.).
Corona-19 Death Rates Per 10,000 Cases
Accumulated Data as of July 19, 2020
Since accuracy of reported data is
so suspect in the majority of nations, it's misleading to compare number of
cases and number of deaths by nation.
Having said this I will report the following in any case because it's
consistent with the Johns Hopkins Data
Coronavirus (COVID-19) death rate in countries with confirmed deaths and
over 1,000 reported cases as of July 17, 2020, by country ---
https://www.statista.com/statistics/1105914/coronavirus-death-rates-worldwide/
|
Yemen |
Confirmed
Cases
1,552 |
Number of
Deaths
438 |
Death
Rate %
28.22 |
|
Belgium |
63,238 |
9,795 |
15.49 |
|
United Kingdom |
292,552 |
45,119 |
15.42 |
|
France |
200,929 |
30,049 |
14.96 |
|
Italy |
243,736 |
35,017 |
14.37 |
|
Hungary |
4,279 |
595 |
13.91 |
|
Netherlands |
51,351 |
6,137 |
11.95 |
|
Mexico |
324,041 |
37,574 |
11.6 |
|
Spain |
258,855 |
28,416 |
10.98 |
|
Canada |
111,144 |
8,875 |
7.99 |
|
Ecuador |
71,365 |
5,207 |
7.30 |
|
Sweden |
76,877 |
5,593 |
7.28 |
|
Ireland |
25,698 |
1,749 |
6.81 |
| |
|
Liberia |
1,070 |
68 |
6.36 |
|
Sudan |
10,527 |
668 |
6.35 |
|
Niger |
1,102 |
69 |
6.26 |
|
Switzerland |
33,290 |
1,969 |
5.91 |
|
Slovenia |
1,897 |
111 |
5.85 |
|
Romania |
35,003 |
1,971 |
5.63 |
|
China |
85,314 |
4,644 |
5.44 |
|
Burkina Faso |
1,038 |
53 |
5.11 |
|
Iran |
267,061 |
13,608 |
5.10 |
|
North Macedonia |
8,623 |
401 |
4.65 |
|
Denmark |
13,124 |
610 |
465 |
|
Germany |
201,450 |
9,087 |
4.50 |
|
Finland |
7,293 |
328 |
4.25 |
|
Guatemala |
32,939 |
1,404 |
4.26 |
|
Lithuania |
1,902 |
79 |
4.15 |
|
Japan |
23,833 |
985 |
4.13 |
|
Poland |
39,054 |
1,605 |
4.11 |
|
Iraq |
86,148 |
3,532 |
4.09 |
|
USA |
3,565,256 |
138,174 |
3.88 |
|
Sierra Leone |
1,678 |
64 |
3.81 |
|
Brazil |
2,012,151 |
76,688 |
3.81 |
|
Followed by 112 other nations |
|
|
|
|
Accuracy varies greatly |
**How to Mislead With Statistics
Surprising study: Urban density doesn’t cause more COVID-19 infections, even
promotes lower death rates ---
https://www.studyfinds.org/surprising-study-urban-density-doesnt-cause-more-covid-19-infections-even-promotes-lower-death-rates/
Crowded city streets, subways, and buses have been
considered the most likely places to become infected with COVID-19 over the
past few months. Surprisingly, however, a new study from the Johns Hopkins
Bloomberg School of Public Health concludes that densely populated spaces
aren’t actually linked to higher infection
rates.
Even more confounding, the study’s
analysis indicates that crowded, dense locations are associated with lower coronavirus death
rates.
In all, COVID-19 infection and death rates were
assessed across 913 U.S. metropolitan counties. After researchers accounted
for additional factors like race and education, the population density
within each county was not significantly linked to infection rates. As
mentioned, denser counties, as opposed to more rural, sprawling
areas with smaller populations, were associated with lower death rates. The
study’s authors speculate this is because denser, urban areas often offer
better healthcare services.
Instead, higher
coronavirus infection and death rates seem to be linked to a metropolitan
area’s size,
not its density. So, cities that are
very big and stretch across multiple counties that are “tightly linked
together through economic, social, and commuting relationships” appear to be most
at risk of
high coronavirus infection rates
Continued in Article
Jensen Comment
I think the populated density issues are more complicated than density per se
(think population per square mile). For example, the above study concludes that "densely
populated spaces aren’t actually linked to higher infection
rates". However,
I contend that the most dense populations vary greatly in terms of lifestyles.
Los Angeles differs greatly from New York City in many ways, including the LA's
relative lack of public transportation relative to NYC. Also in NCC it's
extremely common for workers to move out of NYC when they retire. And if they
retire in a another dense area like Miami or LA their lifestyles change because
they are no longer commuting daily over long distances by public transportation
to get to and from jobs. The public indoor places of Manhattan and San Francisco
are crowded many hours of each day relative to the public indoor places of
Miami, LA, and Houston.
My point here is that population density as a predictor of Covid-19 infections
and deaths confounds many other issues like demographic differences of
residents, lifestyle differences, etc. But
density should not be eliminated as a contributing factor to the multivariate
set of interactive causes.
Both the risks of infection from Covid-19 and the risk of dying when infected
are multivariate and interactive.
Except for age I don't think we can factor out any one variable (like population
per square mile) from all the other interactive causes.
And density is a continuum. Southern New Hampshire is much less densely
populated than Northern New Hampshire. And Southern New Hampshire is very much
less densely populated than New York City.
New York State has a population of 19.5 million out of which over 8.2 million
live in NYC. New Hampshire has a population of 1.4 million out of which 110,000
live in Manchester, NH.
As a retired total recluse living on food and drink ordered from Amazon, your
odds of testing positive for Covid-10 are probably about the same in NYC or New
Hampshire's Manchester or Littleton in the north. If
you're a patrol cop or hospital worker your probability of testing positive is
much higher in dense NYC or Manchester. However your probability is even lower
in Littleton relative to Manchester and points along I-93 leading toward
Massachusetts.
Now consider the following map of New Hampshire where the state's highest
population density is skewed toward the southern part of the state ---
https://www.nh.gov/covid19/
Note that "50+" in the color
coding includes such large numbers as 500 and 800.
In the middle of New Hampshire my guess is that nursing home residents
contributed to nearly all of the 6, 7, AND 16 numbers shown on the map below.
I contend that the Covid-19 infection rates along the southeastern boundary are
relatively high because this is where NH workers commuting to Massachusetts
(think Boston) are most likely to live in NH. These NH state line residents most
likely were infected due to working in Massachusetts (think NH medical
professionals who work in Massachusetts hospitals)
Contrary to the conclusion of
the above "Surprising Study," the one thing I'm certain of is that people who
move from New York City to northern New Hampshire at the present time ipso
facto have lower probabilities of becoming infected unless they live like a
recluses before and after the move.
**How to Mislead With Statistics (missing variables)
Why Americans Are Proud To Pay Taxes (presented at NYU on February 15, 2018)---
http://taxprof.typepad.com/taxprof_blog/2018/02/williamson-presents-why-americans-are-proud-to-pay-taxes-today-at-nyu.html
Conventional wisdom
holds that Americans hate taxes. But the conventional wisdom is wrong.
Bringing together national survey data with in-depth interviews, Read
My Lips presents
a surprising picture of tax attitudes in the United States. Vanessa
Williamson demonstrates that Americans view taxpaying as a civic
responsibility and a moral obligation. But they worry that others are
shirking their duties, in part because the experience of taxpaying misleads
Americans about who pays taxes and how much. Perceived "loopholes" convince
many income tax filers that a flat tax might actually raise taxes on the
rich, and the relative invisibility of the sales and payroll taxes
encourages many to underestimate the sizable tax contributions made by poor
and working people.
Americans
see being a taxpayer as a role worthy of pride and respect, a sign that one
is a contributing member of the community and the nation. For this reason,
the belief that many Americans are not paying their share is deeply
corrosive to the social fabric.
The widespread misperception that immigrants, the poor, and working-class
families pay little or no taxes substantially reduces public support for
progressive spending programs and undercuts the political standing of
low-income people. At the same time, the belief that the wealthy pay less
than their share diminishes confidence that the political process represents
most people.
Upending the idea of Americans as knee-jerk
opponents of taxes, Read
My Lips examines American
taxpaying as an act of political faith. Ironically, the depth of the
American civic commitment to taxpaying makes the failures of the tax system,
perceived and real, especially potent frustrations
Continued in article
Jensen Comment
NYU is a left-leaning university in New York that teaches tax loopholes. It
makes me wonder why in the very shadow of NYU those civic-minded taxpayers are
doing their best to avoid or defer income taxes.
Firstly, the high income folks on Wall Street and
most other parts of New York probably spend more for NY tax lawyers and NY
accounting firms to minimize their taxes and take advantage of every loophole in
the Federal and NY State tax code. At the moment New York's governor is leading
the charge to re-write the state's income tax code to provide loopholes for tax
avoidance of the forthcoming revisions of the Federal tax code.
Secondly, across the USA, nearly half the persons
who file tax returns owe zero income taxes and are simply filing for their
refunds or even their added cash from the earned income tax credit. Yes they pay
payroll taxes but in return they eventually want those to come back in the form
of Social Security and Medicare.
Thirdly, the $2 trillion tax avoiding underground economy is
enormous in the USA, especially among undocumented immigrants.
Case Studies in Gaming the Income Tax Laws
http://www.cs.trinity.edu/~rjensen/temp/TaxNoTax.htm
**How to
Mislead With Statistics
(missing variables) (rankings)
Best and Worst States for Business --- one more time
https://247wallst.com/special-report/2019/02/21/best-and-worst-states-for-business/?utm_source=247WallStDailyNewsletter&utm_medium=email&utm_content=FEB222019a&utm_campaign=DailyNewsletter
Jensen
Comment
This is an example of the many misleading rankings where there are so many
variables and situations that any ranking can be misleading. For example, when
it comes to locating a business in the USA the many variables to consider
include state taxation of business, state taxation of employees, availability of
skilled and unskilled employees, housing costs and availability, quality of
public schools, labor union militancy, access to raw materials, access to
customers, litigation risks peculiar to a state, transportation costs, and on
and on and on.
For
example, the top-ranked state in this study is Massachusetts. There are many
reasons to for some businesses to locate in Massachusetts such as the main
reason given by GE to move its headquarters to Boston was the access to such
outstanding research universities such as Harvard, MIT, and many others.
Massachusetts also has an ocean coast with seaports. However, there are also
many drawbacks to Massachusetts such as the reason it's called Taxachusetts in
New England. It's also one of the worst states in terms of its debt management
and labor union militancy. Boston will not even allow non-union businesses like
Walmart. Boston does not rank high in terms of public transportation (think
subways) and has notorious traffic jams. Massachusetts is in the upper east
corner of the USA is a long distance from some raw materials like (like Midwest
grain) and customers. It would be stupid for Tesla to build a second car
factory in Massachusetts, although there are other negatives such as Tesla's
abhorrence of labor unions. To top it off, Massachusetts has a lousy climate ---
http://faculty.trinity.edu/rjensen/Tidbits/Snow/Set07/SnowSet07.htm
In this
study the worst ranked city for business is Louisiana. There are many reasons
for this, including a lousy (hot and humid) climate, lousy public schools and
shortage of skilled labor. But there are many reasons in favor of Louisiana such
as the reason so much grain is exported to the world out of the end of the
Mississippi River. There are many other reasons why businesses might choose
Louisiana over Massachusetts ---
https://www.opportunitylouisiana.com/docs/default-source/eq-articles/2015/eq_q4_2014.pdf?sfvrsn=2
My
point here is that ranking states according to "business opportunity" or
colleges according to "education opportunity" is more misleading than helpful
due to so many variables to consider and weight when doing such rankings. The
results are garbage rankings. If you want to rank states or colleges limit the
number of variables and be absolutely clear as the weightings of those
variables.
**How to mislead with statistics (missing variables)
The Atlantic: As younger generations become more racially diverse, many states
are allocating fewer tax dollars to public colleges and universities ---
https://www.theatlantic.com/politics/archive/2018/05/american-higher-education-hits-a-dangerous-milestone/559457/
Jensen Comment
The article misleadingly overlooks the major causes of reduced spending for
higher education.
Soaring Medicaid expenses have become the biggest expenditure items in most
state budgets, expenditures that cannot be as easily reduced as expenditures for
higher education. Couple Medicaid with underfunded pensions for state workers
and we see funding for higher education being left in political dust.
By way of illustration look at the Medi-Cal portion ($101.5 billion) of the
2018-19 pie chart for California at
http://www.ebudget.ca.gov/2018-19/pdf/BudgetSummary/HealthandHumanServices.pdf
For California the higher education budget for 2018-19 is proposed at $33.7
billion in comparison ---
http://www.ebudget.ca.gov/2018-19/pdf/BudgetSummary/HigherEducation.pdf
Click on "States" in the upper left corner to see states grading as to fiscal
responsibility and debt crises ---
https://www.statedatalab.org/
In other words the "radical diversity" issue is not so much a cause of
reduced support higher education as is a budgeting choice issue devoting the
lion's share of state budgets to health and welfare, especially Medicaid. And a
major cause of the increase in Medicaid spending is the way citizens are
figuring out how to divert long-term assisted living and nursing home expenses
to Medicaid. If families plan ahead more than five years in advance, they can
funnel more of their parents and grandparents resources into their own pockets
and shift the long-term nursing care expenses over to Medicaid. And then they
complain that the states are paying less for their children's state-supported
higher education.
Medicare and Medicaid were never intended by government to pay for so much
long-term nursing care of the middle class, but by one means or another schemes
have been devised to make long-term nursing care and the cost of dying for the
middle class as well as the poor. Medicaid is picking up a larger share of
long-term nursing costs and Medicare is picking up the cost of dying
(hospital, medication, and doctor bills).. The cost of
dying became the largest budget item in Medicare and is exploding as the
population of the USA ages. This is also the major cause, along with underfunded
pensions, of funds being diverted by states from
higher education to Medicaid.
The bottom line is that as the population ages we're seeing a
massive shift in state (and Federal) spending from
the young to the old as education money is
massively being diverted to Medicaid (and Medicare).
**How to Mislead With Statistics (missing variables)
In countries with high migrant acceptance indexes —
that is, countries where the populace is generally receptive to newcomers —
immigrants “are happier than their other circumstances would indicate
---
https://www.nytimes.com/2018/03/14/world/europe/worlds-happiest-countries.html?em_pos=medium&emc=edit_el_20180316&nl=at-times&nl_art=1&nlid=10527319&ref=headline&te=1
Jensen Comment
What the author (Maggie Astor) implies is that countries with high migrant
acceptance indexes are also the happiest countries. That is just not the case.
The countries that are ranked as happiest (think Finland, Norway, and Denmark)
are not leaders in migrant acceptance indexes. In fact, Finland is noted for
rerouting migrants into Sweden. Sweden is fed up with the lawless gangs of
migrants in the no-go zones where the police are afraid to enter. Now all the
Nordick countries are refusing citizenship to ever more migrants and paying them
to return to their home countries.
Least- and Most-Accepting Countries for Migrants
http://news.gallup.com/poll/216377/new-index-shows-least-accepting-countries-migrants.aspx
| |
Least accepting of migrants |
Most accepting of migrants |
| |
|
|
|
|
| |
Macedonia |
1.47 |
Iceland |
8.26 |
| |
Montenegro |
1.63 |
New Zealand |
8.25 |
| |
Hungary |
1.69 |
Rwanda |
8.16 |
| |
Serbia |
1.80 |
Sierra Leone |
8.05 |
| |
Slovakia |
1.83 |
Mali |
8.03 |
| |
Israel |
1.87 |
Australia |
7.98 |
| |
Latvia |
2.04 |
Sweden |
7.92 |
| |
Czech Republic |
2.26 |
Nigeria |
7.76 |
| |
Estonia |
2.37 |
Burkina Faso |
7.74 |
| |
Croatia |
2.39 |
Ireland |
7.74 |
Note that the happiest nations of Finland, Norway, and Denmark are not on the
list, and Sweden is now regretting accepting so many migrants. Iceland is quite
"accepting" of the very few migrants it accepts and does not offer much in the
way of economic opportunity to migrants. Iceland historically has a high rate of
emigration (citizens leaving) especially into Canada ---
https://en.wikipedia.org/wiki/Demographics_of_Iceland
It would seem that Iceland is not fond of inviting migrants from Africa, Latin
America, South America, India, and the Middle East.
**How to Mislead With Statistics (missing variables)
Analysis: Bernie Sanders' $32 trillion Medicare-for-all plan is actually kind of
a bargain ---
https://www.msn.com/en-us/money/healthcare/analysis-bernie-sanders-dollar32-trillion-medicare-for-all-plan-is-actually-kind-of-a-bargain/ar-BBLhnEu?ocid=spartandhp
Jensen Comment
There are so many confounding variables that it's misleading to call Bernie's
proposed national health care plan a "bargain." First there's an enormous
problem are defining what health services are under the national plan and how
these have been factored into the claim that its a "bargain." For example, will
all citizens and people who cheat (illegal immigrants and legal immigrants on
work permits) be entitled very costly organ transplants (including heart
transplants), very costly medications, timely joint transplants (think knees and
hips), and long-term nursing care. At the moment only Medicaid recipients are
eligible for free long-term nursing care. When there is no Medicaid will
everybody be to free long-term nursing care.
Does Bernie's plan include euthanasia programs in the same way some other
nations greatly save on the cost of dying patients on their national health care
plans?
https://en.wikipedia.org/wiki/Euthanasia
On November 22, 2009 CBS Sixty Minutes aired a video
featuring experts (including physicians) explaining how the single largest drain
on the Medicare insurance fund is keeping dying people hopelessly alive who
could otherwise be allowed to die quicker and painlessly without artificially
prolonging life on ICU machines.
"The Cost of Dying," CBS Sixty Minutes Video, November 22, 2009
---
http://www.cbsnews.com/news/the-cost-of-dying-end-of-life-care/
Given that it's impossible to raise all the $32 trillion by added taxes to
the upper income people how much will the lower income people be required to
contribute to their medical services? For example, at present nearly half the
people who file income tax returns pay zero income taxes. Do the half paying
zero income taxes continue to pay zero income taxes when they have a national
health care plan?
Some liberals argue that we can pay for much more by nearly eliminating the
military budget. Are they aware that most of the military budget goes toward
paying pensions of retired military and the cost of VA military services that
will presumably added to the national health care plans in a big way? If you
eliminate the entire fighting force, the military budget will remain a huge
component of the long-term federal budget.
How much of a "bargain" will the national health care plan be after we build
a giant bureaucracy to administer the national health care program from coast to
coast.
Bernie argues that medical costs of physicians and medications will be
greatly reduced by government controls on prices. What about the almost certain
cost of shortages that will ensue such as the shortage of physicians (think
surgeons) in nations like Canada and the U.K.? What's the incentive to spend
many years becoming a highly specialized physician when you could become a
multi-millionaire in a short time by specializing in tech skills.
Many nations that have national health care plans only cover basics, and
private insurance is necessary for higher quality medical services. Exhibit A is
the German national health care plan. In part this is due to the need to pay the
best physicians higher fees in order to have them endure the long and difficult
road to becoming the best physicians.
Bernie never mentions that most nations with health care plans are having
great troubles financing those plans without greatly reducing the quality of
health care plans. Bernie fails to mention that most of the nations with
national health care plans have relatively low military budgets. The U.K for
years was an exception, but now the U.K. is spending less and less on the
military to where calling it a formidable military is a joke. The once mighty
French navy is down to one aircraft carrier. The U.K. has two ---
https://www.popularmechanics.com/military/navy-ships/g2412/a-global-roundup-of-aircraft-carriers/
One key difference is that the
U.K. has shrunk its military down to about 5% of the budget whereas the USA is
hanging in at around 16% of a much larger federal budget ---
https://en.wikipedia.org/wiki/Military_budget_of_the_United_States
Also see
https://en.wikipedia.org/wiki/March_2017_United_Kingdom_budget
**How to mislead with statistics (missing variables)
The Atlantic: As younger generations become more racially diverse, many states
are allocating fewer tax dollars to public colleges and universities ---
https://www.theatlantic.com/politics/archive/2018/05/american-higher-education-hits-a-dangerous-milestone/559457/
Jensen Comment
The article misleadingly overlooks the major causes of reduced spending for
higher education.
Soaring Medicaid expenses have become the biggest expenditure items in most
state budgets, expenditures that cannot be as easily reduced as expenditures for
higher education. Couple Medicaid with underfunded pensions for state workers
and we see funding for higher education being left in political dust.
By way of illustration look at the Medi-Cal portion ($101.5 billion) of the
2018-19 pie chart for California at
http://www.ebudget.ca.gov/2018-19/pdf/BudgetSummary/HealthandHumanServices.pdf
For California the higher education budget for 2018-19 is proposed at $33.7
billion in comparison ---
http://www.ebudget.ca.gov/2018-19/pdf/BudgetSummary/HigherEducation.pdf
Click on "States" in the upper left corner to see states grading as to fiscal
responsibility and debt crises ---
https://www.statedatalab.org/
In other words the "radical diversity" issue is not so much a cause of
reduced support higher education as is a budgeting choice issue devoting the
lion's share of state budgets to health and welfare, especially Medicaid. And a
major cause of the increase in Medicaid spending is the way citizens are
figuring out how to divert long-term assisted living and nursing home expenses
to Medicaid. If families plan ahead more than five years in advance, they can
funnel more of their parents and grandparents resources into their own pockets
and shift the long-term nursing care expenses over to Medicaid. And then they
complain that the states are paying less for their children's state-supported
higher education.
Medicare and Medicaid were never intended by government to pay for so much
long-term nursing care of the middle class, but by one means or another schemes
have been devised to make long-term nursing care and the cost of dying for the
middle class as well as the poor. Medicaid is picking up a larger share of
long-term nursing costs and Medicare is picking up the cost of dying
(hospital, medication, and doctor bills).. The cost of
dying became the largest budget item in Medicare and is exploding as the
population of the USA ages. This is also the major cause, along with underfunded
pensions, of funds being diverted by states from
higher education to Medicaid.
The bottom line is that as the population ages we're seeing a
massive shift in state (and Federal) spending from
the young to the old as education money is
massively being diverted to Medicaid (and Medicare).
**How to Mislead With Statistics (rankings)
Computer Science ---
https://en.wikipedia.org/wiki/Computer_science
Note the wide-ranging sub-disciplines and distinctions between theory and
applications.
Controversial Ranking of the Top 50 Computer Science Programs in the World
---
http://www.businessinsider.com/best-computer-science-schools-in-the-world-2018-3#48-shanghai-jiao-tong-university-3
Jensen Comment
It's probably a fluke due to criterion weightings, but I don't quite agree with
the relatively low ranking of the University of Texas at Austin (rank 27).
Is the extremely wealthy and reputable UT program really inferior to Georgia
Tech (Rank 21), the University of Melbourne (Rank 15), the University of Toronto
(rank 11), and UCLA (rank 13)?
The rankings of graduate school programs in general does not imply that those
programs are great or even existent for top undergraduate students. For example
top ranking programs of business at Harvard and Stanford do not even have
undergraduate business programs.
The rankings were taken from
https://www.topuniversities.com/university-rankings/university-subject-rankings/2018/computer-science-information-systems
The criteria are academic reputation (however defined?), employer reputation
(however defined?), citations per paper (where there's a lot of cheating by
publishers), and H-index citations.
H-index ---
https://en.wikipedia.org/wiki/H-index
H-index criticisms ----
https://en.wikipedia.org/wiki/H-index#Criticism
There's also some doubt in my mind how to define "computer science" in the
first place. Some programs are very consolidated whereas in others the programs
my be dispersed among schools of engineering, science, mathematics, and even
business where there's often more money to buy top talent and top students.
In my opinion, the term "computer science" is too broad and ambiguous. There
are so many widely divergent sub-disciplines where the reputation rankings
within a sub-discipline may vary drastically from the rankings shown in the
above Business Insider link. It's a little like ranking of "business" programs.
Harvard and Stanford for example have top "business" programs that provide
virtually zero graduates for the accounting profession defined in terms of
financial accounting and managerial accounting and tax accounting. Accounting
employers would probably exclude Harvard and Stanford when ranking financial
accounting and managerial accounting programs, although both Stanford and
Harvard have top accounting doctoral programs that supply academic employers.
Bob Jensen's threads on ranking controversies ---
http://faculty.trinity.edu/rjensen/HigherEdControversies2.htm#BusinessSchoolRankings
Added Note
The world's top-ranked computer science program at MIT is amazing in that it
shares some of its top courses with anybody in the world willing to take MIT's
free MOOCs ---
http://faculty.trinity.edu/rjensen/000aaa/updateee.htm#OKI
Some of MIT's top students commenced by first taking one or more MOOCs.
**How to Mislead With Statistics (rankings)
100 Best Places to Live in the USA
http://time.com/money/collection/best-places-to-live-2017/?utm_source=time.com&utm_medium=email&utm_campaign=the-brief&utm_content=2018012212pm&xid=newsletter-brief
Jensen Comment
The first clue to misleading statistics is the relatively high number of towns
in California that make the Top 100 when town costs (think housing) is a
criterion in this ranking. This suggests to me that state costs (think state
income taxes, sales taxes, gasoline costs, etc. are were left out of the ranking
criteria. You cannot live in a town and be shielded from the high costs of
living in the state that contains the town. California is among the Top 5 states
in terms of living costs. Towns in other high cost states are included in the
rankings.
Of course the rankings in this study were not confined to living costs. There
were other considerations such as quality of schools. That, in turn, leads to a
bias in town size since larger towns and cities tend to have more troubled
public schools (think gangs) and living costs that often drive the best teachers
to smaller towns.
The "test place" to live for a given person varies greatly for things not
considered in this article. For example, San Antonio (an nearby towns) are
extremely popular places to live for retired veterans of the military. This is
largely because those retire folks get access to great military hospitals,
include medical command hospital at Fort Sam Houston and a big VA hospital. Also
there are other benefits such as tax free shopping at base exchanges, base golf
courses, military clubs, and most of all --- a a social community of tens of
thousands of military retirees who have already located in the San Antonio area.
There are of course many other "best place" criteria for certain individuals.
Some people like me love winter; others hate it. Some people like me hate heat
and humidity; others have a higher tolerance for South Florida and South Texas.
Chronicle of Higher Education
The above ranking seems to ignore employment opportunity and wage levels as a
criteria for choosing a place to live. Professionals like accountants,
attorneys, and physicians often face lower opportunities and revenues in smaller
communities, especially very rural communities. Blue collar workers certainly
face few job opportunities and wage rates.
A Dying Town: Here in a corner of Missouri and across America, the lack of
a college education has become a public-health crisis ---
https://www.chronicle.com/interactives/public-health?cid=db&elqTrackId=8e0605106c784d40abeef68721ce03f7&elq=3f78a602f46f4ce38b89816e51756272&elqaid=17292&elqat=1&elqCampaignId=7523
Drive 90 miles north on Interstate 55 from Memphis,
then 20 miles west on Route 412, cutting through seemingly endless fields of
cotton, rice, and soybeans. You’ll know you’ve arrived when you see the
sign: Welcome to Kennett. Hometown of Sheryl Crow.
This small town in southeastern Missouri used to
greet visitors with a different motto: "Service. Industry. Agriculture." But
the machine-parts-maker closed and the trailer manufacturer left and the
aluminum smelter went under. There’s not nearly as much industry around here
as there used to be. Sheryl Crow’s Grammys aren’t going anywhere.
Route 412 becomes First Street, and downtown opens
up with a McDonald’s to your left and a Burger King to your right. There are
just two grocery stores in town, but fast-food restaurants are everywhere.
It’s easier to find a pharmacy than a salad bar.
Outside the row of medical offices that border the
hospital, people pause for one last smoke. Mr. Chan’s still sells doughnuts
and kolaches, and Riggs Supply is, somehow, holding on, but there are many
boarded-up storefronts along First Street these days. Down the road, a
branch of the local college offers programs in education, criminal justice,
and agribusiness. College-going isn’t so common, though. In this area, just
one adult in 10 has a four-year degree.
Recently the town tried to revitalize the area
around the old county courthouse. It added new streetlights and redid the
sidewalks. But few people use them.
This is the Missouri Bootheel. The counties around
here are called that because if you squint at a map, it kind of looks like
the heel of a boot, jutting south from the rest of the state into Arkansas
and Tennessee. The name comes from its shape, but it’s something of a
metaphor, too. It can sometimes seem like life is trying to grind people
down.
It’s a place, one of many in America, where
disadvantages pile up. Researchers are uncovering links between education —
or lack of it — and health, and they don’t like what they see. It’s not
clear whether a college degree leads directly to better health, or, if so,
how. But the findings are alarming: Educational disparities and economic
malaise and lack of opportunity are making people like those in the Bootheel
sick. And maybe even killing them.
Continued in article
Jensen Comment
We seem to be reverting to small towns without medical services. In Swea City,
Iowa in the early 1900s there were no doctors, dentists, or even local law
enforcement in my Grandmother Dourte's home town. She had all her teeth pulled
at one time by a traveling dentist and watched her oldest son die upstairs from
pneumonia and her young daughter die on from a burst appendix. Most babies were
born inside homes with local midwives in attendance. Going off to college was
infrequent in these small towns. Today in this town most residents are retired
farmers --- there are not many high school graduates to go college, and those
that do go to college usually don't return to their small home towns.
he New Yorker Writes About a "Small" Iowa Town: Leave
or Stay
In a small town in Iowa where the American dream lives on, residents wonder
whether to resolve conflicts or fulfill their longings by moving away or staying
put ---
https://www.newyorker.com/magazine/2017/11/13/where-the-small-town-american-dream-lives-on?elqTrackId=cd9222bf37db46a7802121a2eec65d16&elq=3ce84d7ba2e64ee4b0c0144246469972&elqaid=16817&elqat=1&elqCampaignId=7280
Note that Orange City featured in this is a relatively large Iowa town in a
state filled with towns having less than 1,000 residents. There were many
"thriving" Iowa towns back in the days when they were surrounded by small family
farms of 80-160 acres. When I grew up in the 1950s on both a farm and later in
town farmers did not have to invest heavily in equipment, and most farmers were
still supplementing a small tractor with horses and mules. At harvest time
threshing machines moved from farm to farm, thereby making it unnecessary for
every farmer to own a threshing machine. Now making a living on 240 acres is a
marginal operation given the nearly $2 million needed for enormous tractors,
combines, sprayers. planters, tanks, etc. There's no profit in raising a few
cows, sheep, chickens, and turkeys that are now raised in enormous containment
feeding operations holding thousands or tens of thousands of animals.
When the families sold off their small farms to bigger farms
there were fewer and fewer customers shopping in small Iowa farm towns. Many
downtown stores were boarded up or torn down and town schools closed to become
part of every larger school districts covering multiple towns. Jobs dried up in
the small towns such that residents that wanted to stay either could not find
and work or could only find part-time work at minimum wage --- not a living wage
for a family.
One of the things that shocked me is that there was almost no market for the
big two-story house my grandfather built in Swea City around 1900. The
oak-paneled house had four bedrooms plus a den along with a living room, dining
room, big kitchen, and den. When I returned for a visit to Swea City in the
1960s this well-maintained house with a big porch could be purchased for less
than $10,000. In Des Moines such a house would be priced at well over $100,000.
The thing is that Des Moines has a viable economy with over 200,000 residents
and many career opportunities to work in town. Swea City has around 500
residents, most of whom are retired farmers who choose living in Swea City
because of the cheap housing. But they have to drive over 30 miles to larger
towns for shopping since the grocery stores, the clothing stores, the hardware
stores, the drug stores, etc. are now boarded over in Swea City. There are very
few jobs available today in Swea City, Iowa.
What caused the demise of small Iowa towns like Swea City?
Firstly, it was the demise of the small family farms that used to surround the
towns with a customer base. Second, it was the change in professional services
where professionals like physicians and lawyers now prefer to no longer be
sole-practitioners serving a small community. Now professionals prefer to be in
medical clinics and multiple-partner law firms located in larger towns and
serving smaller communities from a distance. What medical school graduate or law
school graduate wants to set up a one-person practice in Swea City, Iowa?
Thirdly, it was changing roads and vehicles. In the 1960s Iowa knocked the curbs
off its narrow highways and straitened out the sharp curves such that the trip
from Swea to the larger Algona now takes about 30 minutes for shopping rather
than upwards of an hour that it used to take in the 1930s. Plus in the 1930s
drivers sometimes had to stop once or twice to put patches on inner tubes of
flat tires. In the 21st Century it's relatively rare to have a flat tire driving
from Swea City to Algona.
The economic sacrifice made to raise a family in a small Iowa town is
negatively correlated with the size of the town coupled with other factors such
as having an area college and hospital in the town and commuting distance to a
larger town for jobs. Orange City featured in the above article has over 6,000
residents making it a relatively large Iowa town. But it's also remotely located
such that not many residents want to commute elsewhere for jobs.
That makes the above article somewhat interesting since
there are some economic opportunities in Orange City for those who want to
remain and raise their families in Orange City.
**How to Mislead With Statistics (missing variables) (rankings)
The Best and Worst States for Business
https://247wallst.com/special-report/2018/02/28/the-best-and-worst-states-for-business-5/?utm_source=247WallStDailyNewsletter&utm_medium=email&utm_content=MARCH012018A&utm_campaign=DailyNewsletter
Jensen Comment
This is misleading because there are so many criteria and ways to weight these
criteria in terms of importance. For example, low population states are poor
business choices for franchise retail stores and food chains because demand is
so low in states that only do not have large cities (think Wyoming, Vermont, New
Hampshire, and Alaska). Similarly low population states have limited labor
supplies, especially for skilled labor. For firms not dependent upon the local
areas for customers these states can have other attractions such as fewer
business regulations and low taxes. South Dakota attracts credit card companies
because of the regulatory climate. This is not such an attraction for automobile
companies seeking to build new factories.
In the above rankings Massachusetts is ranked in top place. Massachusetts is
attractive for firms wanting skilled labor and nearness to top universities.
Massachusetts is also known in New England as Taxaachusetts because it taxes
everything in sight.
New Hampshire ranks pretty high in terms of low taxes, low housing costs,
schools, and living environment and yet New Hampshire does not provide much
competition for companies seeking skilled workers, low energy costs, and funding
deals like those offered in New York. New Hampshire has no sales tax or general
income tax, but its business taxes and property taxes are relatively high.
One criterion in the above is working age population change 2010-2020. But
this is a percentage index that suffers from denominator effects that make low
worker population in 2010 attractive.
The bottom line is that business climate is in the eye
of the beholder. Every state has some attractions and some detractions.
States with the most detractions (think highly taxed California with its soaring
living costs and business regulations) also have some important attractions that
include climate, labor market, large cities, and a huge coastline with busy
shipping ports
**How to
Mislead With Statistics (missing variables) (rankings)
Best and Worst States for Business --- one more time
https://247wallst.com/special-report/2019/02/21/best-and-worst-states-for-business/?utm_source=247WallStDailyNewsletter&utm_medium=email&utm_content=FEB222019a&utm_campaign=DailyNewsletter
Jensen
Comment
This is an example of the many misleading rankings where there are so many
variables and situations that any ranking can be misleading. For example, when
it comes to locating a business in the USA the many variables to consider
include state taxation of business, state taxation of employees, availability of
skilled and unskilled employees, housing costs and availability, quality of
public schools, labor union militancy, access to raw materials, access to
customers, litigation risks peculiar to a state, transportation costs, and on
and on and on.
For
example, the top-ranked state in this study is Massachusetts. There are many
reasons to for some businesses to locate in Massachusetts such as the main
reason given by GE to move its headquarters to Boston was the access to such
outstanding research universities such as Harvard, MIT, and many others.
Massachusetts also has an ocean coast with seaports. However, there are also
many drawbacks to Massachusetts such as the reason it's called Taxachusetts in
New England. It's also one of the worst states in terms of its debt management
and labor union militancy. Boston will not even allow non-union businesses like
Walmart. Boston does not rank high in terms of public transportation (think
subways) and has notorious traffic jams. Massachusetts is in the upper east
corner of the USA is a long distance from some raw materials like (like Midwest
grain) and customers. It would be stupid for Tesla to build a second car
factory in Massachusetts, although there are other negatives such as Tesla's
abhorrence of labor unions. To top it off, Massachusetts has a lousy climate ---
http://faculty.trinity.edu/rjensen/Tidbits/Snow/Set07/SnowSet07.htm
In this
study the worst ranked city for business is Louisiana. There are many reasons
for this, including a lousy (hot and humid) climate, lousy public schools and
shortage of skilled labor. But there are many reasons in favor of Louisiana such
as the reason so much grain is exported to the world out of the end of the
Mississippi River. There are many other reasons why businesses might choose
Louisiana over Massachusetts ---
https://www.opportunitylouisiana.com/docs/default-source/eq-articles/2015/eq_q4_2014.pdf?sfvrsn=2
My
point here is that ranking states according to "business opportunity" or
colleges according to "education opportunity" is more misleading than helpful
due to so many variables to consider and weight when doing such rankings. The
results are garbage rankings. If you want to rank states or colleges limit the
number of variables and be absolutely clear as the weightings of those
variables.
**How to Mislead With Statistics (missing variables)
Does Gun Control Reduce Murder? Let’s Run The Numbers Across The World ---
http://thefederalist.com/2018/04/03/gun-control-reduce-murder-lets-run-numbers-across-world/
Jensen Comment
There are just too many intervening and missing variables such as the varying
degrees of gun control laws and their law enforcement in different nations.
Having a law against gun ownership would do little in El Salvador or Honduras
where the inmates are running the asylum (think helpless law enforcement).
Nations like Norway do much more to treat mental illness than developing nations
with high poverty rates and poor health treatment in general.
Having said this there is something to be said about knowing crime rates
(including murder and kidnapping rates) and taking precautions when visiting
some nations or parts of those nations. The USA State Department, for example,
issues warnings about travel dangers. These can be misleading, however, when
there is lack of detail. For example, some nations like Sweden, Belgium, and
Germany have relatively low crime rates but there are some parts of these
nations where even the police fear to tread.
There are also varying definitions of gun control. For example, introducing
controls of gun "purchases" in the USA does little to change crime rates in
nations like the USA where there are already high rates of gun ownership and
huge underground markets for illegal gun trading. Controls on gun "possession"
may be more effective such as controls in NYC versus Manchester, NH but here
once again there are too many intervening variables such as crime rates in NYC
versus Manchester, NH.
Also having localized strict gun controls may be highly ineffective if
surrounding areas have loose gun controls. For instance, if it does little good
for Chicago to control handgun purchases if handguns and ammunition can be
easily purchased in surrounding suburbs.
Having strict laws on gun dealers does little good in gun shows are not
subjected to the same controls. For example, while living in San Antonio I
purchased a 38 Special without even leaving my name at a gun show. I could not
have done this if I purchased the same handgun from a San Antonio gun dealer.
How to Mislead With
Statistics (missing variables)
Chicago's
mayor declared Chicago is on the firmest financial footing in years, but
taxpayers should understand that the pitch is deeply misleading ---
http://www.chicagobusiness.com/opinion/how-emanuel-misleading-you-citys-debt
**How to mislead with
statistics (missing variables)
It's cheaper to enroll people in Medicaid than to subsidize their private
insurance ---
Scroll down at
http://ritholtz.com/2018/08/10-sunday-reads-126/
Jensen Comment
This graph is misleading because it only looks at the short-term annual expense.
Subsidizing private insurance only covers short-term medical expense annually
and does not cover long-term nursing care. The two-ton guerilla is the excluded
Medicaid coverage of long-term nursing care that even Medicare won't cover. This
also is misleading in that private insurance might cover treatments by doctors
and hospitals that will not treat Medicaid patients.
**How to Mislead With Statistics (rankings)
Chronicle of Higher Education: Colleges With the Lowest and Highest
Student-to-Faculty Ratios, Fall 2016 ---
https://www.chronicle.com/article/Colleges-With-the-Lowest-and/243056?cid=wb&utm_source=wb&utm_medium=en&elqTrackId=7ac75e616679422090804fe9511ee199&elq=6b15a52427684424b982e1bd30f5e7c9&elqaid=18727&elqat=1&elqCampaignId=8441
Jensen Comment
These rankings ignore the variances of programs within universities, especially
professional programs. For example, universities like Harvard and Pennsylvania
have very high student-faculty ratios in business, law, medicine, etc. relative
to music programs. It's not uncommon at the Harvard Business School to have
classes of 90+ students while some research professors in science have zero or
only a few students.
Having a low student-faculty ratio does not guarantee small classes. Many
universities have large lecture classes for elementary core courses in order to
free up faculty for advanced courses.
There's often a huge difference between graduate and undergraduate class
sizes, also this is not always the case in professional studies such as the
Harvard Business School example mentioned above. Prestigious law schools
sometimes have very large classes.
There's sometimes a huge difference between onsite class sizes and online
class sizes (think University of Florida)
Some universities are embarrassed by low student-faculty ratios that they
wish were ten times greater (think of the struggling Chicago State University
that is close to bankruptcy and empty classrooms).
There's also a huge difference between how to define "faculty," especially
"faculty" teaching in huge online programs that are much more likely to be
adjunct non-tenured faculty who have their primary careers in the professional
world rather than in academe.
**How to mislead with statistics (rankings, definitions)
Worst Companies to Work For ---
https://247wallst.com/special-report/2018/06/07/worst-companies-to-work-for/
Jensen Comment
This is misleading in the sense that types of employees differ in organizations.
For example, a university might be stingy with pay and benefits to adjunct
faculty while doing quite well for tenured faculty. An airline might be highly
rated by its pilots and mechanics but not so hot by its ticket agents. My wife
says in the old days hospitals treated nurses like dirt while laying down red
carpets for physicians, including ill-tempered physicians who were arrogant and
rude to hospital staff. I think that in this era of multi-million dollar
lawsuits hospitals and physicians are now more courteous to staff. Even before
the #MeToo craze, lawsuits took its toll on sexual harassment. Still, lingering
sexual harassment in the work place varies by industry --- temptations are
greater in film making, hospitals, airlines, and colleges relative to oil
drilling and road construction. Affirmative action greatly increased sexual
harassment risks in some industries. When I was on a battleship there were only
2,600 men on board. Being a woman today on a Navy ship expanded employment
opportunities and sexual harassment risks simultaneously. The military does not
have a good record to date in preventing sexual abuse, but risks vary greatly
among assignments.
**How to Mislead With Statistics (in this case rankings)
Reuters Top 100: The World's Most Innovative Universities - 2017
https://www.reuters.com/article/us-amers-reuters-ranking-innovative-univ/reuters-top-100-the-worlds-most-innovative-universities-2017-idUSKCN1C209R
Jensen Comment
First of all, the rankings surprised me when I noticed some that some of the
world's leading universities on other criteria were not at or even near the top.
The Universities of Oxford and Cambridge, for example, barely made the top third
at Ranks 31 and 28 respectively. Smaller Universities have almost no chance of
high rankings, although Vanderbilt is a noted exception. Rice University is near
the bottom at 01/100. Dartmouth College and Swarthmore are not even ranked,
although in Swarthmore's case
Swarthmore College ---
https://en.wikipedia.org/wiki/Swarthmore_College
Despite its small size, Swarthmore's alumni have
gone on to make advances in their field. Graduates include 5 Nobel Prize
winners (2nd highest number of Nobel Prize winners per graduate in the
U.S.), 11 MacArthur Foundation fellows (second highest per graduate in the
U.S.), 30 Rhodes Scholars, 27 Truman Scholars, 10 Marshall Scholars, 201
Fulbright Grantees, and hundreds of prominent figures in law, art, science,
business, politics, and other fields. Swarthmore also counts 49 alumni as
members of the National Academies of Science, Engineering and Medicine, the
fourth highest ratio per graduates in the U.S.
I give Swarthmore credit for having five Nobel Prize winners among alumni,
but how much credit should Swarthmore get among the many other contributing
factors to the success of alumni, including the ones that went on to graduate
school at Harvard, Stanford, etc. In fact how much credit should Harvard and
Stanford get for their intermediate role in the success of top innovators that
would probably have achieved success had they gone to graduate school at lower
ranked Oxford or Cambridge or the University of Mississippi.
In some respects Swarthmore does better than Vanderbilt University that came
out at rank 10/100 in the Reuters ranking on "innovation." Note the variation in
rankings of Vanderbilt in world competition
Vanderbilt is ranked the 108th best university in
the world in the Times Higher Education World University Rankings, and 52nd
in the United States by the Academic Ranking of World Universities. U.S.
News & World Report ranks it the 14th best university nationally, and
Reuters ranked it the 10th most innovative university in the world.
There are all sorts of problems with trying to rank colleges and university
in terms of innovation. Such rankings are heavily influenced by faculty
reputations. The question here is timing of acquisition of faculty. Stanford and
Harvard get credit for having Nobel Price winners on the faculty but some were
hired after they already won these honors. The methodology used by Reuters is
based heavily on journal article publications, but it's much easier in the
academic world for Nobel winners to publish both alone and with highly talented
co-authors.
The methodology used by Reuters is explained at
https://www.reuters.com/innovative-universities-2017/methodology
Bob Jensen's threads on rankings Flaws ---
http://faculty.trinity.edu/rjensen/HigherEdControversies2.htm#BusinessSchoolRankings
**How to Mislead With Statistics (rankings)
What Do Women Want… in a B-School?
https://www.insidehighered.com/admissions/article/2018/03/12/new-ranking-ft-raises-question-how-women-can-judge-business-school
.Even
as women have become the majority in undergraduate student bodies and at
many professional schools, their numbers have been much smaller as a share
of the total enrollment in M.B.A. programs.
Many experts
say this is a failing of business schools. Last week,
FT
(formerly
Financial Times)
-- which is influential in rankings of business schools -- issued its first
list of
top M.B.A. programs for women.
Many experts
on business school admissions said that they hoped
FT’s
attention would encourage business schools to think not just about their
overall performance, but how they are seen on issues that tend to matter to
women.
But what do women seeking an M.B.A. want? Of those looking at the
methodology, some have said that it places too much emphasis on salaries --
and ignores factors that may be important to many women.
FT’s
focus in its methodology is alumni salaries, which count for 45 percent of
the total formula, with one-third of that total for each of average salary
of female alumni three years out of the program, increases from pre-M.B.A.
salary, and the smallest gaps in average salaries of male and female alumni.
The rest of the formula covers many areas, including percentage of female
faculty members, percentage of female students, percentage of women on
advisory boards, and women's responses to questions on their career
progress, the effectiveness of career centers and other factors. The
rankings methodology in many ways mirrors that for
FT’s
main rankings (except for looking at data about and from women). FT did not respond to a request to
discuss its methodology.
Using this system,
FT finds
that three of the top 10 institutions globally are from China and another is
from Singapore. The publication attributes this success to encouragement in
China and Asia for women in the business world to advance in their careers,
with less wage discrimination against women in their jobs.
The top American institution is Stanford University, followed by the
University of California, Berkeley; Washington University in St. Louis;
Harvard University; Dartmouth College and the University of Pennsylvania.
The website
Poets & Quants
noted that it
was possible to make the list (if not the top 10) while having very few
female faculty members -- the top 50 programs included 10 where women do not
make up more than 20 percent of the faculty.
M.B.A.
programs in the United States, in which male students have long been in the
majority, are making progress in enrolling greater numbers of women,
according to
a report
last year by the Forté Foundation, which works with business schools to
promote gender equity. The foundation found that its members have reached an
average of 37.4 percent female enrollment in M.B.A. programs, up from
33.4 percent five years ago. Five years ago, the foundation had only two
members that had reached 40 percent female enrollment. Today 17 business
schools have enrollments that are at least 40 percent female.
But a review by "Admissions Insider" of the gender breakdowns in the
American M.B.A. programs that made the top 10 list found none with gender
parity.
Continued in article
Jensen Comment
This is a criticism of a recent Financial Times ranking of MBA programs that did
not include proportion of women as a criterion (and other matters of possible
concern to many women students). This simply reinforces the long-running
criticisms of rankings in general that are mainly a function of criteria and
weightings of criteria.
What surprised me some is that among the top-rated programs the proportion of
women is not all that widely spread.
Dartmouth and Penn have the highest share of women
(44 percent), while Washington University has the lowest figure (39
percent). These are all above national averages, but not close to parity.
A difference of 5% between the highest and lowest may be statistically
significant but is hardly what I call substantively significant in this
particular instance. It may well be a difference based upon career choice
stemming back to undergraduate majors where women are known to prefer certain
fields (think education and nursing) relative to other fields that often feed
top MBA programs such as engineering and computer science.
An MBA from a prestigious university may greatly
improve the credentials of an engineer or computer geek relative to the minimal
improvement of a high school teacher relative to a masters degree in education.
Even within business disciplines an MBA from a prestigious university may be
of questionable value. For high demand for auditors and tax accountants the
large international CPA firms do not even recruit MBA graduates from Harvard,
Stanford, Wharton, Dartmouth, etc. Instead they recruit masters in accounting
graduates who chose accounting graduate studies so they could sit for the CPA
examination. And the proportions of women in those masters of accounting progrms
are much higher since the international CPA firms tend to hire more women than
men.
**How to Mislead With Statistics (rankings)
The Best Chain Restaurants ---
http://time.com/money/5183389/best-casual-dining-restaurant-chains/?utm_source=time.com&utm_medium=email&utm_campaign=the-brief-pm&utm_content=2018030917pm&xid=newsletter-brief&eminfo=%7b%22EMAIL%22%3a%22MOt2LMJiSIk%2fSjadSWyB4I9Monw61fXF%22%2c%22BRAND%22%3a%22TD%22%2c%22CONTENT%22%3a%22Newsletter%22%2c%22UID%22%3a%22TD_TBP_D67FCAE7-F3B7-4357-9082-476F8ACD8245%22%2c%22SUBID%22%3a%2284575328%22%2c%22JOBID%22%3a%22669846%22%2c%22NEWSLETTER%22%3a%22THE_BRIEF_PM%22%2c%22ZIP%22%3a%2235864237%22%2c%22COUNTRY%22%3a%22%22%7d
Jensen Comment
None these is in our mountain region, so I really should not comment about this
selection. However, it appears that all specialize in menus of fat and sugar.
Some are quite expensive (think Ruby Tuesday and The Cheesecake Factory). I
don't know how many have great vegan alternatives, but I doubt that any of these
would make the top ranking by vegan customers.
Within a 30 mile radius of our cottage the 99 Restaurant is the most popular
medium-priced chain restaurant in terms of daily numbers of luncheon and dinner
customers (not open for breakfast), although for more romantic ambiance one
would probably pick a more expensive hotel or B&B dining room. For breakfast we
take our house guests to the Mt. Washington Hotel where you should arrive before
10:00 am since this really isn't a brunch alternative ---
https://www.omnihotels.com/hotels/bretton-woods-mount-washington?gclid=EAIaIQobChMIrfT6yYPg2QIVGksNCh0RbwyyEAAYASAAEgLVePD_BwE&gclsrc=aw.ds
Lunch and dinner are served with a view of the mountain and a great old-resort
ambiance, but prices are way too high for what you get for food. The breakfast
buffet is the best deal. In summer breakfast can be followed by an adventure on
the nearby Cog Railroad chugging up to the top of Mt. Washington repeatedly
until 4:00 pm. There is a restaurant at the top of the mountain, but it's not
great and mostly offers weather protection. It can be 90 degrees down below and
30 degrees on top with a 50+ mph wind and fog. In winter it sometimes drops to
-100F or lower with 100+ mph winds. But the Cog Railroad does not run in the
winter.
Cog Railroad
http://faculty.trinity.edu/rjensen/Tidbits/CogRailroad/History1/CogRailroadHistory.htm
http://faculty.trinity.edu/rjensen/Tidbits/Mountains/HistoryWhiteMountains/01/HistoryWhiteMoutains01.htm
By far the most popular breakfast and luncheon restaurant in the State of New
Hampshire is Polly's Pancake Parlor that's only one mile from our cottage. It is
not a chain, but people come to Sugar Hill from all over New England and parts
of Canada to eat at Polly's. Vegans are not so happy, however, unless they like
lots of carbs (think maple sugar condiments). In 2017 the very old farm building
that housed the restaurant elbow-to-elbow on long tables was replaced by a more
spacious new building. Polly's also added alcohol for the first time, although
diners really don't choose Polly's for the bar. In summer season. foliage
season, and on holidays be prepared to wait well over an hour for a table,
although you can call ahead to get on a waiting list. Polly's opens and 7:00 am
and closes at 3:00 pm. The mountain views are excellent, and there's almost
always a breeze on hot days. Come early or late to beat the long lines.
For over 100 years the old restaurant was attached to the original farm house
that served breakfast to people in horse carriages passing by ---
http://www.cs.trinity.edu/rjensen/Tidbits/2009/Tidbits090105.htm
Erika and I eat most often our Littleton Regional Hospital. More often than
that we take home luncheon meals to store for weekends. The hospital's dining
room ambiance sucks, but the chef from Austria is a former chef at the Von Trap
Family Lodge in Vermont. Before that he was a chef at Mackinac Island's Grand
Hotel. It's a long story how this chef ended up cooking in a tiny hospital. I
won't into details here. Sometimes chefs just grow weary of cooking for weddings
and conventions and other enormous crowds. On rare occasion Jurgen cooks for our
dinner parties here in our cottage. However, he does this as a friend and is not
in the home cooking business.
**How to Mislead With Statistics (rankings)
College Majors With the Highest and Lowest Unemployment ---
https://247wallst.com/special-report/2018/06/14/college-majors-with-the-highest-unemployment/?utm_source=247WallStDailyNewsletter&utm_medium=email&utm_content=JUN152018A&utm_campaign=DailyNewsletter
Jensen Comment
These types of rankings can be misleading for various reasons. For example,
majors in zoology have relatively high employment percentages. But this is
misleading because there are so few majors in zoology, giving rise to a small
denominator. In comparison psychology majors have relatively low employment
percentages, but this is in part to having such a large denominator.
Many of the majors with high employment percentages are often employed in
dead end jobs in the sense that there are few advancement opportunities. For
example, physical therapists and computer programmers can usually find work but
chances are that they will be doing the same thing in year 20 that they did in
year 1 without much change in compensation other than inflation adjustments.
Some jobs currently with high employment rates (think nuclear engineering)
have poor long-term prospects such as the bleak future of nuclear energy plants.
Beware of the highest paying jobs right after graduation. These often entail
living on sales commissions such as selling stocks and bonds on Wall Street.
This is not so great year after year.
Some jobs with high employment rates also have high burn out rates such as
special needs teachers. This is a tough career year after year in spite of the
wonderful services provided. Many such teachers long to return to general
education.
Choosing a major should be taken much more seriously than many students do
take such a decision in the first two years of college. For example, one of the
things to consider is how the job differs early on versus years later. Sometimes
no change is a great thing. For instance, I
loved the fact that I was doing pretty much the same thing in the last ten years
of my college faculty career than I did in the first ten years as a professor.
It was a tremendous career choice for me. On the other hand, if I was a tax
accountant doing the same things at the end of my career as I did early on I
might not have been so happy with all the intervening years of "same old same
old."
I've mentioned before that the great ophthalmologist who gave me implants to
correct my cataracts admitted to me that he's awfully bored with his life doing
pretty much the same thing year in and year out. He's now in an online MBA
program and is considering a career change. The general surgeon who performed
both wife's gall bladder surgery burned out before 50 years of age, stopped
performing surgeries, and went into drug counseling. He says he mainly grew
bored and exhausted from doing stressful surgeries week in and week out.
We have a close friend at church who retired early from teaching the third
grade for 32 years. He says he just wore out living this routine and was too old
to track into something else like school administration. He was, by the way, a
very popular teacher all those 32 years and often encountered parents who were
his former students.
Military is often a better career than young people think when they are
making career choices. Not far from where I live is a retired Coast Guard search
and rescue helicopter pilot. He says this was a great, albeit stressful, career
for 24 years. But he said he was growing tired of this life, and the military
retirement deal (lifetime pension and family medical insurance) made it
extremely opportunistic to change careers in the middle of his life. He and his
family moved into Sugar Hill from Oregon. He's now got the freedom to try
writing fiction while his wife has a good income at home as an online editor for
the Booz Allen consulting firm. There aren't too many careers other than
military that let you fully retire half way in life with a lifetime pension and
full medical coverage (including long-term nursing care) for the remainder of
your life.
**How to mislead with statistics (rankings)
Five Rules of the College and Career Game: College Degrees Pay More But are
Heavily Dependent on Specialties---
https://cew-7632.kxcdn.com/wp-content/uploads/CEW-FiveRulesReport-final.pdf?elqTrackId=f1f8acb70ca2404eb4bfcef876758ac0&elq=e52acf24017046d2be026f7844d3e4a7&elqaid=19114&elqat=1&elqCampaignId=8651
Jensen Comment
This study has the usual flaws by ignoring the fact that success varies with
prestige of the college degree and that there is considerable standard deviation
even for type of degree.
Compensation as well as job opportunities vary a great deal where success in
some disciplines nearly always entails costly urban living. This can greatly
increase living costs, especially for housing and private school tuition for
children.
What the study ignores is that starting salaries can be misleading. For
example, engineers generally start out at higher salaries than accountants but
the chances down the road managerial opportunities are often better for
accountants. Some lower paying jobs such as working as an agent for the FBI or
IRS greatly increase opportunities later on.
New graduates should always look for things other than starting compensation,
things like training, exposure to top clients, travel requirements, dependence
of compensation on commissions, and stress expectations. Sometimes compensation
and stress go hand and hand such as in law and public accounting where starting
salaries may be relatively low and fixed at the beginning and can increase
greatly depending upon ability to attract and serve clients. Often stress and
compensation are highly correlated.
**How to mislead with statistics (rankings)
Who pays the most tax in Europe?
http://www.euronews.com/2018/04/26/who-pays-the-most-tax-in-europe-
Jensen Comment
You've probably heard me warn repeatedly that when taxes are compared it can be
misleading unless you also compare what those taxes are paying for in family
living. Income tax rates in the USA are relatively low and highly progressive
with nearly half of the taxpayers paying zero income taxes. But this is
misleading since things like health care and public education are paid out of
other taxes and/or personal savings. Even when comparing nations with national
health care plans funded heavily out of income taxes, comparing tax rates can be
misleading. Firstly there are taxes other than income taxes such as VAT taxes
and sales taxes. Secondly, not all national health care programs are equivalent
in terms of how certain coverages are paid for. In Germany, for example, the
public health plan is rather minimal and most Germans that can afford it have
private supplemental medical insurance. My neighbors from England at the moment
are back in the U.K. arranging to sell a parent's home for nursing home care
expenses. Nursing home care in the U.K. is covered in the national health plan
but revenues from home sales must be applied to this care --- so I'm told by my
neigbors.
In Europe taxes supposedly pay for college education and/or job training, but
less than half the young people are admitted to programs funded by tax dollars
---
http://faculty.trinity.edu/rjensen/HigherEdControversies.htm#Tertiary
Other people depend upon companies to fund on-the-job training, and many people
are not allowed into college unless they study in other countries or take
distance education courses such as MOOCs..
**How to mislead with statistics (rankings)
States Where Teachers Are Paid the Most and Least ---
https://247wallst.com/special-report/2018/05/15/states-paying-teachers-most-and-least/2/
Jensen Comment
Higher pay does not necessarily translate to higher graduation rates. New York
pays the highest salaries and is mired down in down in low graduation rates.
South Dakota has low teacher pay and high graduation rates.
Also note the cost of living ranking reported with each state. This matters a
lot where pay buys a whole lot more (think housing) in South Dakota versus New
York and Connecticut.
**How to Mislead With Statistics (rankings, definitions)
Here's Where Americans Are Moving To and From
http://www.businessinsider.com/us-county-domestic-migration-map-2018-4
Jensen Comment
This type of analysis is misleading for a number of reasons. Firstly, it's based
on number of residents per 1,000 of a county who moved into or out of between
2016 and 2017. This makes the rankings biased toward smaller population
counties. For example, the "biggest migration into a county" resulted from the
1,979 people who moved into Kendall County, Texas resulting in a 47.2 rate of
migration per 1,000 residents of Kendall County. Many more people moved into
nearby Bexar, County Texas but since Bexar County has nearly 2 million people ti
had a negligible chance of beating the 47.2 rate of inflow per thousand. This
misleading type of ranking is typical result of small sample statistics. As
another example, suppose that 17 students from a small university take the CPA
exam in a given month and 12 pass all four parts of the examination making this
university the highest ranking in the state. A year later 16 take the exam and
four pass making it the lowest ranking in the state. Such ups and downs for a
small program rankings are common and very misleading when compared with larger
universities that have less extreme but more consistent passage rates on the CPA
examination.
There are other limitations when comparing "Where Americans Are Moving Too
and From" in the above analysis. For example, we might conclude that counties
with the highest positive migration rates are affording economic opportunities
to new arrivals. But in the case of Kendall County mentioned above the new
arrivals in Kendall County are probably working in Bexar County. Many of the new
arrivals in Kendall County are simply willing to make longer commutes for more
rural-type of living. The Progressive Farmer magazine ranked Kendall
County as the Fifth Best "Rural Place" to live in the USA.
https://en.wikipedia.org/wiki/The_Progressive_Farmer
But it's a rural county that offers urban (San Antonio) economic opportunity.
It's also far less rural the closer one gets driving south toward San Antonio.
In fairness Business Insider excluded counties having less than 10,000
residents when ranking migration into and out of counties. This eliminated the
extreme outliers, but there are still outliers that remain in the rankings. Of
course if it merely reported numbers of people moving into and out of a county,
small counties would almost never have a chance of being recognized.
Still another problem in the above statistics is that states vary greatly
regarding how a "county" is defined. Massachusetts is of somewhat comparable
size to Iowa, but Massachusetts only has 14 counties. Iowa has 99 counties.
https://en.wikipedia.org/wiki/List_of_United_States_counties_and_county_equivalents
**How to Mislead With Statistics (rankings)
Consumer Reports: The 11 Best and Worst Airlines in America ---
http://www.businessinsider.com/best-worst-airlines-america-consumer-reports-2018-3
01. Southwest Airlines (Best)
02. Alaska Airlines
03. JetBlue Airways
04. Virgin America
05. Hawaiian Airlines
06. Delta Airlines
07.Allegiant Airlines
08. American Airlines
09. United Airlines
10. Frontier Airlines
11. Spirit Airlines (Worst)
Jensen Comment
I'm particularly down on United Airlines. When we took our daughter to the
Manchester Airport (over 100 miles from our home) we were belatedly informed
that her flight had a mechanical problem and there was no way to get her to
Milwaukee until a departure early the next morning. We were also informed that
the Airline would not pay for her meals or hotel, which used to be the case for
non-weather delays. Boo on United that breaks noses of passengers refusing to
give up their reserved seats, bumps reserved passengers when members of Congress
want their seats, kill dogs in overhead compartments, and mistakenly flies dogs
to Japan.
In retirement one of the joys of my life is not having to fly much anymore.
Frequent flier awards should be renamed torture awards.
Having said this, I'm always dubious of rankings. Such rankings can be very
misleading. For example, perhaps airlines should be higher ranked for having
schedules to lots of airports. Southwest ranks high, but still does not forward
luggage to connecting flights of other airlines.
**How to Mislead With Statistics (rankings)
Forbes: Top States People Are Leaving Versus Top States People Are Moving
Into According to United Van Lines
Ranked in Terms of Moving Out of
01 Illinois
02 New Jersey
03 New York
04 Connecticut
05 Kansas
06 Massachusetts
07 Ohio
08 Kentucky
19 Utah
10 Wisconsin
Ranked in Terms of Moving Into
01 Vermont
02 Oregon
03 Idaho
04 Nevada
05 South Dakota
06 Washington
07 South Carolina
08 North Carolina
09 Colorado
10 Alabama
Jensen Comment
Firstly, these rankings are misleading to the extent that moves on United Van
Lines are not reflective of total moves in the 50 states. United Van Lines is
not to my knowledge the leading moving van company in each of the 50 states and
has more presence in some states than others. And for many moves the people
relocating do not even use expensive van lines such as when new college
graduates move into or out of a state.
Secondly, these are based upon proportions of moves in a state --- thereby
creating misleading numbers for very large and very small states. This is almost
certainly the case for Vermont having slightly over 700,000 men, women, and
children in the entire state. Fewer people move into Vermont each year than
into Boston. Similar population distortions arise for Nevada and Idaho.
Thirdly, these rankings are misleading in terms of the types of people moving
into and out of a state. People are moving into Washington, South Carolina,
North Carolina, Colorado, and Alabama because of economic opportunity, but
that's not likely to be the case for Vermont. People moving to Vermont are more
likely lower income retirees and/or tree huggers who want cheap real estate and
are not afraid of high taxes. Vermont's generous welfare benefits also attract
people on the dole.
Fourthly, the rankings above are distorted by geography. Boston is growing
rapidly due to high tech job opportunities. But other parts of Massachusetts
have obsolete factory towns due to technology changes. union labor rates, and
Taxachussets high taxes.
Some outcomes are most confusing for me such as the outcomes for Utah and
South Dakota. Colorado should be ranked higher because of all the pot addicts
attracted to Colorado. Maybe a lot of those addicts can't afford moving vans.
It seems to me that Florida should be ranked Number
01 in place of Vermont since so many people move into Florida to retire and then
die. United Van lines does not haul out the caskets and urns.
**How to
Mislead With Statistics (bias, proportions versus totals)
The USA Spends $23 Billion More on White Districts than Black Districts
---
https://leaders.edweek.org/profile/angela-ward-supervisor-race-equity-programs-cultural-proficiency/?cmp=eml-enl-eu-news1&M=58762398&U=2290378&UUID=b16c6f948f297f77432f990d4411617f
Jensen
Comment
That there is still segregation in some school districts is a sad thing, but
almost no districts are entirely white anymore so some progress has been made.
Where this study is misleading is that it implies that more tax money is spent
on white children per pupil. That is
misleading in several respects. Instead it states the obvious. More money is
spent in aggregate on white children mostly because there are so many more white
children. Blacks only account for about 13% of the USA population, and Latinos
are from mixed races with some being white (usually when descended from
Europeans and colored (when descended from natives). Also in black districts
(think New Orleans and Memphis) white children are often sent to private schools
not funded by taxpayers. The study should've reported the proportion of taxpayer
money spent per pupil.
Nearly Half of Undergraduates Are Students of Color. But Black Students
Lag Behind ---
https://www.chronicle.com/article/Nearly-Half-of-Undergraduates/245692?cid=at&utm_source=at&utm_medium=en&elqTrackId=4b25b4445cd449deab2ac48c46f77478&elq=e53c5591cbc9463eaa6a81d8ee5ad6fd&elqaid=22249&elqat=1&elqCampaignId=10942
The key data
points in the American Council on Education's new report on race and
ethnicity in higher education come as no surprise: College-student
populations are growing more diverse, yet achievement gaps persist among
different racial groups.
Still, the poor
outcomes for black students in particular are glaring.
All students of
color now make up more than 45 percent of the undergraduate population,
compared with less than 30 percent two decades ago, the association's report
found. Nearly one-third of graduate students are now people of color.
Hispanic students have shown the most growth; they are enrolling in and
completing college at levels never seen before.
Black students,
too, represent a larger share of the undergraduate- and graduate-student
population than 20 years ago, and a larger share of the students who earn
degrees. But black students who began college in the fall of 2011 had higher
dropout rates and lower six-year completion rates — 46 percent at public
institutions, 57 percent at private institutions — than any other racial
group.
The gender gap
for black students is wider than it is for any other group, as nearly
two-thirds of black undergraduates, and more than two-thirds of black
graduate students, are women. Black male students pursuing bachelor's
degrees were the most likely among any demographic group to drop out after
their freshman year.
Black
undergraduates also owed 15 percent more than other students after
graduation: an average of $34,010, compared with $29,669 for all students.
One-third of black students accumulated more than $40,000 in debt after
graduation, versus 18 percent of students over all.
Even with a
bachelor's degree, black graduates between the ages of 25 and 34 had lower
salaries than other graduates of a similar age, and their unemployment rate
was two-thirds higher, on average.
Continued in article
Jensen Comment
The phrase "color" is somewhat ambiguous in the USA --- especially since Latinos
are multiracial, particularly in terms of origins from Europe versus darker
native heredity ---
https://en.wikipedia.org/wiki/Demography_of_the_United_States#Race_and_ethnicity
It would seem that "whites" are now underrepresented in undergraduate
enrollments in the USA.
According to the 2010–2015
American Community Survey, the racial
composition of the United States in 2015 was:
|
Race |
Population (2016 est.) |
Share of total population |
|
Total |
318,558,162 |
100% |
|
One race |
308,805,215 |
96.9% |
|
White |
233,657,078 |
73.3% |
|
Black or African American |
40,241,818 |
12.6% |
|
American Indian and Alaska Native |
2,597,817 |
0.8% |
|
Asian |
16,614,625 |
5.2% |
|
Native Hawaiian and Other Pacific Islander |
560,021 |
0.2% |
|
Other races |
15,133,856 |
4.8% |
|
Two or more races |
9,752,947 |
3.1% |
|
White and Black or African American |
2,525,509 |
0.8% |
|
White and American Indian and Alaska Native |
1,884,407 |
0.6% |
|
White and Asian |
1,956,740 |
0.6% |
|
Black or African American and American Indian and Alaska Native |
318,302 |
0.1% |
Population distribution by race 1940-2010 (in %)
Hispanics
are shown like part of the races. Source:
U.S. Census Bureau, decennial census
of population, 1940 to 2010.[47]
|
Years |
1940 |
1950 |
1960 |
1970 |
1980 |
1990 |
2000* |
2010* |
|
White |
89.8 |
89.5 |
88.6 |
87.5 |
83.0 |
80.3 |
75.1 |
72.4 |
|
Black or African American |
9.8 |
10.0 |
10.5 |
11.1 |
11.7 |
12.1 |
12.3 |
12.6 |
|
American Indian and Alaska Native |
|
|
|
|
0.8 |
0.8 |
0.9 |
0.9 |
|
Asian and Native Hawaiian
and other Pacific Islander |
|
|
|
|
1.5 |
2.9 |
3.8 |
5.0 |
|
Some other race |
|
|
|
|
3.0 |
3.9 |
5.5 |
6.2 |
|
Two or more races |
|
|
|
|
|
|
2.4 |
2.9 |
|
Sum (%) |
99.6 |
99.5 |
99.1 |
98.6 |
100 |
100 |
100 |
100 |
*Data
are shown for the White, Black or African American, American Indian and
Alaska Native, Asian and Native Hawaiian and Other Pacific Islander, and
Some other race alone populations.
**How to Mislead With Statistics
What Do Women Want… in a B-School?
https://www.insidehighered.com/admissions/article/2018/03/12/new-ranking-ft-raises-question-how-women-can-judge-business-school
.Even
as women have become the majority in undergraduate student bodies and at
many professional schools, their numbers have been much smaller as a share
of the total enrollment in M.B.A. programs.
Many experts
say this is a failing of business schools. Last week,
FT
(formerly
Financial Times)
-- which is influential in rankings of business schools -- issued its first
list of
top M.B.A. programs for women.
Many experts
on business school admissions said that they hoped
FT’s
attention would encourage business schools to think not just about their
overall performance, but how they are seen on issues that tend to matter to
women.
But what do women seeking an M.B.A. want? Of those looking at the
methodology, some have said that it places too much emphasis on salaries --
and ignores factors that may be important to many women.
FT’s
focus in its methodology is alumni salaries, which count for 45 percent of
the total formula, with one-third of that total for each of average salary
of female alumni three years out of the program, increases from pre-M.B.A.
salary, and the smallest gaps in average salaries of male and female alumni.
The rest of the formula covers many areas, including percentage of female
faculty members, percentage of female students, percentage of women on
advisory boards, and women's responses to questions on their career
progress, the effectiveness of career centers and other factors. The
rankings methodology in many ways mirrors that for
FT’s
main rankings (except for looking at data about and from women). FT did not respond to a request to
discuss its methodology.
Using this system,
FT finds
that three of the top 10 institutions globally are from China and another is
from Singapore. The publication attributes this success to encouragement in
China and Asia for women in the business world to advance in their careers,
with less wage discrimination against women in their jobs.
The top American institution is Stanford University, followed by the
University of California, Berkeley; Washington University in St. Louis;
Harvard University; Dartmouth College and the University of Pennsylvania.
The website
Poets & Quants
noted that it
was possible to make the list (if not the top 10) while having very few
female faculty members -- the top 50 programs included 10 where women do not
make up more than 20 percent of the faculty.
M.B.A.
programs in the United States, in which male students have long been in the
majority, are making progress in enrolling greater numbers of women,
according to
a report
last year by the Forté Foundation, which works with business schools to
promote gender equity. The foundation found that its members have reached an
average of 37.4 percent female enrollment in M.B.A. programs, up from
33.4 percent five years ago. Five years ago, the foundation had only two
members that had reached 40 percent female enrollment. Today 17 business
schools have enrollments that are at least 40 percent female.
But a review by "Admissions Insider" of the gender breakdowns in the
American M.B.A. programs that made the top 10 list found none with gender
parity.
Continued in article
Jensen Comment
This is a criticism of a recent Financial Times ranking of MBA programs that did
not include proportion of women as a criterion (and other matters of possible
concern to many women students). This simply reinforces the long-running
criticisms of rankings in general that are mainly a function of criteria and
weightings of criteria.
What surprised me some is that among the top-rated programs the proportion of
women is not all that widely spread.
Dartmouth and Penn have the highest share of women
(44 percent), while Washington University has the lowest figure (39
percent). These are all above national averages, but not close to parity.
A difference of 5% between the highest and lowest may be statistically
significant but is hardly what I call substantively significant in this
particular instance. It may well be a difference based upon career choice
stemming back to undergraduate majors where women are known to prefer certain
fields (think education and nursing) relative to other fields that often feed
top MBA programs such as engineering and computer science.
An MBA from a prestigious university may greatly
improve the credentials of an engineer or computer geek relative to the minimal
improvement of a high school teacher relative to a masters degree in education.
Even within business disciplines an MBA from a prestigious university may be
of questionable value. For high demand for auditors and tax accountants the
large international CPA firms do not even recruit MBA graduates from Harvard,
Stanford, Wharton, Dartmouth, etc. Instead they recruit masters in accounting
graduates who chose accounting graduate studies so they could sit for the CPA
examination. And the proportions of women in those masters of accounting progrms
are much higher since the international CPA firms tend to hire more women than
men.
**How to Mislead With Statistics: The Best Chain Restaurants ---
http://time.com/money/5183389/best-casual-dining-restaurant-chains/?utm_source=time.com&utm_medium=email&utm_campaign=the-brief-pm&utm_content=2018030917pm&xid=newsletter-brief&eminfo=%7b%22EMAIL%22%3a%22MOt2LMJiSIk%2fSjadSWyB4I9Monw61fXF%22%2c%22BRAND%22%3a%22TD%22%2c%22CONTENT%22%3a%22Newsletter%22%2c%22UID%22%3a%22TD_TBP_D67FCAE7-F3B7-4357-9082-476F8ACD8245%22%2c%22SUBID%22%3a%2284575328%22%2c%22JOBID%22%3a%22669846%22%2c%22NEWSLETTER%22%3a%22THE_BRIEF_PM%22%2c%22ZIP%22%3a%2235864237%22%2c%22COUNTRY%22%3a%22%22%7d
Jensen Comment
None these is in our mountain region, so I really should not comment about this
selection. However, it appears that all specialize in menus of fat and sugar.
Some are quite expensive (think Ruby Tuesday and The Cheesecake Factory). I
don't know how many have great vegan alternatives, but I doubt that any of these
would make the top ranking by vegan customers.
Within a 30 mile radius of our cottage the 99 Restaurant is the most popular
medium-priced chain restaurant in terms of daily numbers of luncheon and dinner
customers (not open for breakfast), although for more romantic ambiance one
would probably pick a more expensive hotel or B&B dining room. For breakfast we
take our house guests to the Mt. Washington Hotel where you should arrive before
10:00 am since this really isn't a brunch alternative ---
https://www.omnihotels.com/hotels/bretton-woods-mount-washington?gclid=EAIaIQobChMIrfT6yYPg2QIVGksNCh0RbwyyEAAYASAAEgLVePD_BwE&gclsrc=aw.ds
Lunch and dinner are served with a view of the mountain and a great old-resort
ambiance, but prices are way too high for what you get for food. The breakfast
buffet is the best deal. In summer breakfast can be followed by an adventure on
the nearby Cog Railroad chugging up to the top of Mt. Washington repeatedly
until 4:00 pm. There is a restaurant at the top of the mountain, but it's not
great and mostly offers weather protection. It can be 90 degrees down below and
30 degrees on top with a 50+ mph wind and fog. In winter it sometimes drops to
-100F or lower with 100+ mph winds. But the Cog Railroad does not run in the
winter.
Cog Railroad
http://faculty.trinity.edu/rjensen/Tidbits/CogRailroad/History1/CogRailroadHistory.htm
http://faculty.trinity.edu/rjensen/Tidbits/Mountains/HistoryWhiteMountains/01/HistoryWhiteMoutains01.htm
By far the most popular breakfast and luncheon restaurant in the State of New
Hampshire is Polly's Pancake Parlor that's only one mile from our cottage. It is
not a chain, but people come to Sugar Hill from all over New England and parts
of Canada to eat at Polly's. Vegans are not so happy, however, unless they like
lots of carbs (think maple sugar condiments). In 2017 the very old farm building
that housed the restaurant elbow-to-elbow on long tables was replaced by a more
spacious new building. Polly's also added alcohol for the first time, although
diners really don't choose Polly's for the bar. In summer season. foliage
season, and on holidays be prepared to wait well over an hour for a table,
although you can call ahead to get on a waiting list. Polly's opens and 7:00 am
and closes at 3:00 pm. The mountain views are excellent, and there's almost
always a breeze on hot days. Come early or late to beat the long lines.
For over 100 years the old restaurant was attached to the original farm house
that served breakfast to people in horse carriages passing by ---
http://www.cs.trinity.edu/rjensen/Tidbits/2009/Tidbits090105.htm
Erika and I eat most often our Littleton Regional Hospital. More often than
that we take home luncheon meals to store for weekends. The hospital's dining
room ambiance sucks, but the chef from Austria is a former chef at the Von Trap
Family Lodge in Vermont. Before that he was a chef at Mackinac Island's Grand
Hotel. It's a long story how this chef ended up cooking in a tiny hospital. I
won't into details here. Sometimes chefs just grow weary of cooking for weddings
and conventions and other enormous crowds. On rare occasion Jurgen cooks for our
dinner parties here in our cottage. However, he does this as a friend and is not
in the home cooking business.
**How to Mislead With Statistics, in This Case Rankings
Computer Science ---
https://en.wikipedia.org/wiki/Computer_science
Note the wide-ranging sub-disciplines and distinctions between theory and
applications.
Controversial Ranking of the Top 50 Computer Science Programs in the World
---
http://www.businessinsider.com/best-computer-science-schools-in-the-world-2018-3#48-shanghai-jiao-tong-university-3
Jensen Comment
It's probably a fluke due to criterion weightings, but I don't quite agree with
the relatively low ranking of the University of Texas at Austin (rank 27).
Is the extremely wealthy and reputable UT program really inferior to Georgia
Tech (Rank 21), the University of Melbourne (Rank 15), the University of Toronto
(rank 11), and UCLA (rank 13)?
The rankings of graduate school programs in general does not imply that those
programs are great or even existent for top undergraduate students. For example
top ranking programs of business at Harvard and Stanford do not even have
undergraduate business programs.
The rankings were taken from
https://www.topuniversities.com/university-rankings/university-subject-rankings/2018/computer-science-information-systems
The criteria are academic reputation (however defined?), employer reputation
(however defined?), citations per paper (where there's a lot of cheating by
publishers), and H-index citations.
H-index ---
https://en.wikipedia.org/wiki/H-index
H-index criticisms ----
https://en.wikipedia.org/wiki/H-index#Criticism
There's also some doubt in my mind how to define "computer science" in the
first place. Some programs are very consolidated whereas in others the programs
my be dispersed among schools of engineering, science, mathematics, and even
business where there's often more money to buy top talent and top students.
In my opinion, the term "computer science" is too broad and ambiguous. There
are so many widely divergent sub-disciplines where the reputation rankings
within a sub-discipline may vary drastically from the rankings shown in the
above Business Insider link. It's a little like ranking of "business" programs.
Harvard and Stanford for example have top "business" programs that provide
virtually zero graduates for the accounting profession defined in terms of
financial accounting and managerial accounting and tax accounting. Accounting
employers would probably exclude Harvard and Stanford when ranking financial
accounting and managerial accounting programs, although both Stanford and
Harvard have top accounting doctoral programs that supply academic employers.
Bob Jensen's threads on ranking controversies ---
http://faculty.trinity.edu/rjensen/HigherEdControversies2.htm#BusinessSchoolRankings
Added Note
The world's top-ranked computer science program at MIT is amazing in that it
shares some of its top courses with anybody in the world willing to take MIT's
free MOOCs ---
http://faculty.trinity.edu/rjensen/000aaa/updateee.htm#OKI
Some of MIT's top students commenced by first taking one or more MOOCs.
**How to Mislead With Statistics
Less than 1% of Delta Flight Attendant Applicants are Accepted
It's harder to get invited to the Delta Flight Attendant training center than to
get into Harvard University ---
http://www.businessinsider.com/delta-airlines-flight-attendant-training-school-inside-look-2018-3
Jensen Comment
Yes Harvard has a higher acceptance rate, but saying it's "harder to be a flight
attendant" is misleading due to the lower population of applicants. It's a bit
analogous to saying it's harder to be a Delta flight attendant than a Delta
pilot.
The clinker here is that neither applicants to Harvard nor applicants to be
Delta pilots apply unless they themselves feel that they have sufficient
credentials to incur the cost and/or ordeal of applying. The same is true for
aspiring flight attendants but many, many more of those applicants think they
have sufficient credentials to be accepted.
The credentials themselves are far less rigorous in the case of flight
attendants.
**How to Mislead With Statistics
Gig Economy ---
https://en.wikipedia.org/wiki/Temporary_work
This is under the category "Temporary Work," but that's misleading since
more and more gig workers are going full time.
1 in 3 Workers Employed in Gig Economy, But Not All By Choice ---
https://www.usnews.com/news/articles/2016-10-11/1-in-3-workers-employed-in-gig-economy-but-not-all-by-choice
Jensen Comment
The gig workers are fairly evenly divided between men (49%) and women (51%).
Only 8% are seniors, and 23% are youths.
What is especially surprising is that only 21% are from
low income households.
This suggests that many gig workers are getting gigs for reasons other
than financial desperation. Some may just want to get out of the house or to add
to their work skills.
The Gig Economy: What a Stanford University Labor Economist Is Learning
by Driving for Uber ---
https://www.gsb.stanford.edu/insights/what-economist-learning-driving-uber?utm_source=Stanford+Business&utm_campaign=27713b1378-Stanford-Business-Issue-132-3-4-2018&utm_medium=email&utm_term=0_0b5214e34b-27713b1378-70265733&ct=t(Stanford-Business-Issue-132-3-4-2018)
Jensen Comment
Why is the "gig economy" becoming such a big deal in the takeover of traditional
employer-employee labor market and what are the consequences?
Not addressed in these articles is how colleges and universities are
increasingly tapping into the adjunct teaching market for various reasons
including budget constraints, avoiding tenure locks, and need for professional
specialties and experience that are not taught in Ph.D. programs.
**How to Mislead With Statistics (confounding variables)
Analysis: Bernie Sanders' $32 trillion Medicare-for-all plan is actually kind of
a bargain ---
https://www.msn.com/en-us/money/healthcare/analysis-bernie-sanders-dollar32-trillion-medicare-for-all-plan-is-actually-kind-of-a-bargain/ar-BBLhnEu?ocid=spartandhp
Jensen Comment
There are so many confounding variables that it's misleading to call Bernie's
proposed national health care plan a "bargain." First there's an enormous
problem are defining what health services are under the national plan and how
these have been factored into the claim that its a "bargain." For example, will
all citizens and people who cheat (illegal immigrants and legal immigrants on
work permits) be entitled very costly organ transplants (including heart
transplants), very costly medications, timely joint transplants (think knees and
hips), and long-term nursing care. At the moment only Medicaid recipients are
eligible for free long-term nursing care. When there is no Medicaid will
everybody be to free long-term nursing care.
Does Bernie's plan include euthanasia programs in the same way some other
nations greatly save on the cost of dying patients on their national health care
plans?
https://en.wikipedia.org/wiki/Euthanasia
On November 22, 2009 CBS Sixty Minutes aired a video
featuring experts (including physicians) explaining how the single largest drain
on the Medicare insurance fund is keeping dying people hopelessly alive who
could otherwise be allowed to die quicker and painlessly without artificially
prolonging life on ICU machines.
"The Cost of Dying," CBS Sixty Minutes Video, November 22, 2009
---
http://www.cbsnews.com/news/the-cost-of-dying-end-of-life-care/
Given that it's impossible to raise all the $32 trillion by added taxes to
the upper income people how much will the lower income people be required to
contribute to their medical services? For example, at present nearly half the
people who file income tax returns pay zero income taxes. Do the half paying
zero income taxes continue to pay zero income taxes when they have a national
health care plan?
Some liberals argue that we can pay for much more by nearly eliminating the
military budget. Are they aware that most of the military budget goes toward
paying pensions of retired military and the cost of VA military services that
will presumably added to the national health care plans in a big way? If you
eliminate the entire fighting force, the military budget will remain a huge
component of the long-term federal budget.
How much of a "bargain" will the national health care plan be after we build
a giant bureaucracy to administer the national health care program from coast to
coast.
Bernie argues that medical costs of physicians and medications will be
greatly reduced by government controls on prices. What about the almost certain
cost of shortages that will ensue such as the shortage of physicians (think
surgeons) in nations like Canada and the U.K.? What's the incentive to spend
many years becoming a highly specialized physician when you could become a
multi-millionaire in a short time by specializing in tech skills.
Many nations that have national health care plans only cover basics, and
private insurance is necessary for higher quality medical services. Exhibit A is
the German national health care plan. In part this is due to the need to pay the
best physicians higher fees in order to have them endure the long and difficult
road to becoming the best physicians.
Bernie never mentions that most nations with health care plans are having
great troubles financing those plans without greatly reducing the quality of
health care plans. Bernie fails to mention that most of the nations with
national health care plans have relatively low military budgets. The U.K for
years was an exception, but now the U.K. is spending less and less on the
military to where calling it a formidable military is a joke. The once mighty
French navy is down to one aircraft carrier. The U.K. has two ---
https://www.popularmechanics.com/military/navy-ships/g2412/a-global-roundup-of-aircraft-carriers/
One key difference is that the
U.K. has shrunk its military down to about 5% of the budget whereas the USA is
hanging in at around 16% of a much larger federal budget ---
https://en.wikipedia.org/wiki/Military_budget_of_the_United_States
Also see
https://en.wikipedia.org/wiki/March_2017_United_Kingdom_budget
**How to Mislead With Statistics (confounding variables)
MIT’s (mostly with Stanford researchers) Uber study couldn’t possibly have been
right. It was still important ---
https://qz.com/1222744/mits-uber-study-couldnt-possibly-have-been-right-it-was-still-important/
Jensen Comment
The study appears to have been sloppy and unprofessional rather than
intentionally misleading even though it serves the liberal agenda.
The obvious question overlooked is why so many workers
volunteer for Uber when there are many opportunities for earning more than $3.37
per hour in this economy where help wanted signs are posted in front of nearly
all establishments?
Didn't the researchers think about that? The article points out some other
things these researchers overlooked.
The quote at the end of the article is a hoot:
Yes, $3.37 an hour was a crazy number. But when people are primed to believe
that driving for Uber is a crappy job, then you better bet they are going to
believe a prestigious academic study that comes along telling them exactly
that.
If you do a Google search most of the media (which tends to be
liberal) thinks the $3.37 is absolute fact. Abe Lincoln said it best:
"You can fool all the people some of the time, and some of the people all of the
time, but not . . . "
I'm not sure it takes such powerful cost accounting math as much
as it takes common sense. For example, depreciation of a car is a decline in
value that combines four important variables: Make versus Mileage versus Age
versus temporal Non-stationary Market prices and Variance in prices. No powerful
math can disentangle those confounded variables in spite of what Einstein wished
was the case. And the confounding varies with locale. For example, road salt in
New Hampshire increases the importance of Mileage relative to Age and Make such
that New Hampshire Uber drivers probably get hit harder than Arizona drivers,
but nobody can accurately measure the effect of salt in a particular car (that
differs from an average car). Other factors intervene such as how often the car
is washed and what is paid for the wash.
And even things like gas prices vary greatly from Texas to
Maryland to California.
And tips vary a lot with customers and conditions such as any
Uber driver tomorrow morning in New Hampshire will likely get a bigger tip
during a Nor'easter.
Thus its not the power of the math as much as it is the lack of
data for millions of variations in non-stationarities of the variables in a
given Uber trip.
**How to Mislead With Statistics
Why Americans Are Proud To Pay Taxes (presented at NYU on February 15, 2018)-
--
http://taxprof.typepad.com/taxprof_blog/2018/02/williamson-presents-why-americans-are-proud-to-pay-taxes-today-at-nyu.html
Conventional wisdom
holds that Americans hate taxes. But the conventional wisdom is wrong.
Bringing together national survey data with in-depth interviews, Read
My Lips presents
a surprising picture of tax attitudes in the United States. Vanessa
Williamson demonstrates that Americans view taxpaying as a civic
responsibility and a moral obligation. But they worry that others are
shirking their duties, in part because the experience of taxpaying misleads
Americans about who pays taxes and how much. Perceived "loopholes" convince
many income tax filers that a flat tax might actually raise taxes on the
rich, and the relative invisibility of the sales and payroll taxes
encourages many to underestimate the sizable tax contributions made by poor
and working people.
Americans
see being a taxpayer as a role worthy of pride and respect, a sign that one
is a contributing member of the community and the nation. For this reason,
the belief that many Americans are not paying their share is deeply
corrosive to the social fabric.
The widespread misperception that immigrants, the poor, and working-class
families pay little or no taxes substantially reduces public support for
progressive spending programs and undercuts the political standing of
low-income people. At the same time, the belief that the wealthy pay less
than their share diminishes confidence that the political process represents
most people.
Upending the idea of Americans as knee-jerk
opponents of taxes, Read
My Lips examines American
taxpaying as an act of political faith. Ironically, the depth of the
American civic commitment to taxpaying makes the failures of the tax system,
perceived and real, especially potent frustrations
Continued in article
Jensen Comment
NYU is a left-leaning university in New York that teaches tax loopholes. It
makes me wonder why in the very shadow of NYU those civic-minded taxpayers are
doing their best to avoid or defer income taxes.
Firstly, the high income folks on Wall Street and
most other parts of New York probably spend more for NY tax lawyers and NY
accounting firms to minimize their taxes and take advantage of every loophole in
the Federal and NY State tax code. At the moment New York's governor is leading
the charge to re-write the state's income tax code to provide loopholes for tax
avoidance of the forthcoming revisions of the Federal tax code.
Secondly, across the USA, nearly half the persons
who file tax returns owe zero income taxes and are simply filing for their
refunds or even their added cash from the earned income tax credit. Yes they pay
payroll taxes but in return they eventually want those to come back in the form
of Social Security and Medicare.
Thirdly, the $2 trillion tax avoiding underground economy is
enormous in the USA, especially among undocumented immigrants.
Case Studies in Gaming the Income Tax Laws
http://www.cs.trinity.edu/~rjensen/temp/TaxNoTax.htm
**How to Mislead
With Statistics
A Physics Journal Suggests Scientist Sampling Bias Might be Distorting View of
Upheaval Due to Global Warming ---
https://phys.org/news/2018-02-sampling-bias-distorting-view-upheaval.html
Critics
have argued that the evidence of an association between climate change and
conflict is flawed because the research relies on a dependent variable
sampling strategy. Similarly, it has been hypothesized that convenience of
access biases the sample of cases studied (the 'streetlight effect'). This
also gives rise to claims that the climate–conflict literature stigmatizes
some places as being more 'naturally' violent. Yet there has been no proof
of such sampling patterns. Here we test whether climate–conflict research is
based on such a biased sample through a systematic review of the literature.
We demonstrate that research on climate change and violent conflict suffers
from a streetlight effect. Further, studies which focus on a small number of
cases in particular are strongly informed by cases where there has been
conflict, do not sample on the independent variables (climate impact or
risk), and hence tend to find some association between these two variables.
These biases mean that research on climate change and conflict primarily
focuses on a few accessible regions, overstates the links between both
phenomena and cannot explain peaceful outcomes from climate change. This
could result in maladaptive responses in those places that are stigmatized
as being inherently more prone to climate-induced violence.
**How to Mislead With Statistics
International Student Numbers Decline ---
http://www.insidehighered.com/news/2018/01/22/nsf-report-documents-declines-international-enrollments-after-years-growth?mc_cid=3623f31501&mc_eid=1e78f7c952
In November,
Open Doors reported a 3.3 percent decline in new (as opposed to total)
international students
in the 2016-17 academic year and an overall
flattening of growth.
A companion "snapshot"
survey IIE conducted in association with other academic groups asked about
500 institutions about their international enrollments for the current
academic year. Over all, the universities in the survey reported an average
decline in new international enrollments of 7 percent. But the declines
weren't being felt across the board: while 45 percent of institutions
responding to the snapshot survey reported declines in new international
students, 31 percent reported increases and 24 percent reported no change.
Among the reasons
university officials have given for the declines in international student
enrollments are the political and social environment in the U.S.,
the high cost of U.S. higher education, visa denial and delays, increasing
competition from other countries, and changes to other governments'
scholarship programs, such as Saudi Arabia's.
Here are a few of the
international enrollment-related highlights of the NSF report:
§
At the
undergraduate level, the number of international students increased in
computer sciences (11 percent) and mathematics (5 percent) and declined
in engineering (-5 percent), social sciences (-3 percent) and nonscience
and engineering fields (-4 percent), from 2016 to 2017.
§
The top five
countries sending international science and engineering undergraduates
to the U.S. in fall 2017 were China, Saudi Arabia, India, South Korea
and Kuwait. From fall 2016 to 2017, the number of undergraduates
studying science and engineering increased from China (3 percent), India
(11 percent) and Kuwait (4 percent), while the number decreased from
Saudi Arabia (-18 percent) and South Korea (-7 percent).
§
At the graduate
level, the number of international students decreased in the computer
sciences (-12.9 percent) and engineering (-7.6 percent) between fall
2016 and fall 2017. The number of international students increased in
mathematics (by 14.6 percent),and remained fairly stable in other
science and engineering fields.
The top
countries sending international science and engineering graduate students to
the U.S. were China and India -- which together account for 69 percent of
all international graduate students in science and engineering fields --
followed by Iran, South Korea, Saudi Arabia and Taiwan. From 2016 to 2017
the number of graduate science and engineering students increased from China
(4 percent) and Taiwan (5 percent), and decreased from India (-19 percent),
Saudi Arabia (-11 percent), Iran (-1 percent) and South Korea (-1 percent).
Jensen Comment
What is misleading is that students seeking to come to the USA because of the
election of Donald Trump would've had to make a decision to avoid the USA before
Donald Trump became President of the USA. In other words they would've had to
make their Visa applications out at a time when virtually all election polls
predicted a landslide win by Hillary Clinton.
This is pointed
out in comments to following the above article where one commenter writes:
Are these declining international students
clairvoyant?
In addition, fears that the current trend "could have negative implications
for U.S. competitiveness and the health of American graduate science and
engineering programs" seems exceptionally out of place when overall,
enrollments are declining so international enrollments should, too. Taxpayer
subsidized education at state flagships and NSF funded research
opportunities should go to our U.S. students/graduates first. Maybe, this
can be described better. Due to our reliance on cheap OPT labor, we are
worried that the massive number of STEM OPT F-1's will become more
statistically obvious during massive declines in other international student
enrollments and funders at the NSF are attempting to ensure cheap labor in
labs and research facilities, while not driving up indirect costs, by
conducting a study that creates fear when there is none-STEM OPT F-1s are
cheap and here to stay. We will still get F-1s from India and China to our
better state flagship universities and U.S. gradutes will be left with
student loans and angst over their choices. Thank goodness for this pipeline
of life-saving STEM international students, now how much are we saving on
FICA and health insurance? My Baby Boomer pension doesn't jive with working
in my own lab, I need some OPTs and I don't expect them to pay into my
Social Security, that is for American students/graduates!
But the media
pounces on the decline as mostly the fault of having Donald Trump become
President of the USA in 2017.
Having said this,
our current USA President ant the current turmoil in citizenship prospects for
students coming to the USA at the moment does not bode well for reversing the
declining trend in international student applications that commenced before
Trump was elected.
An
interesting statistic to follow in the future will be how many new foreign
students in Canadian universities eventually seek to come to the USA for
employment (and citizenship).
**How to Mislead With Statistics
100 Best Places to Live in the USA
http://time.com/money/collection/best-places-to-live-2017/?utm_source=time.com&utm_medium=email&utm_campaign=the-brief&utm_content=2018012212pm&xid=newsletter-brief
Jensen Comment
The first clue to misleading statistics is the relatively high number of towns
in California that make the Top 100 when town costs (think housing) is a
criterion in this ranking. This suggests to me that state costs (think state
income taxes, sales taxes, gasoline costs, etc. are were left out of the ranking
criteria. You cannot live in a town and be shielded from the high costs of
living in the state that contains the town. California is among the Top 5 states
in terms of living costs. Towns in other high cost states are included in the
rankings.
Of course the rankings in this study were not confined to living costs. There
were other considerations such as quality of schools. That, in turn, leads to a
bias in town size since larger towns and cities tend to have more troubled
public schools (think gangs) and living costs that often drive the best teachers
to smaller towns.
The "test place" to live for a given person varies greatly for things not
considered in this article. For example, San Antonio (an nearby towns) are
extremely popular places to live for retired veterans of the military. This is
largely because those retire folks get access to great military hospitals,
include medical command hospital at Fort Sam Houston and a big VA hospital. Also
there are other benefits such as tax free shopping at base exchanges, base golf
courses, military clubs, and most of all --- a a social community of tens of
thousands of military retirees who have already located in the San Antonio area.
There are of course many other "best place" criteria for certain individuals.
Some people like me love winter; others hate it. Some people like me hate heat
and humidity; others have a higher tolerance for South Florida and South Texas.
Chronicle of Higher Education
The above ranking seems to ignore employment opportunity and wage levels as a
criteria for choosing a place to live. Professionals like accountants,
attorneys, and physicians often face lower opportunities and revenues in smaller
communities, especially very rural communities. Blue collar workers certainly
face few job opportunities and wage rates.
A Dying Town: Here in a corner of Missouri and across America, the lack of
a college education has become a public-health crisis ---
https://www.chronicle.com/interactives/public-health?cid=db&elqTrackId=8e0605106c784d40abeef68721ce03f7&elq=3f78a602f46f4ce38b89816e51756272&elqaid=17292&elqat=1&elqCampaignId=7523
Drive 90 miles north on Interstate 55 from Memphis,
then 20 miles west on Route 412, cutting through seemingly endless fields of
cotton, rice, and soybeans. You’ll know you’ve arrived when you see the
sign: Welcome to Kennett. Hometown of Sheryl Crow.
This small town in southeastern Missouri used to
greet visitors with a different motto: "Service. Industry. Agriculture." But
the machine-parts-maker closed and the trailer manufacturer left and the
aluminum smelter went under. There’s not nearly as much industry around here
as there used to be. Sheryl Crow’s Grammys aren’t going anywhere.
Route 412 becomes First Street, and downtown opens
up with a McDonald’s to your left and a Burger King to your right. There are
just two grocery stores in town, but fast-food restaurants are everywhere.
It’s easier to find a pharmacy than a salad bar.
Outside the row of medical offices that border the
hospital, people pause for one last smoke. Mr. Chan’s still sells doughnuts
and kolaches, and Riggs Supply is, somehow, holding on, but there are many
boarded-up storefronts along First Street these days. Down the road, a
branch of the local college offers programs in education, criminal justice,
and agribusiness. College-going isn’t so common, though. In this area, just
one adult in 10 has a four-year degree.
Recently the town tried to revitalize the area
around the old county courthouse. It added new streetlights and redid the
sidewalks. But few people use them.
This is the Missouri Bootheel. The counties around
here are called that because if you squint at a map, it kind of looks like
the heel of a boot, jutting south from the rest of the state into Arkansas
and Tennessee. The name comes from its shape, but it’s something of a
metaphor, too. It can sometimes seem like life is trying to grind people
down.
It’s a place, one of many in America, where
disadvantages pile up. Researchers are uncovering links between education —
or lack of it — and health, and they don’t like what they see. It’s not
clear whether a college degree leads directly to better health, or, if so,
how. But the findings are alarming: Educational disparities and economic
malaise and lack of opportunity are making people like those in the Bootheel
sick. And maybe even killing them.
Continued in article
Jensen Comment
We seem to be reverting to small towns without medical services. In Swea City,
Iowa in the early 1900s there were no doctors, dentists, or even local law
enforcement in my Grandmother Dourte's home town. She had all her teeth pulled
at one time by a traveling dentist and watched her oldest son die upstairs from
pneumonia and her young daughter die on from a burst appendix. Most babies were
born inside homes with local midwives in attendance. Going off to college was
infrequent in these small towns. Today in this town most residents are retired
farmers --- there are not many high school graduates to go college, and those
that do go to college usually don't return to their small home towns.
he New Yorker Writes About a "Small" Iowa Town: Leave
or Stay
In a small town in Iowa where the American dream lives on, residents wonder
whether to resolve conflicts or fulfill their longings by moving away or staying
put ---
https://www.newyorker.com/magazine/2017/11/13/where-the-small-town-american-dream-lives-on?elqTrackId=cd9222bf37db46a7802121a2eec65d16&elq=3ce84d7ba2e64ee4b0c0144246469972&elqaid=16817&elqat=1&elqCampaignId=7280
Note that Orange City featured in this is a relatively large Iowa town in a
state filled with towns having less than 1,000 residents. There were many
"thriving" Iowa towns back in the days when they were surrounded by small family
farms of 80-160 acres. When I grew up in the 1950s on both a farm and later in
town farmers did not have to invest heavily in equipment, and most farmers were
still supplementing a small tractor with horses and mules. At harvest time
threshing machines moved from farm to farm, thereby making it unnecessary for
every farmer to own a threshing machine. Now making a living on 240 acres is a
marginal operation given the nearly $2 million needed for enormous tractors,
combines, sprayers. planters, tanks, etc. There's no profit in raising a few
cows, sheep, chickens, and turkeys that are now raised in enormous containment
feeding operations holding thousands or tens of thousands of animals.
When the families sold off their small farms to bigger farms
there were fewer and fewer customers shopping in small Iowa farm towns. Many
downtown stores were boarded up or torn down and town schools closed to become
part of every larger school districts covering multiple towns. Jobs dried up in
the small towns such that residents that wanted to stay either could not find
and work or could only find part-time work at minimum wage --- not a living wage
for a family.
One of the things that shocked me is that there was almost no market for the
big two-story house my grandfather built in Swea City around 1900. The
oak-paneled house had four bedrooms plus a den along with a living room, dining
room, big kitchen, and den. When I returned for a visit to Swea City in the
1960s this well-maintained house with a big porch could be purchased for less
than $10,000. In Des Moines such a house would be priced at well over $100,000.
The thing is that Des Moines has a viable economy with over 200,000 residents
and many career opportunities to work in town. Swea City has around 500
residents, most of whom are retired farmers who choose living in Swea City
because of the cheap housing. But they have to drive over 30 miles to larger
towns for shopping since the grocery stores, the clothing stores, the hardware
stores, the drug stores, etc. are now boarded over in Swea City. There are very
few jobs available today in Swea City, Iowa.
What caused the demise of small Iowa towns like Swea City?
Firstly, it was the demise of the small family farms that used to surround the
towns with a customer base. Second, it was the change in professional services
where professionals like physicians and lawyers now prefer to no longer be
sole-practitioners serving a small community. Now professionals prefer to be in
medical clinics and multiple-partner law firms located in larger towns and
serving smaller communities from a distance. What medical school graduate or law
school graduate wants to set up a one-person practice in Swea City, Iowa?
Thirdly, it was changing roads and vehicles. In the 1960s Iowa knocked the curbs
off its narrow highways and straitened out the sharp curves such that the trip
from Swea to the larger Algona now takes about 30 minutes for shopping rather
than upwards of an hour that it used to take in the 1930s. Plus in the 1930s
drivers sometimes had to stop once or twice to put patches on inner tubes of
flat tires. In the 21st Century it's relatively rare to have a flat tire driving
from Swea City to Algona.
The economic sacrifice made to raise a family in a small Iowa town is
negatively correlated with the size of the town coupled with other factors such
as having an area college and hospital in the town and commuting distance to a
larger town for jobs. Orange City featured in the above article has over 6,000
residents making it a relatively large Iowa town. But it's also remotely located
such that not many residents want to commute elsewhere for jobs.
That makes the above article somewhat interesting since
there are some economic opportunities in Orange City for those who want to
remain and raise their families in Orange City.
**How to mislead with statistics
A new NBER paper finds an increase in male mortality immediately after
retiring at age 62 ---
http://www.thinkadvisor.com/2018/01/02/early-retirement-aligns-with-early-death-study-fin?&slreturn=1515496097
Thanks to Glen Gray for the heads up.
Jensen Comment
Although the report is pretty good about noting the limitations of its findings
it's important to note that electing to start Social Security at age 62 is not a
random event. People in their early 60s do not flip coins to decide whether or
not to take early SS payments at age 62. Many have medical issues, some life
threatening, that increase the odds of choosing early payments. Also most
individuals have some knowledge of their own life expectancy. Firstly, they know
their prior medical history such as already having had cancer or two heart
attacks. Secondly, they know something about their genetic history such as
having ancestors that live to ripe old ages.
For many taking early retirement does not mean quitting
work. Some change jobs, but others stay of the same job. Note that benefits may
be reduced by starting SS payments at age 62.
My main point here is that this is an
illustration of where statistical findings should probably not have a major
impact on individual choices because the statistical findings are misleading for
particular instances --- like the particular instance of your SS timing
decision.
At what age should you start your
Social Security benefits?
https://www.schwab.com/resource-center/insights/content/when-should-you-take-social-security?cmp=em-QYC
Jensen Comment
For those contemplating starting up Social Security benefits before age 65, keep
in mind that Medicare is not available until age 65 except for people who
qualify for Medicare under approved disability benefits. Note that it's possible
to start SS benefits under disability at most any age. Those benefits may or may
not carry Medicare benefits. My wife got SS disability benefits and Medicare
benefits well before she was 60 years of age (she's had 17 spine surgeries). One
of our daughters got SS disability benefits without Medicare benefits when she
was much younger. Her husband, however, had family medical insurance through his
university faculty employer.
If you are legitimately disabled
you should probably apply for SS disability payments whenever you are unable to
work and your other disability coverage is about to expire. It's best, in my
opinion, to talk to specialized lawyers who will carry the ball on your SS
disability. application. Getting approval may take years.
How to Manage Your Finances
When One Spouse Retires – and the Other Doesn’t ---
http://money.usnews.com/money/retirement/articles/2017-04-28/how-to-manage-your-finances-when-one-spouse-retires-and-the-other-doesnt
**How to Mislead With Statistics
A Yale Psychiatrist Evaluates the Mental Health of Trump — and the Nation
by Paul Baskin
Chronicle of Higher Education
January 4, 2018
https://www.chronicle.com/article/A-Yale-Psychiatrist-Evaluates/242157?cid=at&utm_source=at&utm_medium=en&elqTrackId=1eee1d9770344f5099647003ee9c9ca5&elq=87dcdc3a299a4a73a7fdbc0c152548d8&elqaid=17313&elqat=1&elqCampaignId=7543
. . .
Q. Given that you see policies such as the recently
enacted tax bill, and the accompanying undermining of the nation’s
health-insurance protections, as directly linked to income inequality and
greater societal violence, why aren’t more of your professional colleagues (psychiatirsts)
getting more involved in helping to shape public policy?
Continued in article
Jensen Comment
Is everyone favoring the "recently enacted tax bill" or not favoring Obamacare
mentally ill?
This is the worst articles I've ever read in the Chronicle of
Higher Education
The Chronicle is now so paranoid that it will only allow readers to comment on
articles about motherhood and apple pie.
Spurious Correlation ---
https://en.wikipedia.org/wiki/Spurious_relationship
Confounding Variables ---
https://en.wikipedia.org/wiki/Confounding
**How to Mislead With Statistics: Spurious Correlations Have Varying
Degrees of Implications
Booze May Help or Harm the Heart, but Money Counts (at least in Norway)
https://www.webmd.com/mental-health/addiction/news/20180102/booze-may-help-or-harm-the-heart-but-money_counts
How to Mislead With Testamonials
104-Year-Old Woman Says Lots of Diet Coke Is the Key to a Long Life ---
https://www.msn.com/en-us/health/healthtrending/104-year-old-woman-says-lots-of-diet-coke-is-the-key-to-a-long-life/ar-BBHTE0f?li=BBmkt5R&ocid=spartandhp
Jensen Comment
Confounding variables in spurious correlations have varying degrees of
ambiguity. For example, Yates' discovery of correlation of Danish birthrates
with the number of stork nests in Denmark probably has some confounding factors,
but the confounding relationships are quite ambiguous. On the other hand,
correlations of ice cream sales and swimming pool drowning deaths are more
directly related to increased number of people (especially young children)
swimming on hotter days.
The relationships in Norway between alcohol consumption and
heart attacks and wealth, according to the article, are less ambiguous since
wealthy Norwegians probably have more heart-healthy diets and life styles.
However, there could be other intervening factors such as gender (wealthy women
living longer due to chromosomes) or stress (being poor with two or more jobs
might be more stressful). And even in nations with national health insurance,
wealthy people generally are more apt to have the best physicians. A close
physicist friend of ours says this is most certainly the case in Germany.
The problem attributing
life's longevity to one can or more of diet coke per day is enormously
problematic. How many people will commence to follow suit on this very dangerous
and misleading claim? Diet sodas in general are widely known to have health
risks. What is needed for a more complete statistical analysis is more data
about people who drank about the same amount of Diet Coke per day and died
young. My guess is that we can find millions. But those findings will probably
not have nearly as much influence as this claim by a very old woman deceived by
spurious correlation. The real problem is that there are so many confounding
factors affecting life and death that spurious correlations for and against Diet
Coke are irresponsible without scientific clinical trials on this issue.
In data analysis the main problem with correlations is that
the number of confounding variables and their higher order interactions may be
almost endless. Add to this the contingency factors. For example, the odds of a
swimming pool death may change dramatically with the presence of a life guard or
the number of swimmers per life guard or pool regulations (such requiring a
young child to be swimming with an adult).
In the case of Diet Coke,
the odds of living longer may change dramatically with genetic history, diet in
general, life style, physical attributes, and on and on and on.
**How to Mislead With Statistics
The New York Times Interactive Tax Calculator
https://www.nytimes.com/interactive/2017/12/17/upshot/tax-calculator.html
Jensen Comment
This is an example where averages can be misleading. For example, because my
wife and I have relatively large medical deductions the NYT Calculator is
seriously incorrect. It will be even more incorrect for those having long-term
care nursing expenses (fortunately not us, yet) ---
https://www.washingtonpost.com/business/the-latest-trump-predicts-monumental-tax-bill-will-pass/2017/12/15/b982d956-e1aa-11e7-b2e9-8c636f076c76_story.html?utm_term=.a44a56e4bcc4
In fairness the NYT article mentions many of the misleading aspects of its
calculator.
**How to Mislead With Statistics
Almost everything is wrong with the new tax law
(according to left-wing Princeton economist Alan Blinder)---
http://taxprof.typepad.com/taxprof_blog/2017/12/almost-everything-is-wrong-with-the-new-tax-law.html
Jensen Comment
Professor Blinder makes some pretty wild and unsubstantiated (unprofessional?)
claims himself. Firstly he claims that most individuals will not see tax cuts.
Even the liberal New York Times estimates that 75% of the taxpayers that
actually pay personal income taxes will see tax cuts (at least in the short
term) ---
https://www.nytimes.com/interactive/2017/12/17/upshot/tax-calculator.html
Whether or not the tax cuts are permanent depends heavily upon whether or not
Republicans retain control of the House, Senate, and Presidency. If they do the
"temporary" tax cuts are likely to be renewed (as suggested by the NYT).
The taxpayers who will
not see temporary tax cuts are either either low income tax return filers who
currently file tax returns to get nearly full refunds or
high income tax filers hurt badly by the $10,000 cap on state income tax
and property tax deductions.
Secondly, Professor
Blinder claims that virtually all polls show the tax revisions are wildly
unpopular. Most polls show the voters are largely split on the tax plan. Here's
what the liberal Politico poll concluded on December 19, 2017:
The survey, conducted Dec. 14-18, shows a
narrow, 42 percent plurality of voters support legislation, introduced by
Republicans in Congress, that makes widespread changes to the U.S. tax
system. Slightly less, 39 percent, oppose the legislation. The remaining 18
percent of voters are undecided.
The Cato Institute concludes that the middle class
gets the largest personal tax breaks in this legislation, which makes sense
since the lower income class was not paying income taxes before these cuts (they
do incur payroll taxes, property taxes, and sales taxes not directly affected by
income tax reform). High income people are hit hard by the capping of state
income and property taxes to a maximum $10,000 deduction. In the middle, folks
who rely on the standard deduction are helped. Other folks itemized deductions
with less than $10,000 in property taxes are probably helped ---
https://www.cato.org/blog/gop-tax-plan-middle-class-gets-largest-cuts?gclid=EAIaIQobChMIveOpioe12AIV1DuBCh2qKwsdEAMYASAAEgJ8bvD_BwE
Even Bernie Sanders concedes that the tax cuts primarily benefit the middle
class. However, he's highly critical of most every other aspect of the
legislation ---
https://www.huffingtonpost.com/entry/bernie-sanders-middle-class-tax-ctuts-gop-bill_us_5a4439b3e4b0b0e5a7a499e8
Academics are split largely on the long-run
projections of the trickle-down benefits of the tax cuts on jobs and economic
growth. Professor Blinder from Princeton coming in from the far left projects.
along with the liberal (not really bi-partison CBO) that there will be huge
Federal deficit increases resulting from the tax cuts. Academic economists
coming in from the right are more optimistic about the long-term benefits ---
http://www.aei.org/publication/how-much-economic-growth-can-tax-reform-deliver/
Like virtually everything in economic forecasting, the forecasts depend upon
assumptions upon which economists and politicians will never agree.
One thing is certain. Isolating the impact of this one piece of legislation
on jobs, trade, and the economy is virtually impossible given the complex
multivariate interactions on jobs, trade, and the economy. As was the case for
the Regan tax cuts, there will never be agreement on the role this one piece of
legislation will have now that it's history. Political animosity runs too deep
in the USA for agreement on almost any political issue.
**How to Mislead With Statistics
The State of K-12 USA
Education for 2017 in 10 Charts ---
https://www.edweek.org/ew/section/multimedia/us-education-in-2017-in-10-charts.html?cmp=eml-enl-eu-news2&M=58320161&U=2290378
Jensen Comment
The first chart showing Wyoming and much of New England ahead of the other
states in the USA confuses me somewhat. It's not exactly a Red versus Blue state
issue since Blue states of Vermont and Massachusetts come out high along with
Wyoming. I don't count New Hampshire as a Blue state since it is only Blue
because it allows residents of Vermont and Massachusetts to vote in NH
elections. The key issue is not a large versus small population issue according
to this initial chart since Vermont and New Hampshire are small but
Massachusetts has a lot of people. Reasons could be somewhat racial in nature,
but this is a cloudy factor given outcomes in such states as Maine, Rhode
Island, Utah, Idaho, and Montana. My conclusion is that any serious explanation
of the first chart will have to be quite complicated.
2017’s Top 10 Quotes on Education Issues ---
https://www.edweek.org/ew/section/multimedia/2017s-top-10-quotes-on-education-issues.html?cmp=eml-enl-eu-news2&M=58320161&U=2290378
Education Performance by State ---
https://www.edweek.org/ew/section/multimedia/us-education-in-2017-in-10-charts.html?cmp=eml-enl-eu-news2&M=58320161&U=2290378
Teacher Pay by States ---
http://blogs.edweek.org/edweek/teacherbeat/2017/02/which_states_pay_teachers_the_.html?cmp=eml-eb-popyear17+12212017&M=58321116&U=2290378
Jensen Comment on Education Performance versus Teacher Pay
At first blush when comparing the above links it would seem that higher teacher
pay is not getting much bang for the buck in terms of education performance.
However, data comparisons are not so simple.
Firstly, cost of living differences must be factored in when comparing most
anything to pay. California housing, for example, is out of sight when compared
to Wyoming and rural New England states like Vermont and New Hampshire.
California and New York taxes are out of sight when compared to New Hampshire.
Secondly, education performance gets more complicated in states that are more
racially and culturally mixed (think all states on the border with Mexico)
versus Wyoming and New England.
Thirdly, think population, especially states with huge metropolitan areas
like California, Illinois, and New York versus Wyoming, Vermont, and New
Hampshire. Huge metropolitan areas present enormous problems (think turf wars,
gangs, and language mixes) that uniquely exist for K-12 schools in these
metropolises.
I don't have all the answers when comparing K-12 education performance with
teacher pay scales. What I do know is not to draw oversimplistic conclusions
when comparing performance charts with pay charts. Then again maybe our kids are
just smarter than your kids no matter what you pay your teachers. Yeah! That's
it!
*Medicare for All:
Administrative Costs Are Much Higher than You Think ---
https://mises.org/wire/medicare-all-administrative-costs-are-much-higher-you-think?utm_source=Mises+Institute+Subscriptions&utm_campaign=8a83a2b8d3-EMAIL_CAMPAIGN_9_21_2018_9_59_COPY_01&utm_medium=email&utm_term=0_8b52b2e1c0-8a83a2b8d3-228708937
**How to Mislead With Statistics
Left-Leaning VOX: The $21 trillion Pentagon accounting error that can’t pay
for Medicare-for-all, explained ---
https://www.vox.com/policy-and-politics/2018/12/3/18122947/pentagon-accounting-error-medicare-for-all
The US
military budget is such a bloated monstrosity that it contains accounting
errors that could finance two-thirds of the cost of a government-run
single-payer health insurance system. All Americans could visit an unlimited
array of doctors at no out of pocket cost. At least that’s a notion
spreading on left-wing Twitter and endorsed and amplified by newly elected
Rep.
Alexandria Ocasio-Cortez,
one of
Democrats’ biggest
2018 sensations
and an undeniable master at the fine art of
staying in the public
eye.
Unfortunately, it’s not true.
The idea
spread like a game of telephone from
a Nation article
to the US Congress while losing a crucial point of detail: The Pentagon’s
accounting errors are genuinely enormous, but they’re also just accounting
errors — they don’t represent actual money that can be spent on something
else.
Proponents of this vision have the political wind at their backs and
continue to deploy the idea effectively to win intra-party arguments without
really making any headway on the core obstacles to writing a
Medicare-for-all bill that could become law. That said, to the extent that
political power rather than concrete legislation is the goal, that’s
probably for the best.
Misunderstandings fly around on Twitter all the time, and
AOC’s level of policy knowledge is pretty typical for a member of Congress.
But this particular flub is telling about progressive frustration over the
double standard on military versus non-military spending, and also the
fraught state of play regarding the push for a Medicare-for-all program.
The Pentagon’s mystery $21 trillion, explained
The underlying article by Dave Lindorff in the Nation
that kicked this off is an investigative report into the
Defense Department’s accounting practices.
Lindorff reveals that Pentagon accounting is quite weak, that the department
keeps flunking outside audits, that funds are shifted between accounts
without proper oversight, and that overall documentation of what’s actually
happening with the Pentagon’s vast budget is extremely poor.
Lindorff goes beyond these observations to allege that what’s happening
amounts to deliberate fraud, the purpose of which is to persuade Congress to
increase appropriations levels beyond what would otherwise be approved.
Continued in article
Jensen Comment
We really cannot compare proposed Medicare-for-All plan without more specific
definitions of "Medicare-for-All" and the "cared for population." For example,
Medicare currently does not pay for the enormous cost of long-term nursing care.
Medicare only pays 80% of most of the things it does cover like hospital and
doctor care.
Also Medicare has built up trust funds over the 50 years using payroll
deductions from individuals and employers. The trust funds are not sustainable
at predicted usage rates, but it's not like the existing Medicare program did
not accumulate any finds for the elderly and disabled. A
Medicare-for-All plan does not have 50 years of payroll deductions to help pay
for an abrupt shock to the system.
Advocates of Medicare-for-All never mention that Medicare for all is mostly a
private sector program where claims are serviced in the private sector along
with private sector doctor, nursing, and medicine delivery of goods and
services. Medicare is not like the U.K. system where most services are delivered
by government employees.
The Nation's analysis of the Defense Department's expenses ignores the fact
that even if we entirely eliminated the current Army, Navy, and Air Force the
government's obligations to retired and disabled former military personnel would
carry on for hundreds of billions of dollars into the indefinite future. And how
long would the USA and its Medicare-for-All program survive without any Army,
Navy, and Air Force?
The Nation's analysis is an example of totally irresponsible and misleading
statistics.
WaPost fact-checker gives Ocasio-Cortez four Pinocchios for Pentagon claim
---
https://thehill.com/homenews/media/419730-wapost-fact-checker-gives-ocasio-cortez-four-pinocchios-for-pentagon-claim
**How to Mislead With Statistics
NYT: What Straight-A Students Get Wrong ---
https://www.nytimes.com/2018/12/08/opinion/college-gpa-career-success.html
Jensen Comment
What this article fails to mention is that the University of Georgia or Ohio
State University might well trounce any of the Top 4 college playoff teams if
only Georgia or Ohio State had made it to the 2018 college playoffs ---
https://www.foxnews.com/sports/college-football-playoff-alabama-clemson-notre-dame-and-oklahoma-chosen-as-final-four-teams
My point here is that in Google, Apple, Microsoft, Goldman
Sachs, or Deloitte the fact that 4.0 gpa students don't on average have higher
performance ratings that 3.7 gpa employees fails to overlook the fact that most
graduates hired by are rarely anything but high gpa students relative to other
graduates in their colleges' programs. There may be some adjustment such as when
employers may except a slightly lower gpa applicant from a prestigious
university that has the highest admission standards in the worlld.
My point is that to be a high
performance winner you have to get in the game, and only the highest
gpa students are likely to get in the game unless there is some mitigating
circumstance such as having a perfect GRE score or being a 2.85 gpa biology
major admitted to medical school because of a perfect MCAT score.
The problem for employers and
graduate school admissions officers these days is grade inflation across the USA
where nearly all applicants have close to a 4.0 gpa. This is why
employers and recruiting officers look to other criteria such as excelling in
extra-curricular activities and volunteer work such as teaching English or math
in Africa for a couple of years.
Having said this I concede that in terms of job
performance there are many criteria (and don't rule out luck) that frequently
override gpa or test scores. There's anecdotal evidence that CPA Exam gold medal
winners sometimes bomb out on the job (especially those with zero
personalities). There anecdotal evidence that incoming applicants with perfect
GMAT scores do worse that low GMAT performers with high grade averages.
The above NYT article makes some good points,
but it fails if some students become less concerned with
grades because they took the article to heart.
Luck, courage, and motivation may beat out grades and
skill --- but only if you are in the game to have a chance at high performance.
Think of those glum Georgia and Ohio State varsity
football players watching the 2018 college playoffs on television.
**How to mislead with
statistics
Jim Borden: America’s Biggest Fears – and Mine ---
https://www.jborden.com/americas-biggest-fears-and-mine/
Jensen Comment
This type of survey is misleading because it depends crucially upon
what questions are asked plus
how all questions are worded.
For example, there's a huge difference between the wording
of "illegal immigration" versus "Open borders to all seeking to enter." The
phrase "Illegal immigration" to most implies illegal immigration at rates
experienced in the last decade or so. The phrase "Open borders to all seeking to
enter" is an entirely different fear not mentioned in the survey, but it is a
fear that Trump probably wins heaviest on these days. Trump is not building his
political base on illegal immigration at present rates. He's building his base
on fears of open borders, and Democrats are not helping by avoiding mentioning
limits to welcomed immigration hordes.
There's a huge difference between the phrase "High medical
bills" versus "Spending $4+ trillion per year on Medicare-for-All." For many
spending $4+ trillion annually on most any single government program is the
most scary thing they can imagine. Others cannot even comprehend the difference
between $3 billion versus $3 trillion as long as fat cats pay the difference. At
$4+ trillion per year all cats will starve.
I also question how the sampling population "Americans"
was sampled. It's virtually impossible in research such as this to even reach
tens of millions of Americans, and there are tens of millions more who will
refuse to give out such information when contacted,
In other words, I contend that this study is more
misleading than helpful --- mostly due to what
questions are asked plus how all
questions are worded
WaPost fact-checker gives
Ocasio-Cortez four Pinocchios for Pentagon claim ---
https://thehill.com/homenews/media/419730-wapost-fact-checker-gives-ocasio-cortez-four-pinocchios-for-pentagon-claim
**How to Mislead With Statistics
The Left Is Lying About Why Life Expectancy Is Declining ---
https://therevolutionaryact.com/left-lying-life-expectancy/
. . .
There isn’t a single piece of information produced by the CDC yesterday that
would point to a deteriorating health care system or a poorly functioning
one as the cause of the decrease in life expectancy.
In fact, the opposite may be true. For example, although the overall life
expectancy dropped, the death rate amongst members of every age group except
25-44 year-olds and those over 84 years of age actually improved. Indeed, in
those groups engaged in greater health care consumption and therefore more
impacted by its quality (the 45-74 year olds) the mortality actually
dropped.
And although one could correctly argue that 85 year-olds and older are also
consumers of healthcare, the issues at play in this group are much more
complicated and no conclusion could be gleamed from the data available. It
was in those age groups that are not large consumers of health care where
the mortality rate rose.
So, if it isn’t healthcare, what could be causing the death rates of 25-44
year-olds to rise so precipitously? The CDC, Dr. Raj, and even the Wall
Street Journal
answered
this question: accidents and suicides made for a rising incidence of deaths,
with smaller increases from pneumonia and influenza.
Indeed, for the two biggest killers and the two most directly affected by
the quality of healthcare delivered — heart disease and cancer — the death
rates diminished markedly. (See Tables below.)
Continued in article
**How to Mislead With Statistics
Executive Compensation at Private and Public Colleges ---
https://www.chronicle.com/interactives/executive-compensation?cid=at&utm_source=at&utm_medium=en&elqTrackId=5bf52aed6e6e43f78f975b824c5d8930&elq=4a87f4bce9a24f229f506e5715ca9eba&elqaid=21627&elqat=1&elqCampaignId=10447#id=table_private_2016
Jensen Comment
All or part of the compensation may be fixed for some college executives versus
being commission-based according to some performance metric such as a percentage
of endowment funds raised. Those million-dollar salaries seem less outrageous
when they are commission-based.
Some effort is made in the above data to adjust for varying perks that are part
of compensation (such as free cars and housing) but many perks are just too
complicated to value for the data. For example, some college executives benefit
more from hitching rides on private jets than others. The typical private jet
arrangement is to hitch a ride on a corporate jet where a corporate CEO is a
rich alumnus and may even be on the college's Board of Trustees. Occasional and
infrequent hitched rides may be entirely personal at no added cost to the
company such as when a college executive's family hitches a ride to London for a
vacation --- when the jet is going to London anyway on corporate business. Such
a perk is seldom made to available to most employees down the line but may be
made available to some top college executives.
It's sometimes hard to distinguish personal and professional perks. When I
lived in San Antonio I was active in the Financial Executives Institute (FEI)
and was even its President one year. One of my close FEI friends was the CFO of
a well-known oil company. He occasionally invited me on a free jet ride, but
this was an offer from a friend. I'm sure college executives get similar offers
more because they are friends rather than because of their employment.
Do those free cars come with drivers at all times? Does that free mansion
come complete with staff such as cooks and maids?
My point here is that perks are uniquely crafted such there may not be
another college executive that has exactly the same perk package. There may be a
driver or a house maid, but the executive may have partly pay those perks.
Some college executives need more expensive security packages at times when
armed campus police must be nearby (even inside the house) or alongside on
flights. When I was at Trinity University one of my daily coffee mates was a
former Secret Service agent who had been assigned to Air Force One duty. Later
in life while being Chief of security at Trinity University he still had a
license to carry a side arm on any commercial airline flight. I don't think he
ever had to accompany his campus bosses (Trinity is a relatively
non-controversial campus) on any flight, but there are some college executives
who at times need such security details on and off campus.
Of course there are a lot of fee receptions and dinners, but there are many
times when the executives would rather be at home in the kitchen eating corn
flakes.
**How to mislead with statistics
Australia's horses and cows are killing more people than its snakes and spiders
https://www.businessinsider.com/australias-horses-and-cows-are-deadlier-than-its-snakes-and-spiders-2018-12
Jensen Comment
Big deal! Between 2008 and 2017, nine years, horses and cows killed 77 people in
Australia. Does that make them a serious death threat? In most instances the
cause of death is carelessness in handling the big animals.
Australia does have some of the most venomous snakes in the world. Apparently
they don't kill many people --- most likely because they seldom come in contact
with people ---
https://en.wikipedia.org/wiki/Venomous_snake
Spider bites are more apt to make you sick more than dead. In Australia the
poisonous spiders are limited to certain regions ---
https://en.wikipedia.org/wiki/Spider_bite#Australia
Like everybody else in the world, Australians should worry more about heart
disease and cancer.
*Bayesian Probability
---
https://en.wikipedia.org/wiki/Bayesian_probability
**How to Mislead Without Statistics: A Challenge for
Bayesians
Business Insider talked to psychologists to learn why people think they have a
shot at winning, despite the near-impossible odds ---
https://www.businessinsider.com/powerball-odds-why-people-think-theyll-win-2018-10#even-when-we-lose-we-think-were-just-short-of-winning-3
Jensen Comment
Probably the biggest mistake is thinking a succession of losses increases the
odds of winning --- thus keeping players clinging to a slot machine or throwing
the dice until morning's daylight or buying more and more lottery tickets after
a long string of losses.
There's a difference between buying a dream with one
lottery ticket (and expecting to lose with near certainty) and buying 20+
lottery tickets (and expecting you're due to win for a change).
There is a way of winning with certainty in some games by
more than doubling the bet with each succession of plays (known as the St.
Petersburg Paradox), but casinos and home poker players ban this by placing
upper limits on bets. In lotteries even millionaires cannot afford to follow a
SPP strategy.
The only real winners over time in a casino are the owners
of the casino, because odds always favor the casino over time.
The casino can of course lose to the one-time player who
gets lucky one time.
**How to mislead about understanding concepts
Challenge: Is it possible to write a children's book on accountancy?
Answer
Bob Jensen thinks it's virtually impossible for children to grasp the concepts
of contracting in terms of leases, derivatives, hedging, contingencies, Ponzi
schemes, tax sheltering, blockchain, cryptocurrency, etc.?
It would be terrific somebody out there could prove him wrong.
From a Chronicle of Higher Education
newsletter on October 18, 2018
Early in the
semester, Stan Eisen presents students in his upper-level biology courses
with an unusual choice: Would they prefer to take a final exam or write a
children’s book?
“I see it as
a tool to get students engaged so they see the topic as interesting,
fascinating, and worthwhile,” Eisen, a professor of biology at Christian
Brothers University, said of the book project.
It’s
also a means of achieving something that we
described
in last week’s newsletter: helping students construct knowledge. Or, as
Eisen said: “You really don’t understand something until you can teach it to
someone else.”
He started
offering them the option seven years ago, when his oldest granddaughter, who
was his inspiration for the idea, was 4. The first book was called Don't
Get Sick, Stan!, and students in his senior-level parasitology course
wrote about the parasitic diseases that can fester in a school cafeteria and
give a child abdominal distress or diarrhea.
It was
self-published and made for an excellent – if unconventional – holiday gift,
he says. There was even a book signing at a local shop.
Eisen
said he had often come across scholarly articles about the importance of
student engagement, which can be achieved through
high-impact practices
like experiential learning. In the natural
sciences, he says, such practices tend to take the form of experiments or
undergraduate research projects.
In contrast,
he says, producing a narrative from the course material and explaining it to
a child turns the project into a teaching tool. “As far as an experiential
opportunity,” he said, “I was onto something.”
It also
helps fulfill one of his larger teaching goals: for his students to leave
his course different from how they were when they started it.
Since then,
he’s offered the option to students in his course on invertebrate zoology,
who produced an alphabetical coloring book, All Creatures Small and
Smaller: The World of Invertebrates.
When he
presents the option to his students, he sticks to a few rules, borne of
trial and error. The students must be unanimous in their decision. He tried
allowing them to work in small groups on topics of their choosing, but he
found that the results weren’t as good. Now Eisen assigns the topic, and the
entire class of about 32 students works as a group.
He also asks
Samantha Alperin, chair of the education department, to give a presentation
to his students on how to write for children. “If you can make a 7-year-old
understand it,” he said, “you’ve accomplished something.”
The choice
that Eisen gives his students is interesting, in part, because the options
don’t necessarily achieve pedagogically similar goals. When I referred to
the book project as an alternative assessment, he stopped me. An assessment
like a multiple-choice test would help him gauge how well students can
answer questions about, say, the life cycles of parasites.
The book
project, though, is a teaching-and-learning tool. And it’s an experience in
many senses of the word – one that alumni have told him they recall fondly.
“Who remembers taking a final exam, a year or two or three years later?” he
asked.
Have you
replaced an exam with an unusual or creative assignment in your own course?
What were the tradeoffs
**How to Mislead With Statistics
The terrifying uncertainty at the heart of FiveThirtyEight’s election
forecasts ---
https://www.vox.com/2018/10/24/18009356/fivethirtyeight-nate-silver-election-2018-forecast-analysis
Jensen Comment
One thing about political polls is that they can change so suddenly as election
day grows closer and closer. Nate Silver learned a hard lesson in 2010 when
Scott Brown won the election to fill Ted Kennedy's senate seat. Nate Silver
predicted that Scott Brown would lose and was embarrassed professionally the
day after the election. The very late changes in voter
preferences were totally unexpected.
One thing the liberal media does not like to focus on much at the moment is
the timing of the 7,000+ migrant caravan headed this way on foot through Mexico
in October 2018. This particular caravan appears to be bad for Democratic
candidates who are largely avoiding making comments about the tide (more than
just the biggest mass headed this way in one caravan) headed this way just
before 2018 election ---
https://townhall.com/columnists/johnandandyschlafly/2018/10/24/dems-tonguetied-on-caravan-issue-n2531281?utm_source=thdaily&utm_medium=email&utm_campaign=nl&newsletterad=&bcid=b16c6f948f297f77432f990d4411617f&recip=17935167
The GOP is capitalizing on fears knowing that an overwhelming majority of USA
voters are frightened by these caravans and probably future tides of people
headed for the southern border of the USA even though there is great sympathy
about marchers' bleak futures in their gang-infested home nations, especially in
Latin America.
The Canadian Army was sent to the Quebec border not long ago to stem the tide
of Haitians trying to enter Canada.
NY Times ---
https://www.google.com/search?as_q=Canada+Army+Quebec+Border&as_epq=Haitian&as_oq=&as_eq=&as_nlo=&as_nhi=&lr=&cr=&as_qdr=all&as_sitesearch=&as_occt=any&safe=images&as_filetype=&as_rights=
Something similar happens statistically with temporal data in capital markets
research conducted by economics, finance, and accounting professors.
Market data is volatile and impacted greatly by transitory (daily) happenings in
the world.
From Two Former Presidents of the AAA
"Some Methodological Deficiencies in Empirical Research Articles in
Accounting." by Thomas R. Dyckman and Stephen A. Zeff , Accounting
Horizons: September 2014, Vol. 28, No. 3, pp. 695-712 ---
http://aaajournals.org/doi/full/10.2308/acch-50818 (not free)
This paper uses a sample of the regression and
behavioral papers published in The Accounting Review and the Journal of
Accounting Research from September 2012 through May 2013. We argue first
that the current research results reported in empirical regression papers
fail adequately to justify the time period adopted for the study.
Second, we maintain that the statistical analyses used in these papers as
well as in the behavioral papers have produced flawed results. We further
maintain that their tests of statistical significance are not appropriate
and, more importantly, that these studies do not�and cannot�properly address
the economic significance of the work. In other words, significance tests
are not tests of the economic meaningfulness of the results. We suggest ways
to avoid some but not all of these problems. We also argue that replication
studies, which have been essentially abandoned by accounting researchers,
can contribute to our search for truth, but few will be forthcoming unless
the academic reward system is modified.
The free SSRN version of this paper is at
http://papers.ssrn.com/sol3/papers.cfm?abstract_id=2324266
This Dyckman and Zeff paper is indirectly related to the following technical
econometrics research:
"The Econometrics of Temporal Aggregation - IV - Cointegration," by
David Giles, Econometrics Blog, September 13, 2014 ---
http://davegiles.blogspot.com/2014/09/the-econometrics-of-temporal.html
**How to Mislead With Statistics
Has Connecticut found a solution to underfunded public pensions?
https://www.statedatalab.org/news/detail/has-connecticut-found-a-solution-to-underfunded-public-pensions
“As pension solutions go, those are all pretty
standard stuff. But the other approach Connecticut is considering is truly
fresh. The state’s inventory of real assets on its books, such as office
buildings, parking lots, raw land or highway right-of-ways, identifies
nearly 7,000 properties. An initial estimate is that these assets could have
an overall value in the billions. If the state were to include certain state
enterprises, such as toll-roads, that number could reach even higher. A
question arose: In lieu of cash, can the state donate any of these real
assets as an in-kind contribution to its pension funds?”
Jensen Comment
There may be some assets of value that can be held by pension funds, but to say
that most of these assets have "overall value in the billions to pension funds."
is misleading. For example, raw land might have value if it can be quickly sold
with low transactions cost. However, selling some of this raw land may not be
such a hot idea such as selling flood plains or parks. Selling parking lots may
have some drawbacks if the parking lots will be developed in a way to leave lots
of people without parking. What about selling office buildings that house state
workers? Would the state have to start paying rent to owners? Could the owners
evict the state workers?
All told it seems to me that this is a very fuzzy
idea with enormous transactions costs as well as enormous long-term
losses to the state.
**How to Mislead With Statistics
Based on civil rights data released by the U.S. Department of Education,
ProPublica has built an interactive database to examine racial disparities in
educational opportunities and school discipline ---
https://projects.propublica.org/miseducation?elqTrackId=f06df2359e6340a6a4812a071e9b430e&elq=348c473b7310444cae0eee9348850b4b&elqaid=21012&elqat=1&elqCampaignId=9959
Scroll down to the table below the graph
Jensen Comment
I don't deny that there's racial inequality in schools. However, in terms of
discipline differences it struck me that the schools shown with the highest
disparity in in nonwhite student high discipline are also the schools with the
greatest likelihood of nonwhite teachers and administrators doling out the
discipline. The worst school districts are often the districts with the highest
proportion of single-parent homes where discipline at home is often more
difficult, especially in districts with a stronger influence of youth gangs.
My point is that the data reflect deeper societal
problems that go beyond racial bias of teachers and administrators. If
there was a magic bullet to eliminate racial bias in the classroom the data
might not dramatically change for the worst performing school districts. The
magic bullet has to be found outside the schools.
Of course some of the school districts with white majorities have disgraceful
racial prejudices in the schools that are reflected in this data.
**How to Mislead With Statistics
It Was Bound to Happen: Graduate Student Assistants’ ‘Fight for $15’
---
Click Here
Jensen Comment
What's the difference between paying a student $3,000 per semester versus $15
per hour for 200 hours? The amount of time a student actually works each
semester will probably vary greatly under either compensation contract.
Although I was fortunate to have a tuition plus room&board fellowship in my
accountancy Ph.D. studies at Stanford for five years, I also taught (my own
choice) an Economics Department undergraduate course on the side for extra cash.
It would be very difficult to clock the hours it took to teach that course. I
put in a lot of extra hours preparing to teach that class for the first time.
But in subsequent semesters it took a whole lot less time to teach that course.
Although all business and accounting doctoral students were given
shared offices on campus (mine was in the computer
center), as an economics instructor I was also given a private office on the
Quad above the Economics Department. I had a desk in an entire attic amidst the
rafters and the pigeons.
Graduate assistant compensation is a very difficult payment system to implement.
Graduate assistants usually don't punch time clocks. It's more like outsourcing
where they're given research assignments (such as searching for and making
copies of articles) in duties that they mix in with other activities when
they're in the library or on computers. Maybe they're asked to write some code
or perform a statistical analysis. Those tasks vary in
time, and it would be very difficult for the university to budget open-ended
hourly payment systems.
Sometimes graduate student assistants are given opportunities to be
co-authors in conducting research and publishing in journals that greatly
enhance their careers later on. Even if they're not
paid graduate assistants they are sometimes eager to be co-authors on papers
with highly reputable professors.
Often their assistantships are fixed stipends per term. The hours they put in
are often mixed with learning tasks that are difficult to partition from
paid-work tasks. Is the system sometimes abused? Of course it's often abused
with overwork or underwork, especially when the students are doing an assignment
that could be imposed whether or not they're being paid.
Graduate student assistants who assist in courses have varying types of
assignments. Sometimes they grade assignments or help write examinations.
Sometimes they teach classes or recitation sections for lecture classes taught
by professors. Their teaching roles may be part of a curriculum plan where they
would have to teach some classes whether getting paid or not.
My point here is that often, not always, graduate assistant work is
professional work that's difficult to meter on a time clock. What constitutes
teaching versus learning to teach? What constitutes "preparation" to teach a
class.
What constitutes research versus learning to do research?
*Supreme Court of the United States ---
https://en.wikipedia.org/wiki/Supreme_Court_of_the_United_States
**How to mislead with statistics
Physics and Math Predict Supreme Court Votes
http://www.physicscentral.com/explore/plus/supreme-court.cfm
Opinions of the Supreme Court
https://www.supremecourt.gov/opinions/slipopinion/18
Jensen Comment
I'm not taking issue with the records of the supreme court or models used to
predict judicial decision outcomes. What I do take issue with is how incomplete
these records are in judging the partisanship power of the Court or individual
members of the court based upon voting records. The power
of the Supreme Court is vast due to it's power to intimidate.
It's a lot like the trouble analysts have in trying to place fraud prevention
values on IRS tax audits or financial statement audits. We can examine
the records of actual audits in detecting fraud until the cows come home, but
we can never analyze frauds that never happened
because of fear of being detected in audits. The
same thing happens when trying to judge the Supreme Court and its members on the
basis of their voting records. What we cannot analyze is the vast set of all
cases or possible cases that never came to the court out of fear of what the
Court would decide.
I would contend that the more the Supreme Court is viewed as partisan the
larger the set of cases or potential cases that never will reach the court. For
example, after his decision on Obamacare and some other cases the current
Justice John Roberts is not viewed as horrifically conservative as many
progressives once feared. Justice Elena Kagan is not viewed as liberal as many
conservatives once feared. But these opinions are based
upon a relatively few number of cases that reached the Supreme Court.
The Supreme Court can be far more biased in selection of cases than in
deciding cases.
Furthermore, fear of a politicized court may prevent business firms, colleges,
states, etc. from even filing lawsuits initially out of fear of what might
happen on what is viewed as a "politicized" supreme court. For example,
California's new law favoring net neutrality is being challenged by the Federal
government. If California loses in a lower court decision will California be
afraid to carry the fight up to the current (post-Kavanaugh) Supreme Court?
Personally I think California might be foolish to appeal to the present USA
Supreme Court. California should fear that the Supreme Court's decision might
forever make it more difficult to fight for net neutrality --- net neutrality is
something I want badly. It may be better to wait until liberals have more power
to reinstate net neutrality in Congress and the White House.
My point here is that voting records per se are potentially misleading in
judging our Supreme Court or its individual members.
There is some evidence of Supreme Court bias on other grounds,
particularly the Harvard/Yale bias ---
http://articles.latimes.com/2010/may/12/opinion/la-oe-turley-supreme-court-20100512
I don't dispute this argument, although it is somewhat ironic that both
Justices Thomas and Sotomayor graduated from the Yale law school. I suspect that
these days the Yale Law School would like to disbar Justice Thomas even if he is
African American.
*The Political Divide in the News Media: When the media slants the news
Time Magazine: Trump's NAFTA Replacement Largely Maintains the Status Quo
on Free Trade ---
Click Here
Wall Street Journal: North American Trade Pact Soothes Investors,
Businesses: It won new concessions for U.S. farmers and created new rules for
digital commerce across the continent. ---
https://www.wsj.com/articles/trump-touts-new-trade-pact-with-canada-and-mexico-1538410785?tesla=y
New York Times: Changes for automakers, dairy farmers, labor unions and
large corporations headline the renegotiated U.S.M.C.A., which is poised to
replace Nafta.---
https://www.nytimes.com/2018/10/01/business/trump-nafta-usmca-differences.html
Fox News: Trump has just revolutionized global trade by replacing NAFTA
with USMCA ---
https://www.foxnews.com/opinion/trump-has-just-revolutionized-global-trade-by-replacing-nafta-with-usmca
Jensen Comment
The USMCA is a perfect test of how the media slants the news.
Years ago Time Magazine became an advocacy outlet for the Democratic Party.
When it reports news as opposed to opinion pieces it still slants the news
reporting to the left.
From get go Fox News was an advocacy outlet for the GOP. When it reports news
as opposed to opinion pieces it still slants the new reporting to the right.
The WSJ and NYT each are two papers folded into one. Opinion pieces are
slanted to the right in the WSJ and left in the NYT.
But the difference with the WSJ and NYT and other media outlets is that they
make a concerted effort to be less bipartisan in news reporting.
However, behind the scenes both newspapers cherry pick with some political bias
in what they report as news.
GALLUP: These are the most and least biased news outlets in
the US, according to Americans ---
https://www.businessinsider.com/most-biased-news-outlets-in-america-cnn-fox-nytimes-2018-8
Outcomes vary somewhat for Republicans Versus Democrats
+31 PBS News (least biased in spite of what I think is an
obviously biased Judy Woodruff who is offset somewhat by frequent
conservative guest David Brooks from the New York Times)
+23 Associated Press (right or left angles depend heavily
upon individual reporters)
+12 NPR (public funding means having to include a few
conservative segments)
+10 The Wall Street Journal (once accused of being two
newspapers --- the opinion page versus the rest of the newspaper)
+05 Tie between USA Today and CBS News
+04 ABC News
-07 Tie between The Washington Post and NBC News
-11 The New York Times (where David Brooks is overwhelmed)
-11 Vox
-22 Mother Jones
-27 CNN
-32 HuffPost
-37 MSNBC
-51 Tie between Brietbart and Fox News
Jensen Comment
The leading newspapers (based on circulation subscriptions) without TV programs
are more apt to be respected the most by college graduates, especially those
with advanced degrees. These leading newspapers are propped up heavily by
billionaires like Jeff Bezos, Rupert Murdock, and Carlos Slim. We should be
grateful that these billionaires enable those newspapers to pay the salaries of
so many reporters around the world in an era where revenues from advertising are
falling off.
Of course all news outlets rely
heavily on the Associated Press reporters. The news outlets cherry pick what AP
stories they publish or broadcast.
Newspapers of large USA cities are apt to be more biased than the
newspapers included in the above Gallup survey, newspapers like the Boston
Globe, Los Angeles Times, etc. However, Newspapers like the Chicago Tribune are
great for muckraking fraud investigations (think of the wonderful city hall
crime investigations records of the Chicago Tribune and Detroit Free Press in
this regard).
*Failure to Distinguish What is Legal versus Illegal
Trump's family used tax loopholes to game the system — here's how his tax cuts
might help others do the same ---
https://www.businessinsider.com/donald-fred-trump-family-profited-tax-loopholes-cuts-new-york-times-2018-10
. . .
Trump supporters have cast doubt on the Times's
reporting of the Trump family's tax maneuvers, arguing that such a
high-profile figure would have received lots of IRS tax scrutiny. According
to Trump's lawyers, his tax returns from 2009 on are still being audited by
the agency. So how could reporters detect
something the IRS missed?
Continued in article
Jensen Comment
The liberal press likes to call the legal tax loopholes used by Trump fraudulent
tax evasions. In my opinion, if Trump got away with tax loophole fraud it's as
much a reflection of IRS incompetence as it is a reflection on Trump. At these
amounts of money Trump had to be under close IRS scrutiny in those days, and
I don't believe the IRS is incompetent when it comes to investigating
billionaires' use of tax loopholes. Note that the reporters allegations
of fraud are all speculative. This appears to me to be a hatchet job for
political purposes. The good thing is that because of the
publicity Congress and the IRS may be pressured by the publicity to close some
of the loopholes.
I'm not a defender of what Trump did, but there's a huge difference between
using legal tax loopholes and fraudulent tax evasion. Trump certainly is not the
first billionaire to use tax loopholes. How about billionaire Carlos Slim who
owns the largest stake in The New York Times? Let's see the NYT
investigate his use of tax loopholes.
By the way Trump is not a genius on tax loopholes. The geniuses are his CPAs
and lawyers. Trump is more of an expert on beauty contestants.
The IRS does miss a lot of tax evasion fraud in part because the agency is
underfunded and overwhelmed by the number of tax returns. But the majority of
the tax evasion it misses is among lower profile and less wealthy taxpayers.
So where's the biggest fraud missed by the IRS?
It's in the $2+ trillion underground economy characterized by cash transactions
that go unreported. These transactions range from paying a maid $50 cash to
clean your house to $10,000 for a new roof in Texas to $8,000 to a dentist in
New Hampshire who infrequently gives huge discounts for cash payments on
expensive dental work. Investigate the tens of millions of football pools in
private homes and bars on Super Bowl Sunday.
If you are going to investigate Trump's actual
frauds look for instances when his companies paid cash under the table to
contractors who worked on parts of his buildings or paid cash for cleaning and
maintenance work.
Case Studies in Gaming the Income Tax Laws
http://www.cs.trinity.edu/~rjensen/temp/TaxNoTax.htm
**How to Mislead With Statistics
NYT: Brett Kavanaugh lacks the temperament and commitment to judicious
inquiry needed to serve on the U.S. Supreme Court say 2,500+ law professors
https://www.nytimes.com/interactive/2018/10/03/opinion/kavanaugh-law-professors-letter.html?elqTrackId=675135454ba64fa7b23327a9dca91b76&elq=346a31250cd3460fbda7441f772cf36d&elqaid=20815&elqat=1&elqCampaignId=9842
Jensen Comment
We could complain that this was not a random sampling of USA law professors.
However, random sampling would not change the outcomes much because there are so
few conservative law professors in the USA (less than 10%) ---
http://taxprof.typepad.com/taxprof_blog/2015/03/lindgren-the-most-under-represented-groups-in-law-teaching-.html
Also see
http://faculty.trinity.edu/rjensen/HigherEdControversies.htm#LiberalBias
Most liberal law school professors are so opposed to any conservative being
appointed to the Supreme Court they would answer any questions about
conservative candidate unfavorably, It has little or nothing to do with
Kavanaugh.
I follow some leading academic journals daily (such as the Chronicle of
Higher Education, Inside Higher Ed, etc.). The articles to date that I've seen
about conservatives are 100% negative.
This reveals to me how out of touch the Academy is with half (give or take)
of the electorate in the USA. Subjective evaluations on RateMyProfessors.com
reveal that professors are out of touch with a significant percentage of their
students who are often not as overwhelmingly liberal as their professors.
Just in case you're wondering I'm a liberal on such matters as gay rights,
abortion, birth control, and eventual national health coverage. However, I'm a
conservative on most economic issues and border control. I favor a German-style
limited national health care plan and oppose England's national health care. I
waiver a lot about affirmative action. That is very contingent upon
circumstances.
*Machines will soon outwork humanity ---
http://reports.weforum.org/future-of-jobs-2018/
Humanity performs about 71% of the work in 2018. By 2015 that will drop to 50%
and not stop dropping in the foreseeable future.
I can't recall the science fiction movie from years ago in which humans are
fatted up in pasture-like settings and used only for food for monsters that rule
the machines. That's science fiction, but it's going to be
a serious issue concerning what to do with "humanity" once humanity is no longer
needed for work.
**How to Mislead With Statistics (this is not science
fiction)
A World With Fewer Babies Spells Economic Trouble ---
https://www.bloomberg.com/news/articles/2018-09-14/humans-having-fewer-babies-is-a-big-economic-problem-quicktake
. . .
The
United Nations calculated the world’s population as of 2017 at
7.6 billion people,
a number it projects will grow to 11.2 billion at the end of this century,
after which it could begin to fall. But a lot of countries are going to
shrink
before then. With a fertility rate of only 1.6, China’s population will drop
28 percent by 2100, ceding the title of world’s most-populous nation to
India, the UN predicts. With a fertility rate of 1.4, Japan’s population
will plunge 34 percent by 2100. The U.S.’s headcount is expected to keep
growing, despite a low fertility rate of 1.8, because of large numbers of
immigrants,
though government policies could change that.
Continued in article
Jensen Comment
It's unbelievable that Bloomberg published such a misleading article that the
encourages increased birth rates at a time when climate change impacts on food
and water shortages are so dire for the next few decades while we await dramatic
and technologies to feed and water the existing world populace. The problem is
just not climate change. Before climate change was on everybody's mind
agricultural aquifers (think Nebraska and Oklahoma) were drying up from over
use.
It's unbelievable that Bloomberg would publish such a
misleading article when it's known that robotics and artificial intelligence
advances threaten so many labor markets, especially the unskilled labor markets
and even quite a few of the skilled labor markets where robots are even doing
complicated surgeries these days. Sure the birth rate in Japan is down, but a
high tech nation like Japan could lead the way in robotics and artificial
intelligence.
It's like Bloomberg merely wanted to paint a gloomy
picture of declining birthrates in some industrial nations while overlooking the
enormous problem of the ever-onward growth in world population amidst growing
resource shortages to meet that steady growth in global population. And we
really cannot rely on that growth leveling out in Year 2100 so far ahead in
time. The Mad Max era may have come and gone by then ---
https://en.wikipedia.org/wiki/Mad_Max
It's certain that there will be ever- increasing numbers
of immigrants in the USA and Europe because nothing,
certainly not walls, will stem the flow of undocumented immigration thru all
borders while health care, education, and higher incomes in the USA and Europe
serve as magnets for the sick and the poor.
**How to Mislead With Statistics
American Life Expectancy vs. Europe: It's Not About "Socialized Medicine" ----
https://mises.org/wire/american-life-expectancy-vs-europe-its-not-about-socialized-medicine?utm_source=Mises+Institute+Subscriptions&utm_campaign=ecd0810c45-EMAIL_CAMPAIGN_9_21_2018_9_59_COPY_01&utm_medium=email&utm_term=0_8b52b2e1c0-ecd0810c45-228708937
Everything You Know About Obesity Is Wrong ---
https://highline.huffingtonpost.com/articles/en/everything-you-know-about-obesity-is-wrong/
**How to Mislead With Statistics
American Life Expectancy vs. Europe: It's Not About "Socialized Medicine" ----
https://mises.org/wire/american-life-expectancy-vs-europe-its-not-about-socialized-medicine?utm_source=Mises+Institute+Subscriptions&utm_campaign=ecd0810c45-EMAIL_CAMPAIGN_9_21_2018_9_59_COPY_01&utm_medium=email&utm_term=0_8b52b2e1c0-ecd0810c45-228708937
Everything You Know About Obesity Is Wrong ---
https://highline.huffingtonpost.com/articles/en/everything-you-know-about-obesity-is-wrong/
Misleading With Wikipedia, Google, etc.
MIT: France has
handed Google a $57 million fine for breaking EU privacy laws ---
https://www.technologyreview.com/the-download/612809/france-has-handed-google-a-50-million-fine-for-breaking-eu-privacy-laws/?utm_campaign=the_download.unpaid.engagement&utm_source=hs_email&utm_medium=email&utm_content=69185384&_hsenc=p2ANqtz--y1g5BQuLMZarpfKJW-HPvXIT9tY3kc-5FXLG5ja28yGzbR18V4Ap1KEh78ctUJCRxSuT72tisD23lpIEx26ZcD-dRXw&_hsmi=69185384
Burning the Links But Not the Archives
Google forced to remove search results in EU 'right to be forgotten' case
---
https://www.cnet.com/news/google-reportedly-forced-to-remove-links-in-right-to-be-forgotten-case/
Jensen Comment
Why isn't the media also required to burn the historical
record?
Newspapers and magazines and books are not
required to delete print and online archives of news items whereas Google is
forced to not reference historical literature.
It's like keeping
Mein Kampf
("My Struggle") in the stacks while adopting a
policy while banning reference to it in the card catalog.
I might add that I favor the right to be forgotten in extreme cases such as
where the literature being referenced by Google is blatant fake news (which it
was not in the case of the Dutch surgeon).
Censorship is complicated. I think the person wanting to be forgotten should
have to make a case that the published news was fake or highly cherry picked.
Wikipedia is better than Google in this regard since the person implicated or
somebody else can edit the Wikipedia module to correct the record.
Unfortunately, there's more whitewashing than publishing a case for why news was
fake or in error.
I've seen instances of whitewashing in Wikipedia. For example, at one time
Wikipedia documented instances where
Paul
Krugman allegedly fabricated data or is widely accused of being wrong with
correct data. Now all links to those allegations (the
allegations are still in media archives) have been removed from Paul
Krugman's Wikipedia entry. Companies celebrities are notorious for deleting
negatives on Wikipedia.
The Guardian: Illustration of Where Krugman Was Wrong ---
https://www.theguardian.com/commentisfree/2018/jan/10/paul-krugman-mistake-white-working-class-voters-republicans
Forbes: What Krugman Gets Wrong ---
https://www.forbes.com/sites/timworstall/2017/07/31/nope-paul-krugmans-still-wrong-about-supply-side-economics/#7a2645516348
My point is that Paul Krugman is only one of millions of examples
where the negatives have been removed from Wikipedia but not from the media
archives.
Another example of whitewashing is the Wikipedia site for Alexandria Ocasio-Cortez
---
https://en.wikipedia.org/wiki/Alexandria_Ocasio-Cortez
Reference to the devastating Washington Post criticism of her claim that
accounting errors at the Pentagon could pay for 2/3 of the $30 trillion
Medicare-for-All cost. The WaPo gave her four Pinocchios on that one:
Alexandria Ocasio-Cortez's $21 trillion mistake - The Washington Post
https://www.washingtonpost.com/politics/.../alexandria-ocasio-cortezs-trillion-mistake/
Reference to this mistake was whitewashed from
Wikipedia.
How to Mislead With Wikipedia
https://en.wikipedia.org/wiki/New_York_Law_School
Jensen Comment
I've mentioned before how Wikipedia entries are often (certainly not always)
purged of negativism, especially in biographies, corporate modules, and other
organization modules. Exhibit A is the New York Law School (not to be confused
with the New York University Law School). The above module does not contain
negative issues that are troublesome about the New York Law School.
Moody's Continues New York Law School's Negative Financial Outlook, Citing
Its 26% Operating Deficit ---
https://www.law.com/newyorklawjournal/2019/02/08/new-york-law-school-still-faces-financial-challenges-moodys-finds/
I have not tracked the Wikipedia module over time for the NYLS. But I have
tracked some other Wikipedia modules over time. For example, at one time the
Wikipedia module for Paul Krugman cited articles that questioned his occasional
integrity lapses in using data. However, today all of these negative citations
have been removed from
https://en.wikipedia.org/wiki/Paul_Krugman
My point is that negativism is not always removed from Wikipedia modules. But
you cannot trust them to always be balanced for research purposes. They often
are biased toward the positive side, much like the bias that arises in reviews
of products on Amazon. Negative reviews often appear for products listed in
Amazon, but you can't trust them to be unbiased. Many of the positive reviews
are biased investors, employees, friends, and paid reviewers. Many of the
negative reviews are sponsored by competitors.
I don't think the Wikipedia modules suffer heavily from "fake news." However,
they do suffer hugely from cherry picking when it comes to biographies ---
https://en.wikipedia.org/wiki/Cherry_picking
It's possible in wikis to enter more balanced items, but don't count on those
newer entries to remain if they are bad news items.
As a test, investigate how often Wikipedia modules
fail to mention detected plagiarizing in their Wikipedia entries ---
http://faculty.trinity.edu/rjensen/Plagiarism.htm#Celebrities
It's surprising how often mention of plagiarism remains in their Wikipedia
modules, including those of Martine Luther King, Jr. and Jane Goodall.
Wikipedia is not entirely biased.
Moody's Continues New York Law School's Negative Financial Outlook, Citing
Its 26% Operating Deficit ---
https://www.law.com/newyorklawjournal/2019/02/08/new-york-law-school-still-faces-financial-challenges-moodys-finds/
I have not tracked the Wikipedia module over time for the NYLS. But I have
tracked some other Wikipedia modules over time. For example, at one time the
Wikipedia module for Paul Krugman cited articles that questioned his occasional
integrity lapses in using data. However, today all of these negative citations
have been removed from
https://en.wikipedia.org/wiki/Paul_Krugman
My point is that negativism is not always removed from Wikipedia modules. But
you cannot trust them to always be balanced for research purposes. They often
are biased toward the positive side, much like the bias that arises in reviews
of products on Amazon. Negative reviews often appear for products listed in
Amazon, but you can't trust them to be unbiased. Many of the positive reviews
are biased investors, employees, friends, and paid reviewers. Many of the
negative reviews are sponsored by competitors.
I don't think the Wikipedia modules suffer heavily from "fake news." However,
they do suffer hugely from cherry picking when it comes to biographies ---
https://en.wikipedia.org/wiki/Cherry_picking
It's possible in wikis to enter more balanced items, but don't count on those
newer entries to remain if they are bad news items.
As a test, investigate how often Wikipedia modules fail
to mention detected plagiarizing in their Wikipedia entries ---
http://faculty.trinity.edu/rjensen/Plagiarism.htm#Celebrities
It's surprising how often mention of plagiarism remains in their Wikipedia
modules, including those of Martine Luther King, Jr. and Jane Goodall.
Wikipedia is not entirely biased.
Why Wikipedia’s Medical Content Is Superior ---
https://slate.com/technology/2019/01/wikipedia-doctors-medical-knowledge-study.html
Jensen Comment
I've long thought that Wikipedia's content on most technical issues is quite
good (albeit not perfect). However, biographical data
obtained for names of people gets pretty whitewashed these days,
especially living people who can either whitewash a wiki themselves or hire
expert wiki whitewashers.
See below.
*Why
Wikipedia Is in Trouble: The Shrinking Pool of Volunteer Editors ---
http://time.com/4180414/wikipedia-15th-anniversary/?xid=newsletter-brief
Jensen Comment
One problem is that such a large portion of the volunteer editors must devote so
much time to political pages.
Another problem is that expert monitoring of
pages varies so much by discipline. Medical pages are widely poured over by
medical students. This is great for obvious reasons. Economics and finance
modules are actively sought out by the public such that error correction is more
probable. Many other disciplines like accounting do not assign Wikipedia editing
in college courses and, in my opinion, the public is less interested in
accountancy modules. This is sad in terms of both updating and error correction.
I wish accounting and business firms and college instructors encouraged more
accounting module editing.
Since Wikipedia receives no advertising or
direct government funding one of my donation priorities each and every year is
to give generously to Wikipedia ---
https://donate.wikimedia.org/w/index.php?title=Special:FundraiserLandingPage&country=US&uselang=en&utm_medium=sidebar&utm_source=donate&utm_campaign=C13_en.wikipedia.org
Wikipedia is a long ways from being perfect, but I can no longer visualize
scholarly life on balance without Wikipedia. For example, look at how many, many
outreach languages now have versions of Wikipedia ---
https://tools.wmflabs.org/xtools-articleinfo/?article=Main_Page&project=en.wikipedia.org
**How to Mislead With Statistics
"Computational Linguistics Reveals How Wikipedia Articles Are Biased Against
Women," MIT's Technology Review, February 2, 2015 ---
http://www.technologyreview.com/view/534616/computational-linguistics-reveals-how-wikipedia-articles-are-biased-against-women/?utm_campaign=newsletters&utm_source=newsletter-daily-all&utm_medium=email&utm_content=20150203
Jensen Comment
The biggest complaint I have with this article is that it does not explain or
even fully appreciate that Wikipedia is crowd
sourced. Articles about a man or about a woman cannot be written
or edited by that man or woman featured in the module. They modules have to be
written by others such as friends or colleagues. Consider the following
quotation from the BOVE article:
But there are other signs of a more insidious
gender bias that will be much harder to change. “We also find that the
way women are portrayed on Wikipedia starkly differs from the way men
are portrayed,” they say.
. . .
Wagner and co say that articles about women
tend to emphasize the fact that they are about a women by overusing
words like “woman,” “female,” or “lady” while articles about men tend
not to contain words like “man,” “masculine,” or “gentleman.” Words like
“married,” “divorced,” “children,” or “family” are also much more
frequently used in articles about women, they say.
There is no Wikipedia author or editorial board that writes the entries
about a man or a woman, although Wikipedia editors may modify the article
for slander or obviously inappropriate portrayals. But I deeply doubt that
the Wikipedia reviewers deliberately slant the article on gender issues.
That slant, if it exists, for a given entry was most likely put in by the
person who wrote or edited the entry, and there are millions of people
writing the entries about millions of men and women. My point is that
there's no single author or small group of authors who are writing these
entries.
Also virtually every biographical entry about a man or woman has a
"personal history" section that covers the history of marriages, divorces,
and children, and parents of the person in question. The words "married" and
"children" appear for virtually every person that was married and had
children irrespective of whether the person is male or female.
I'm not saying that there's not gender bias on occasion in Wikipedia.
What I am saying is that the gender bias over tens of millions of
biographies in Wikipedia are not the result of a gender-bias
conspiracy. That bias, when it appears in a module, exists is the result of
culture itself across tens of millions of authors of those biographies.
For example, I hypothesize that it's a culture thing when authors are
more apt to use the term "feminine" when writing about a woman versus
"masculine" when writing about a man. For centuries, authors about young
women frequently mention "tom boy" behaviors of young girls. How often do
authors talk about "girlie" features of young boys? It happens, but we've
read a lot more about "tom boys" in history than "girlie boys." --- Arnold
Schwarzenegger excepted.
the fact that gender bia is cultural does not make it right or wrong.
It is simply there, and perhaps we should applaud analysts trying to gather
data and change those cultural biases. Or perhaps we should applaud efforts
to keep those biases. As the saying goes "Viva Les Difference!"
Sometimes I think analysts go too far in misleading the public with their
statistics or in suggesting underlying causal intentions of those outcomes.
One of the best video clips from an American Accounting Association
annual meeting was the plenary speech of Jimmy Wales at the August 2014
annual meeting. I think this video is available only to AAA members (but I
could be wrong) ---
http://commons.aaahq.org/posts/0eddbcd42a
You can learn a lot about Wikipedia by watching this video.
Jimmy Wales is the leading cofounder of Wikipedia ---
http://en.wikipedia.org/wiki/Jimmy_Wales
And yet it describes how he was married three times. He is not described as
being "masculine" or "feminine."
Bob Jensen's threads on the history of professionalism and women ---
http://www.trinity.edu/rjensen/bookbob2.htm#Women